
Abstract
Background
Clinical assessments of motor symptoms rely on observations and subjective judgments against standardized scales, leading to variability due to confounders. Improving inter-rater agreement is essential for effective disease management.
Objective
We developed an objective rating system for Parkinson's disease (PD) that integrates computer vision (CV) and machine learning to correct potential discrepancies among raters while providing the basis for model performance to gain professional acceptance.
Methods
A prospective PD cohort (n = 128) were recruited from multi-centers. Motor examination videos were recorded using an android tablet with CV-based software following the MDS-UPDRS Part-III instructions. Videos included facial, upper- and lower-limb movements, arising from a chair, standing, and walking. Fifteen certified clinicians were recruited from multi-centers. For each video, five clinicians were randomly selected to independently rate the severity of motor symptoms, validate the videos and movement variables (MovVars). Machine learning algorithms were applied for automated rating and feature importance analysis. Inter-rater agreement among human raters and the agreement between artificial intelligence (AI)-generated ratings and expert consensus were calculated.
Results
For all validated videos (n = 1024), AI-based ratings showed an average absolute accuracy of 69.63% and an average acceptable accuracy of 98.78% against the clinician consensus. The mean absolute error between the AI-based scores and clinician consensus was 0.32, outperforming the inter-rater variability (0.65), potentially due to the combined utilization of diverse MovVars.
Conclusions
The algorithm enabled accurate video-based evaluation of mild motor symptom severity. AI-assisted assessment improved the inter-rater agreement, demonstrating the practical value of CV-based tools in screening, diagnosing, and treating movement disorders.
Plain language summary
Parkinson's disease affects how people move, and doctors assess the severity of symptoms using a standard checklist. However, these checks can depend on the doctor's experience and personal judgment, which makes the results different from one doctor to another. This inconsistency makes it hard to track the disease accurately over time and tailor treatments effectively. Our team aimed to create a more consistent way to assess the motor symptoms automatically. We developed a system using advanced artificial intelligence (AI) that enables recording and analyzing motor examination videos by a tablet. This system looks for detailed signs that are hard for the naked eye to see reliably. It then calculates scores based on motor signs to show symptom severity. We tested this system with 128 participants across four hospitals, focusing on videos capturing facial expressions, limb movements, getting up from a chair, posture, and gait. We found that the signs and scores from our system matched well with those given by a group of experienced experts. It can serve as a “second reader” to help doctors calibrate their assessments. A key feature of our AI system is that it explains how it makes decisions, unlike many other AI systems that are like a “black box”. This helps doctors and patients understand the symptoms better. The video-based assessment is highly convenient and portable, making it suitable for widespread adoption across various healthcare facilities, including home settings. This expansion would enable more patients to get professional evaluations, improving access to quality healthcare services.
Introduction
Parkinson's disease (PD) is the most prevalent neurodegenerative movement disorder, and the global number of PD patients is expected to continue rising, imposing substantial economic and social burdens.1,2 However, objective biomarkers for PD diagnosis and monitoring remain elusive. The evaluation of cardinal motor symptoms, which relies on clinician-administered standardized rating scales, is central to diagnosis and prognosis. The Movement Disorder Society-Unified PD Rating Scale (MDS-UPDRS) part III has long been the gold standard for assessing motor signs in people with PD (PwP). 3
The MDS-UPDRS part III includes motor examinations such as finger tapping, standing balance, and gait. However, despite detailed instructions, the scale's reliability is hindered by inherent subjectivity.4,5 Even experienced experts cannot reliably observe subtle motor nuances. 6 Studies on inter-rater consistency showed varying results, with perfect agreement remaining elusive.7,8 Moreover, specialists have developed pattern recognition methods that exceed existing criteria, underscoring the intricate nature of clinical movement assessment. 9 Similar problems exist for other movement disorders beyond PD. Consequently, there is an urgent need for objective and reliable tools designed specifically for clinical settings.
The use of videos for phenomenology evaluation is common in clinical practice, 10 with the COVID-19 pandemic accelerating telemedicine adoption. Recently, video-based automatic motor assessment has become possible with the development of computer vision (CV) and machine learning (ML) technology. CV performs frame-by-frame analysis of key anatomical points, converting subjective assessments into quantifiable metrics. It offers advantages like non-contact assessment, high sensitivity, and comprehensive data retention. Then, ML models leverage features to reproduce expert scoring patterns. This approach has been applied to assess motor impairments in PwP, including bradykinesia,11–17 gait,18,19 and balance,20,21 showing potential for disease management. However, many studies trained ML models using ratings from a single rater, which can introduce bias and prevent systematic comparisons between human and artificial intelligence (AI) ratings. Furthermore, most models focused on providing simple classifications or ratings, raising concerns about the ‘black-box’ nature of AI. Model interpretation can alleviate these concerns and help uncover potential digital biomarkers. 22 To address rater discrepancies and establish an objective rating system, we developed automatic motor impairment severity estimation models for multiple movement tasks, including bradykinesia, posture, gait, and balance, using multicenter data. A central expert panel of fifteen evaluators independently verified CV-extracted motion features and provided a consensus gold standard for motion assessment. Finally, a systematic evaluation of the models’ performance revealed inter-“rater” agreement and each motion indicator's specific contributions to the final rating (Figure 1).
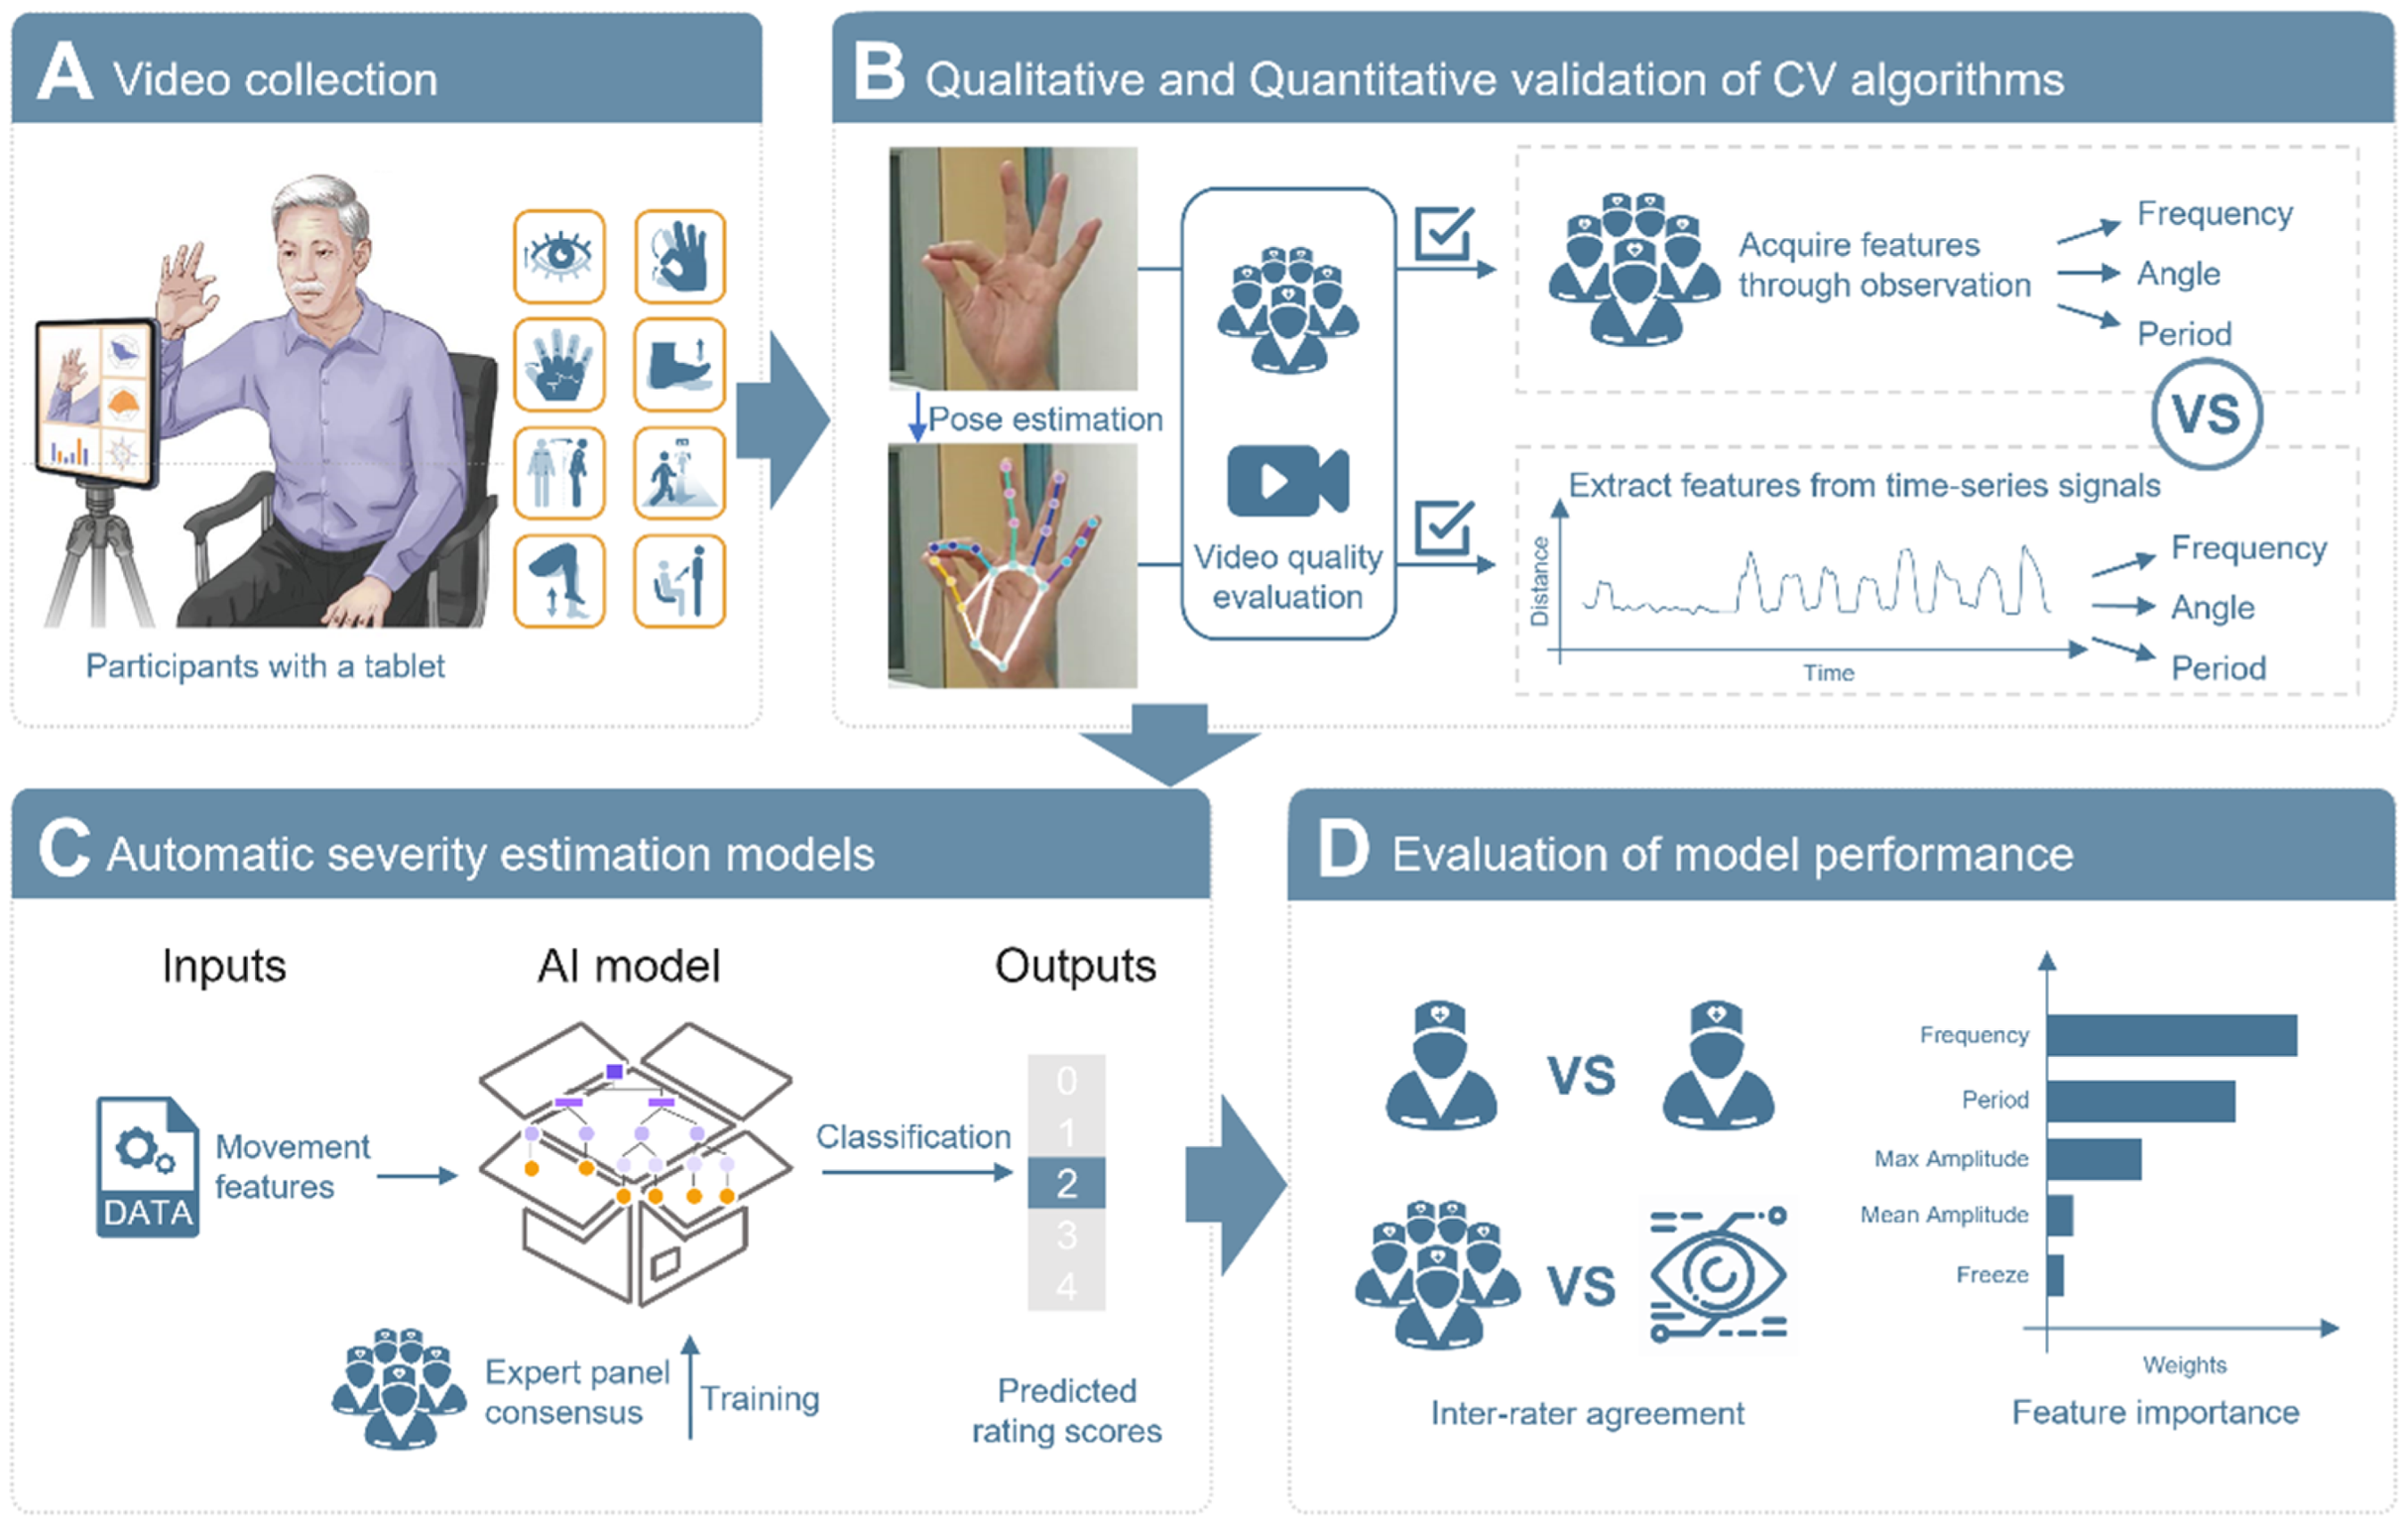
Overview of the computer vision-based clinical movement assessment. (A) Consumer-level mobile devices were used to record videos of motor examinations across multiple centers. Videos of eight movements were collected from each patient. (B) Five randomly selected experts assessed the quality of the raw videos and the key points marked by the software. Both the raters and CV-based software assessed the observable movement variables (MovVars) from the qualified videos. Taking finger tapping as an example, while the software generated a time-series signal for the distance between the thumb and the index finger and quantified the frequency of the movement, raters manually counted the occurrences of the movements by observing the videos. Subsequently, an agreement analysis was conducted on the observable MovVars obtained from both groups. (C) Machine-learning models for automatic severity estimation were trained based on MovVars targeting MDS-UPDRS. (D) The inter-“rater” agreement and easily understandable model explanations were analyzed.
Methods
Participation
A cross-sectional, multicenter, controlled study was conducted. The data were collected at four tertiary hospitals. This study obtained ethical approval from the Ethics Committee of each participating site (for approval number, see Supplemental Methods). Written informed consent was obtained from all participants. Consecutive individuals who met the inclusion criteria were recruited. Confirmed or suspected PwP aged between 40 and 80 years of any sex who required motor examination were included. The exclusion criteria for patients were as follows: (1) had a delirious or unstable mental status; (2) had serious heart, lung, liver, or kidney disease, severe anemia, or other underlying diseases affecting mobility; (3) had unstable vital signs, active infection, or other diseases requiring priority treatment; or (4) were unsuitable for participation as determined by the researchers.
Data collection
Video dataset. Video data were collected from July to November 2022 using consumer-level mobile devices equipped with Movement dysfunction assessment software (MoDAS, NERVTEX Co. Ltd) approved by the National Medical Products Administration of China. The setup included a chair with armrests but no wheels, a tablet on a tripod, and an LED flash in low-light conditions. No specific requirements were applied to the background. Videos were captured at 30 fps with a resolution of 1920 × 1080. During routine clinical visits, physiological measurements were taken to correlate the physical human body with pixels (Supplemental Table 1). Motor examination videos were recorded, focusing on specific MDS-UPDRS part III items: facial expression (item 3.2), bradykinesia (items 3.4–3.5, 3.7–3.8), arising from a chair (item 3.9), gait (item 3.10), and posture (item 3.13). 3 A trained operator supervised the recordings, offering verbal guidance based on software prompts. The distance between the participant and the camera was adjusted to optimize visibility: approximately 0.5–1 meter for facial shots, 1.5 meters for seated upper-body shots, 2 meters for full-body seated shots, and 2.5 meters for full-body standing shots. For repetitive actions, at least twelve repetitions were recorded. Gait assessments involved a 5-meter round-trip walk at a comfortable speed.
Clinical rating scores. Clinicians scored the severity of motor symptoms based on videos according to the UPDRS guidelines. The severity score is an integer ranging from 0 to 4, representing 0 (normal), 1 (slight), 2 (mild), 3 (moderate), and 4 (severe). The most frequently occurring score was taken as the ground truth. Otherwise, the integer closest to their average score was taken.
Safety profile
Adverse events, serious adverse events, and device defects were recorded during the clinical trials (see Supplemental Methods).
Data analysis
Pose estimation and signal processing. Asynchronous online processing was conducted after data was uploaded to the cloud. The deep learning algorithm YOLO-X automatically detected and overlaid key points (Supplemental Figure 1, Supplemental Video). 23 Motor symptom-related time-series signals were constructed by tracking the key point positions on a frame-by-frame basis, and distance-related signals were normalized by body size for cross-subject comparisons (Table 1).
Signals constructed from key points and used for feature extraction for each MDS-UPDRS item.
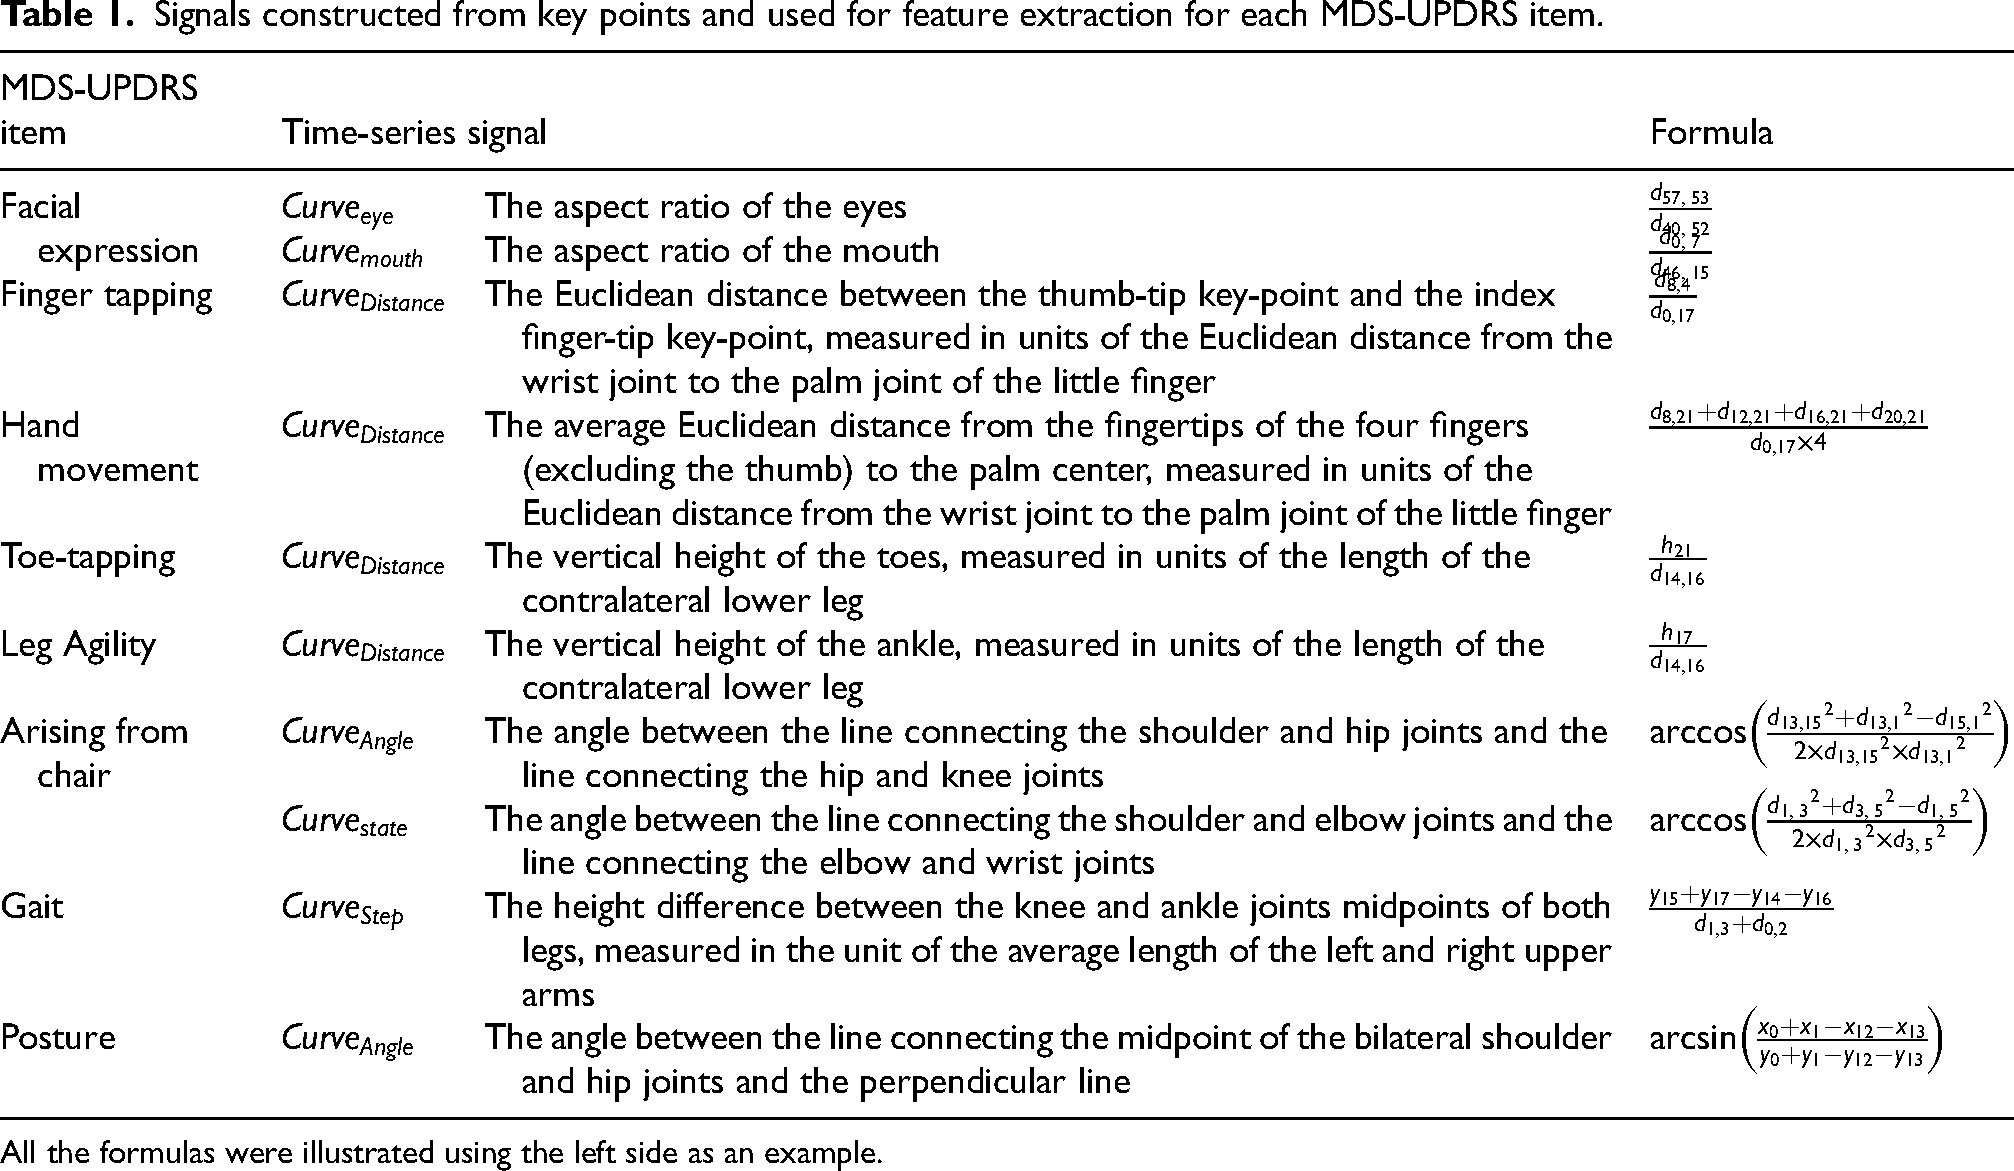
All the formulas were illustrated using the left side as an example.
Quality assessment. We recruited fifteen experts specializing in diagnosing and treating PwP from four centers. These experts included neurologists who held the title of chief physician, technologist-in-charge, or a higher rank, certified physician/technologists who had completed MDS-UPDRS training.
Five raters were randomly assigned to each video, answering two sequential questions (Figure 1B): “ Is the raw video qualified for clinical movement assessment?”, and “Is the CV framework clinically accurate?” A video was approved for further analysis if at least four raters agreed.
Extraction of movement variables
To quantify motor symptoms, the following MovVars were extracted from the time-series signals (see Table 1).
Facial expressions. We identified blinks and mouth openings from the aspect ratio curve of the eyes or mouth,
Repetitive actions related to bradykinesia. The identification of repetitive actions involved detecting peaks and troughs in the corresponding amplitude signals, descriptive statistics (mean, standard deviation, interquartile range (IQR), minimum, maximum, and entropy) of amplitude d, speed, and period frequency of actions the rate of variation of the amplitude the number of freezing rhythm RHY was quantified by computing the entropy of the normalized power density distribution obtained through fast Fourier transformation of the time-series signal. Higher entropy values indicated a more irregular rhythm.
Arising from chair. The following 6 MovVars were defined from the
The time to rise from sitting
Gait. We utilized the directions of the hip joints to determine whether the subject was in the process of walking forward or backward or turning. Five MovVars were obtained, including straight-line duration
Posture. The orientation and duration in a stable posture of the subjects were determined by assessing the direction of the dual hip joints, toes, and heels. Four MovVars were defined, including the average forward bending angle
We considered two types of MovVars. One consists of observable MovVars, which were used to assess the agreement between CV and humans (Figure 1B and 2B). Building upon this, we incorporated more MovVars that were difficult to quantify by the naked eye to develop automatic severity scoring models (Figure 1C).
We reported the details of MovVars in the Supplemental Methods.
Statistical analysis
Agreement analysis of observable MovVars. Five randomly selected clinicians assessed the observable MovVars by observing the raw video. The agreement between the MovVars estimated by the MoDAS and the average values of the raters was assessed against permissible error. The permissible error was calculated based on historical data from 100 retrospectively extracted software-assisted measurements. It was defined as 10% of each parameter's average historical value. The t-statistic was used to determine the absolute upper and lower limits of the 95% confidence intervals for the group differences. If the confidence interval did not exceed the permissible error, there was no significant group difference. Additionally, 2-tailed paired t-tests, Bland‒Altman plots, 24 and Pearson's correlations were used to further quantify the agreement between the raters and the MoDAS. The effect sizes were interpreted as small (r = 0.1 to 0.3), medium (r = 0.3 to 0.5), or large (r = 0.5 to 1.0). 25
Model training, comparison, and explanation. Machine learning models were employed for automatic severity estimation (Figure 1C), and compared using five-fold cross-validation. Performance was measured by absolute accuracy (ACCabs) and acceptable accuracy (ACCacc), with ACCacc reflecting cases where classification deviations from the true score were no more than 1, a common scenario in clinical practice due to inter-rater variability. 26 The random forest (RF) model outperformed the other models on almost all the items (Supplemental Table 2). RF mitigates overfitting by constructing many simple trees and using voting or averaging to enhance model robustness. Sensitivity and specificity were used to evaluate the model's ability to correctly identify true and non-cases at each severity level. The confusion matrix and mean absolute error (MAE) were adopted to evaluate the prediction results from the RF model. As each expert was randomly assigned to evaluate a subset of videos instead of all videos, the calculation of the MAE between experts was the average of the absolute difference for each pair of experts for each video. Statistical significance was determined by 2-tailed paired t tests. The contribution values of each MovVar to the model's performance were ranked by calculating the average or weighted average of impurity reduction across the entire forest.
Results
Multi-site dataset
This study recruited 144 participants from four hospitals, 128 (70 men, 58 women) of whom were successfully enrolled, age 64.9 ± 8.0 years, disease duration 6.2 ± 5.0 years. The Hoehn-Yahr stage classified patients as mild PD, 86 (67.19%), moderate, 38 (29.69%), and severe, 4 (3.13%) (Supplemental Table 3). A total of 1024 videos were collected.
Validation of CV-derived movement assessment
All the raw videos and more than 99% of the CV-enhanced videos gained consistent recognition among the expert panel, except for one eye-blinking video (0.78%) and seven hand movement videos (5.47%) flagged by one clinician (Figure 2A). Therefore, all the videos were approved by more than four of the five clinicians and proceeded to quantification.
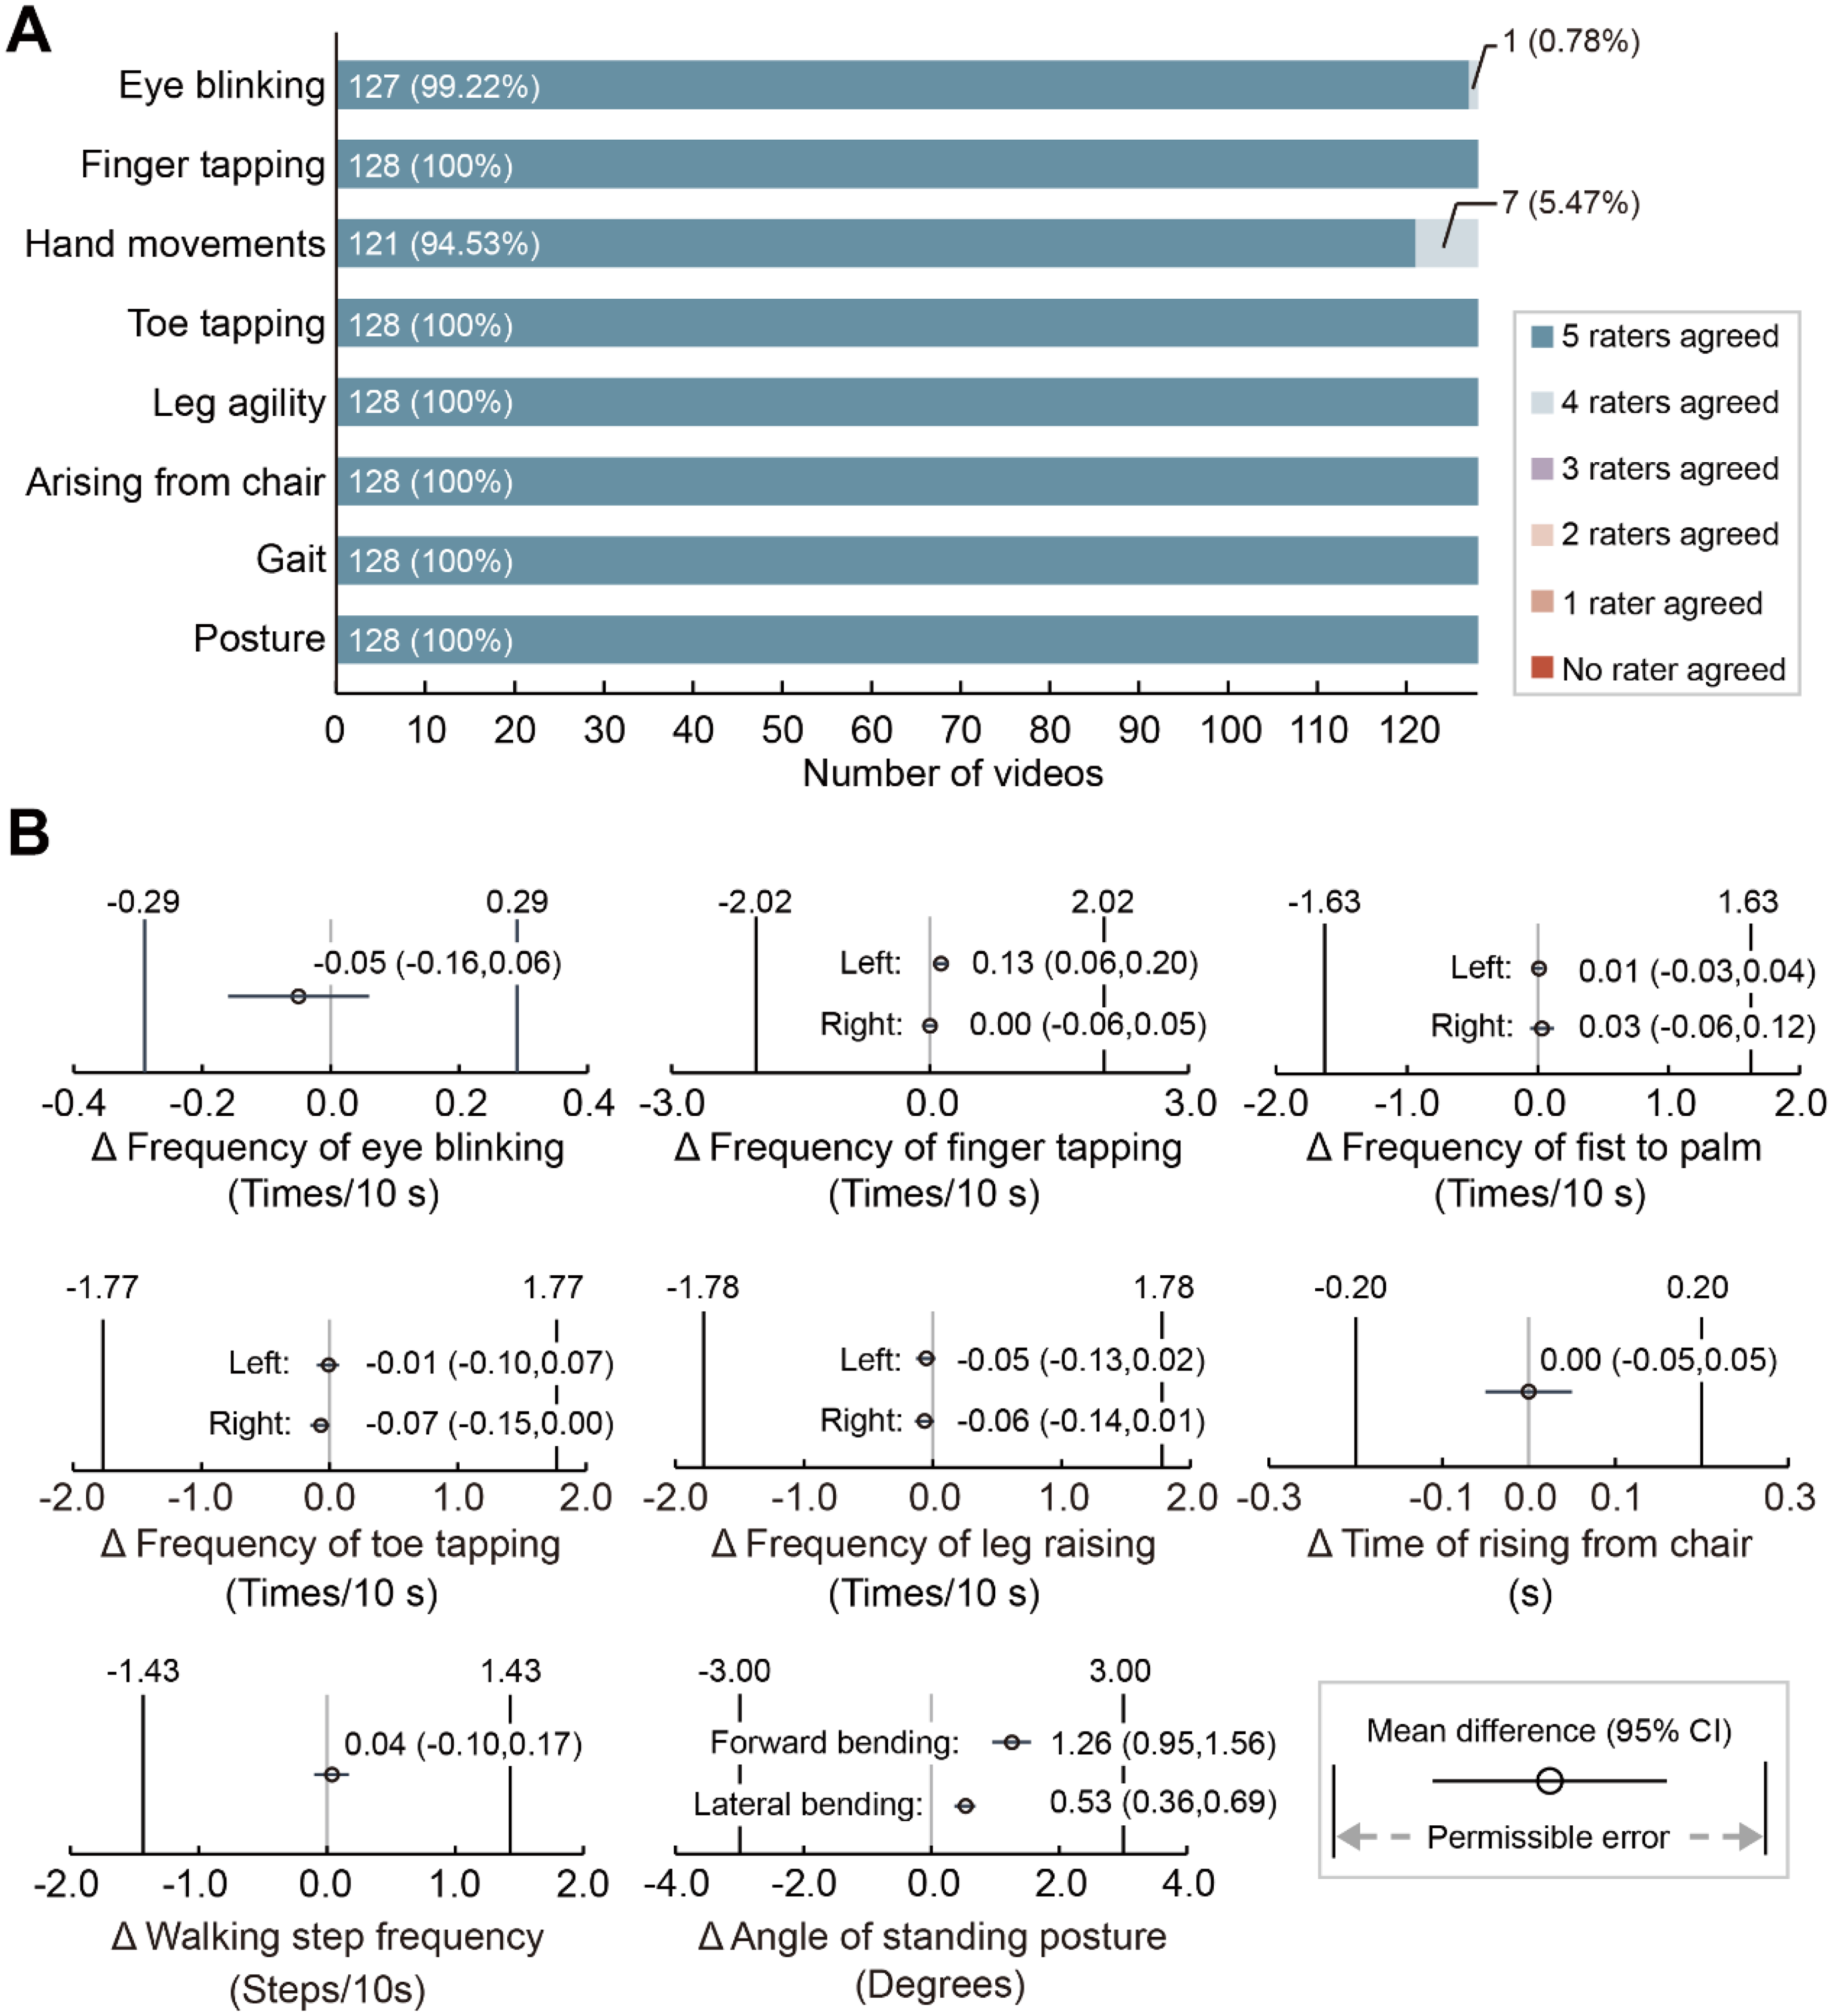
Validation of observable movement variables. (A) Level of agreement on video quality assessment. Shown as the response to the question “Do you agree that the computer vision (CV) framework in this video is clinically accurate?”. The percentages represent the proportion of videos within each category. (B) Difference between professional raters and CV. The forest plot depicts the mean difference and 95% confidence interval between the assessment of movement variables estimated by CV and professional raters. The 95% confidence intervals do not exceed the range of permissible error indicating that the movement variables assessed by CV are comparable with those assessed by professional raters.
Agreement between clinicians and CV was substantial in assessing observable MovVars when the 95% CI of the difference's bounds fell within the permissible error range (see Methods). The results demonstrated agreement for all the observable MovVars related to facial expression, bradykinesia, postural stability, gait, and posture (Figure 2B, Supplemental Table 4). Paired t tests revealed significant group differences in the frequency of left-handed finger tapping (t = 3.60, p = 0.0005), maximum forward bending angles (t = 8.18, p < 0.0001), and maximum lateral bending angles (t = 6.27, p < 0.0001; Supplemental Table 4).
Bland‒Altman plots showed no proportional errors in any MovVars; however, the line of equality was not within the 95% confidence interval of bias for the frequency of left-hand finger tapping and angles of standing posture, indicating an overestimation by CV (Supplemental Figure 2, Supplemental Table 5). Out of 128 measures, up to 6 were identified as outliers (Supplemental Figure 2B). Strong correlations with large effect sizes were observed between the CV and rater estimates across all MovVars (Supplemental Figure 2, Supplemental Table 5).
AI-human agreement in symptom severity estimation
Following the validation of the observable MovVars and time-series data, additional sophisticated MovVars were extracted for automatic symptom severity estimation.
The confusion matrix showed high agreement between the AI predictions and the consensus scores from the expert panel (Figure 3A-H). The overall ACCabs were 69.63 ± 5.51%, and the ACCacc were 98.78 ± 1.81% (Supplemental Table 2). The item with the highest ACCabs was gait (78.13%), while the item with the lowest ACCabs was facial expression (60.94%). Sensitivity and specificity were 65.48% ± 12.77% and 72.18% ± 10.35%, respectively.
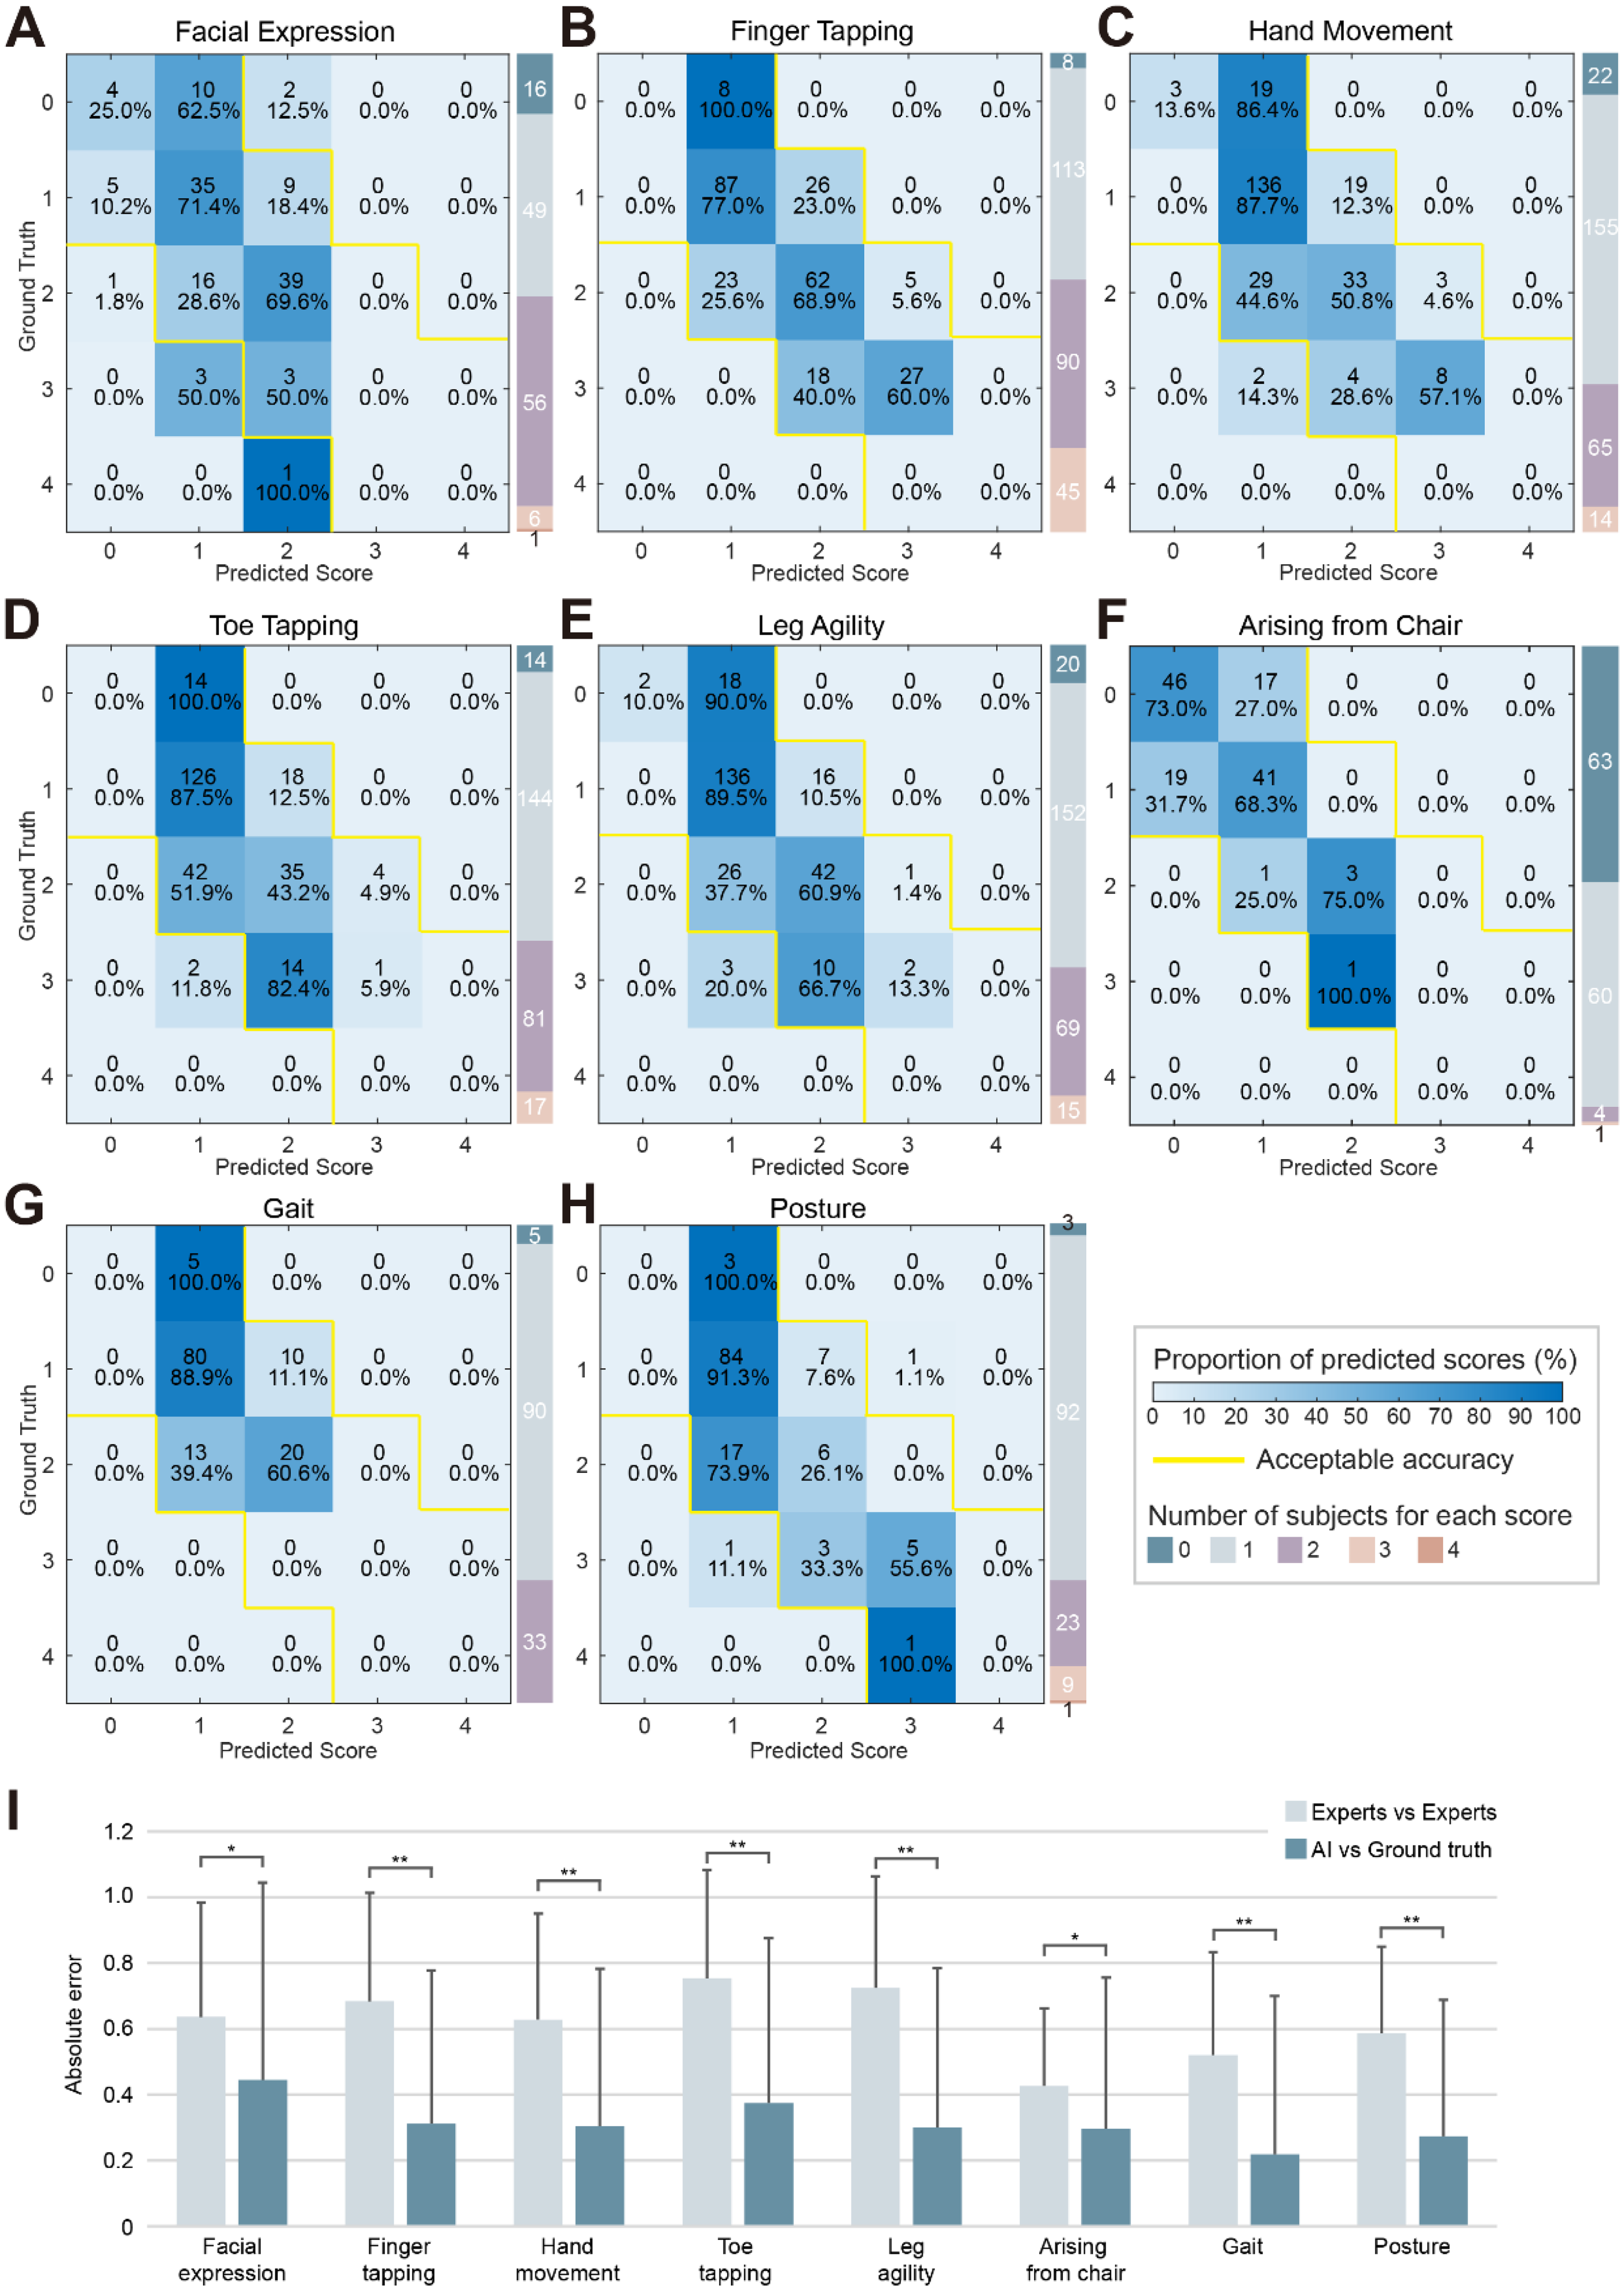
Performance of automatic severity estimation model. (A-H) Confusion matrix from five-fold cross-validation for each item, with absolute correct predictions shown on the diagonal and acceptable predictions (+1 or −1) shown within the yellow boundaries. (I) The mean absolute error (MAE) measured the difference between any two ratings. The MAE between the AI model and ground truth was significantly lower than the MAE between experts for all items.
The models demonstrated enhanced performance for scores with a broader distribution of participants (1, n = 855, ACCabs = 84.80%, 2, n = 421, ACCabs = 57.01%, Supplemental Table 6) compared to scores with fewer participants (0, n = 151, ACCabs = 36.42%, 3, n = 107, ACCabs = 40.19%, 4, n = 2, ACCabs = 0%, Supplemental Table 6). The model predictions were found to be comparable in the ON (n = 97) and OFF (n = 16) subgroups (ON, ACCabs = 69.52% ± 4.69%, ACCacc = 98.58% ± 1.94%, Sensitivity = 65.48% ± 12.77%, Specificity = 72.18% ± 10.35%. OFF, ACCabs = 67.58% ± 8.41%, ACCacc = 98.44% ± 2.21%, Sensitivity = 63.22% ± 22.63%, Specificity = 63.13% ± 19.46%. Supplemental Figure 3). The AI-generated scores demonstrated a mean absolute error (MAE) of 0.32 ± 0.49 against the expert consensus, significantly outperforming the inter-expert variability (MAE = 0.65 ± 0.33, Figure 3I, Supplemental Table 7).
Explanation of model performance
Feature importance analysis provides intuitive insight into AI model functioning, enabling the fusion of AI with clinical expertise. Specifically, in the facial expression rating, the relatively important MovVars were eye-blinking frequency, average blink interval, average minimum aspect ratio of eyes, maximum aspect ratio of eyes, and maximum aspect ratio of mouth. For the severity of bradykinesia, apart from speed variability, which ranked first in the finger-tapping task, the top-ranking MovVars in other items was average speed. Moreover, multiple MovVars related to speed, period, amplitude, and rhythm contribute similarly, requiring the retention of 18–20 MovVars for a cumulative contribution value of 90%. The relatively important MovVars for standing balance were the time to rise from sitting, the minimum angle during the bending phase, and the maximum angle during the upright extension phase. In predicting gait impairment, the importance ranking was average step length, straight-line walking duration, turning duration, step frequency, and average speed. The average forward bending angle, average lateral bending angle, maximum forward bending angle, and maximum lateral bending angle were crucial for posture assessment (Table 2).
Movement variable importance of random forest model.
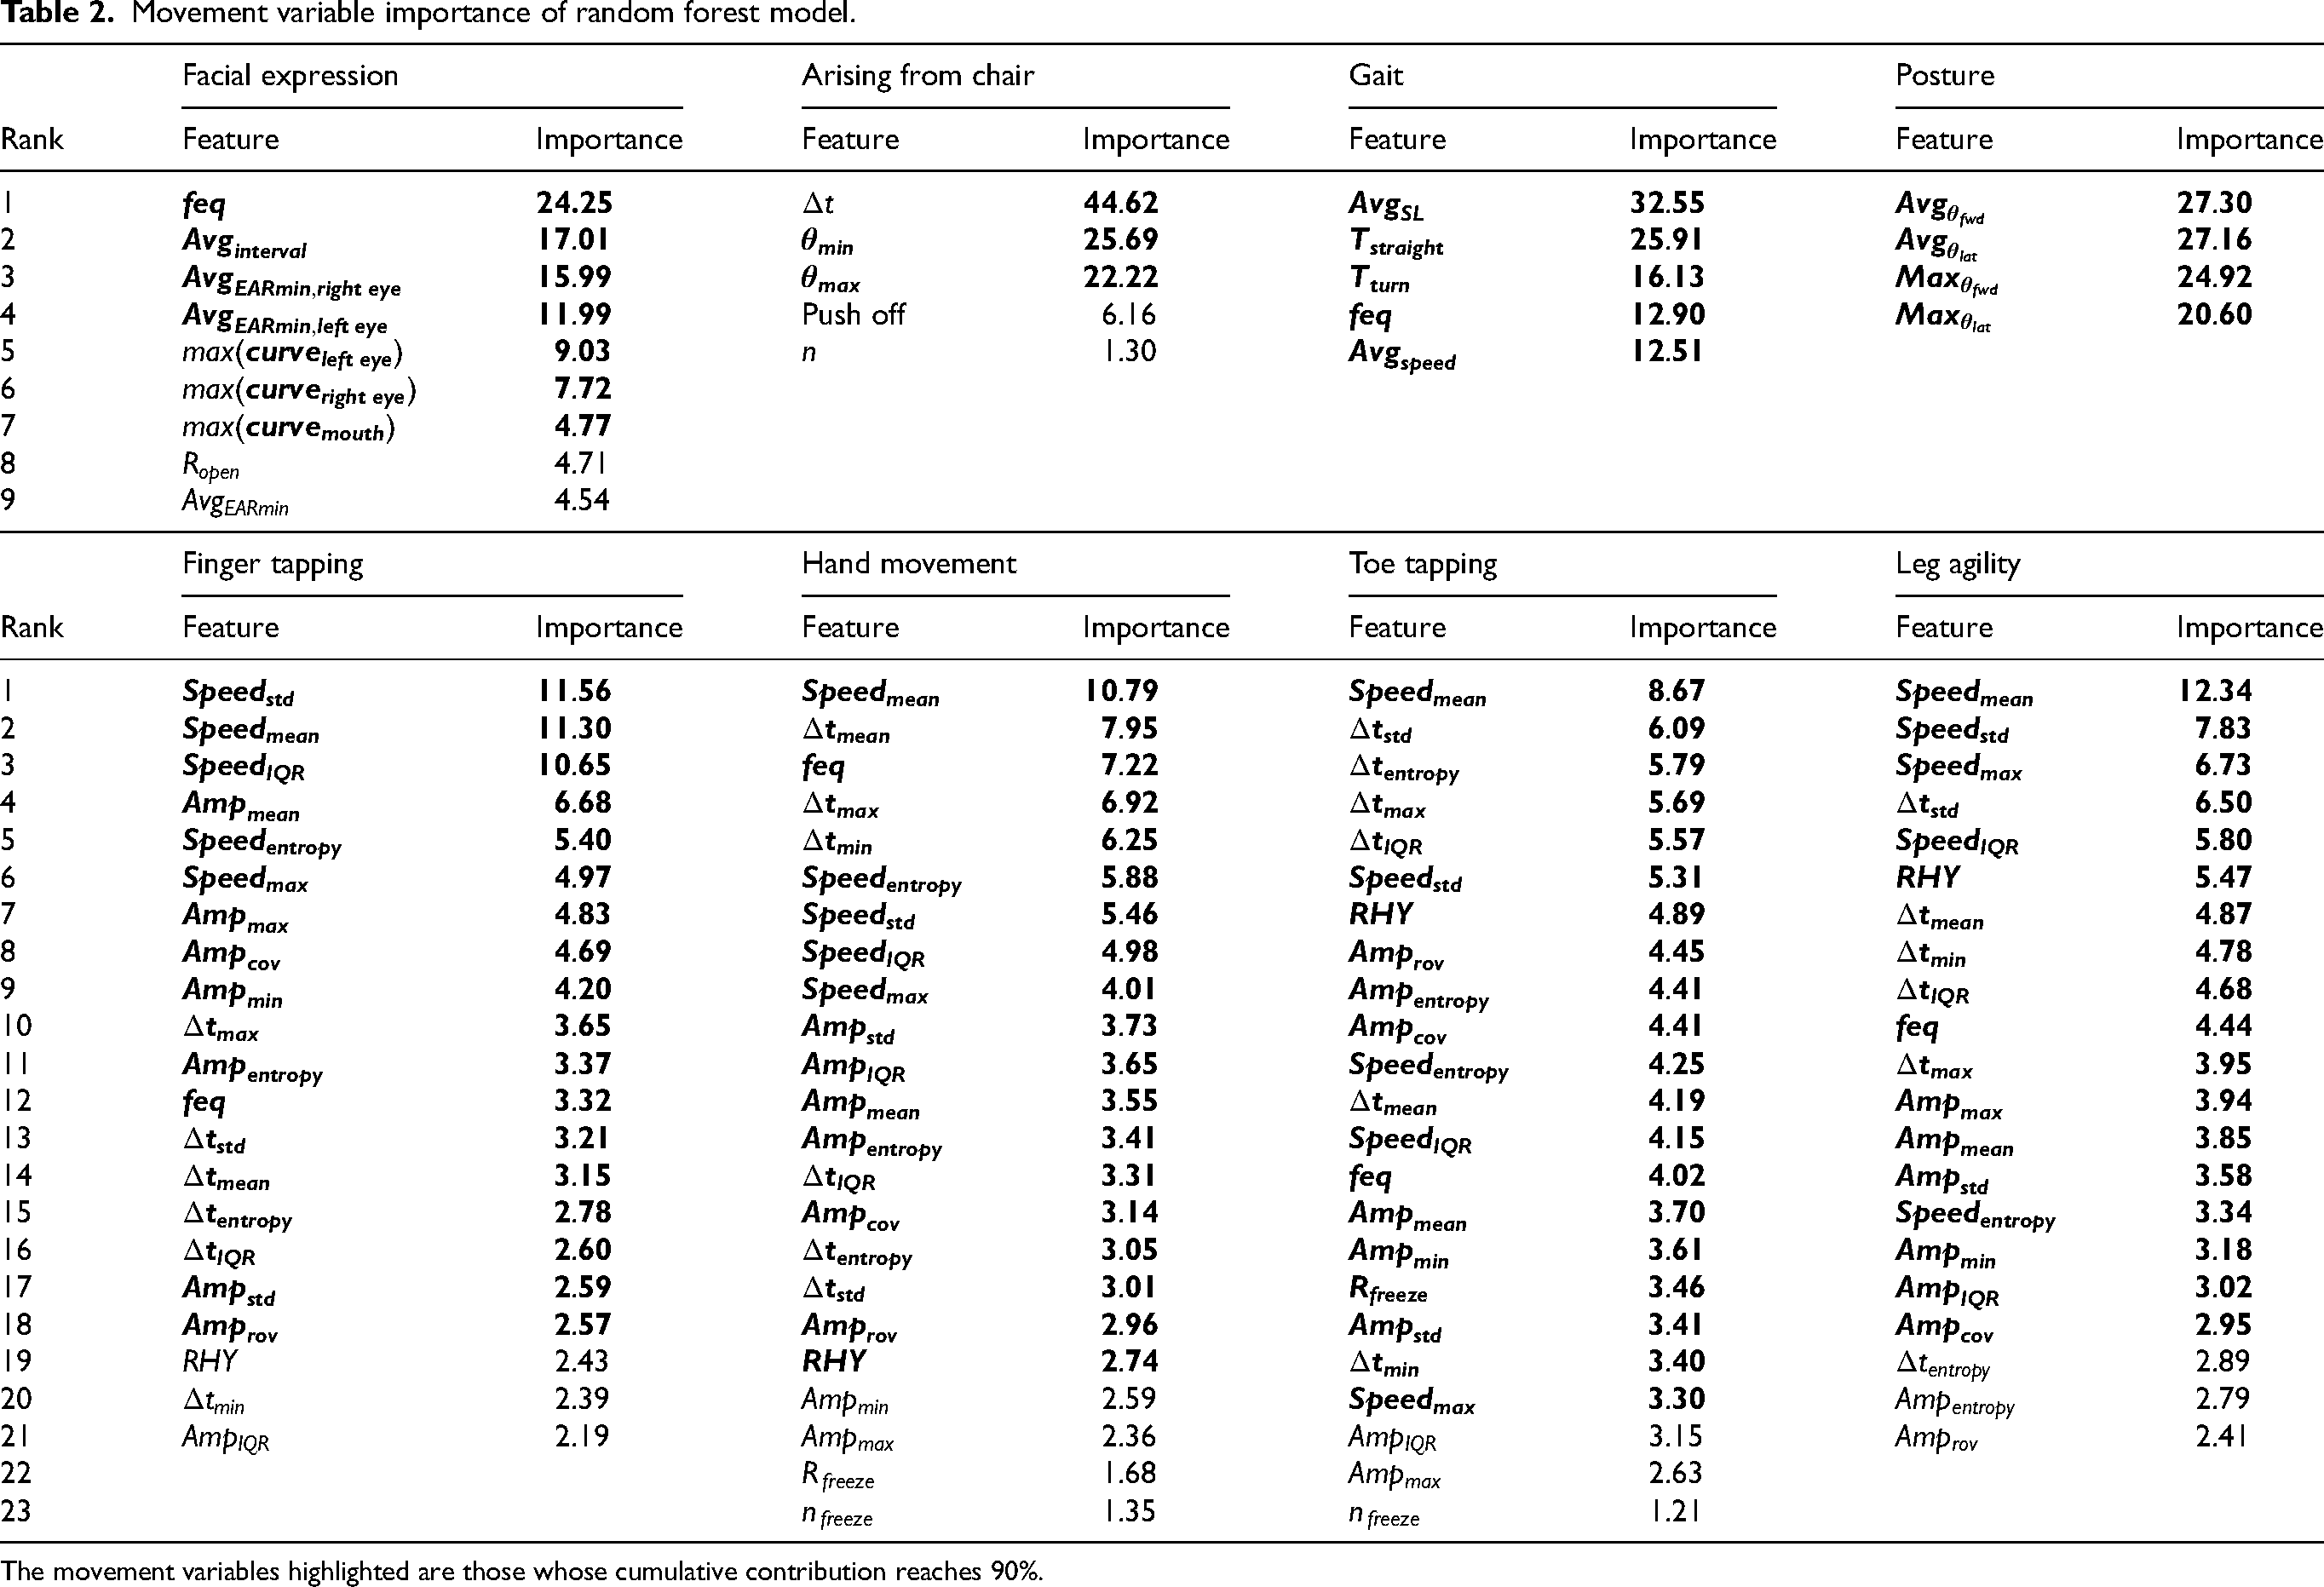
The movement variables highlighted are those whose cumulative contribution reaches 90%.
Safety assessments
No adverse events or serious adverse events occurred (Supplemental Table 8). Two instances of software malfunction, specifically crashes, occurred without causing any image capture failures or disruptions (Supplemental Table 9).
Discussion
This study demonstrated the feasibility and reliability of video-based automatic motor symptom severity estimation. By validating CV-extracted MovVars and refining them into ML models, we achieved high concordance with clinicians, outperforming inter-expert consistency across diverse motor examinations, highlighting the system's clinical utility. Future raters can use it to calibrate their ratings. Moreover, our analysis of model performance provides insights into key features driving accurate severity estimation, enhancing our understanding of motor dysfunction. Collectively, our results emphasize the potential of AI to enhance objective, reliable clinical movement assessments, inform clinical interventions and improve patient care.
Accurate feature extraction is essential for effective predictive scoring. Recognizing the deficiencies in CV key-point annotations reported in previous studies, 14 we began with a validation procedure. A qualitative evaluation endorsed all CV-labeled videos, highlighting the practicality of using mobile device-captured videos, especially in space-constrained clinical environments. 27 While the flagged unqualified videos showed no significant issues, potential bias from inconsistent quality assessment criteria was noted. Previous studies relying on single-rater evaluations as a reference may have encountered similar single-rater bias, 17 where limited rating consistency among raters and varied criteria significantly influenced disease label classification. 28 Our quantitative evaluation found that CV-assessed MovVars closely matched clinician evaluations. Unlike previous studies of automatic ratings that merely reported the predicted scores or classifier performance,11,13–15,18,20,29 we emphasized the effectiveness of observable MovVars. In addition, our software allowed for frame-by-frame validation alongside the AI-generated time-series signals. Marginally significant differences in finger-tapping evaluations likely stem from the difficulty in tracking fast, small movements visually, where software may outperform human assessments. Additionally, the CV may make recognition and tracking errors when the movement trajectories of fingers are obstructed, underscoring the need for standardized instructions and real-time quality control during recording. For posture angle assessments, the disparities between the AI and clinicians (forward bending angles, 1.26 ± 1.74°, lateral bending angles, 0.53 ± 0.95°) were comparable to those between clinicians (1.7 to 10.1°, satisfactory to excellent consistency). 30 Thus, we considered the group differences to be clinically insignificant.
After validation, we extracted more precise MovVars to train automatic severity estimation models, specifically quantifying atypical movement patterns in PwP. The overall ACCabs of the AI models was 69.21%. 29.75% of predictions deviated by 1 point, primarily due to limited sample sizes. Larger deviations were rare (16 out of 1536 instances, 1.04%). Remarkably, identical ratings between any pair of clinicians occurred 45.22% of the time, with deviations of two points or more in 9.36%. Our findings suggested high agreement between AI-driven ratings and expert consensus, especially in patients with mild symptoms. Similar results in finger-tapping tasks have been observed in a recent study. 22 Task-specific accuracy differences likely stem from two factors: First, facial expression assessments involve complex and subtle movements that are difficult to quantify consistently, leading to higher variability and reduced accuracy. Implementing more refined methods, such as Action Units to analyze facial muscle activity, could enhance precision. Second, gait assessments achieved higher accuracy because the severity scores were more concentrated and had lower variability (standard deviation = 0.5), which provided more consistent data for the model. In China, experienced clinicians, predominantly employed in tertiary hospitals, face heavy workloads, 31 limiting the time available for assessments and leaving many patients without adequate evaluations. Additionally, ratings from clinicians may be biased by subjective impressions of the patient's overall state. Integrating AI as a second reader in real-world practice could enhance efficiency and reliability across various healthcare settings, thereby benefiting a broader patient population.
The model explanations revealed that its predictions were derived from integrating multiple dimensions of motor function. Certain MovVars, such as the IQR of repetitive movement speed, are challenging to quantify for clinicians but may serve as potential digital biomarkers. Experienced specialists with higher diagnostic accuracy “may be using a method of pattern recognition for diagnosis that goes beyond any formal set of diagnostic criteria”. 9 Our findings supported this process, aiding novice clinicians by translating impressions into understandable models. Clinical trials utilizing the MDS-UPDRS as a primary outcome often struggle with limited sensitivity in tracking disease progression, 32 necessitating large patient cohorts to ensure statistical power.33,34 In contrast, digital biomarkers enhance accuracy and sensitivity, potentially reducing the required sample size.35,36 Furthermore, it is crucial to acknowledge the heterogeneity in movement dysfunction among PwP. Previous research has highlighted that different MovVars exhibit diverse associations with functional impairments and responses to treatment.37,38 However, patients with various symptoms often receive the same rating score. Testing treatment response in subgroups with a similar pattern of quantified MovVars may increase the effectiveness of treatment.
The contactless nature of CV ensured excellent safety. Only two software crashes occurred during the initial data collection phase due to insufficient memory. Our multi-center validation supported its potential for widespread adoption. The care provided by neurologists to PwP improved clinical outcomes and survival rates. 39 Remote programming following deep brain stimulation surgery has also shown benefits for patients. 40 However, limited access to professionals remains a challenge. CV-based software addresses this gap by eliminating the need for disinfection or complex calibration, streamlining data collection in both clinical and home environments. In addition, this technique is applicable beyond PD, such as for evaluating upper-limb function in stroke rehabilitation or facial nerve function.41,42
This study has several limitations that warrant future refinement. The single-camera configuration met motor assessment criteria here but potentially led to data loss along the third dimension. Depth-sensing technologies such as Kinect can facilitate three-dimensional data acquisition for movement assessment but have constrained accuracy and capture capacity.29,43 Future advancements are expected to enhance motion-related information with multi-camera markerless systems. 44 Second, pronounced tremors can disrupt CV assessments of MovVars, particularly in tasks such as finger tapping, leading to peak detection inaccuracies and necessitating further algorithmic refinement. Third, there was an imbalanced severity class distribution, with most subjects scoring 1 (55.66%) or 2 (27.41%), while other classes were underrepresented (0, 9.83%, 3, 6.97%, 4, 0.13%). This underrepresentation limited the model's ability to learn and generalize from these less frequent but clinically critical scenarios. The model may exhibit diminished sensitivity in identifying severe motor symptoms. Besides, certain MovVars that showed high variability in severe cases may be underweighted by the model, impacting its overall reliability. Moreover, exploring the scalability of our model will be essential. Evaluating the model's scalability across diverse populations and settings is essential to enhance its generalizability and ensure accurate motor symptom assessment across the full spectrum of PD severity.
In summary, our video-based AI system achieved accurate and reliable motor symptom severity assessments, enhancing consistency in clinical evaluations and aiding in identifying potential digital biomarkers. Future work will focus on amassing extensive datasets to refine digital outcomes and establish standardized diagnosis and treatment approaches for movement disorders.
Supplemental Material
Supplemental Material
sj-docx-1-pkn-10.1177_1877718X241312605 - Supplemental material for Improving reliability of movement assessment in Parkinson's disease using computer vision-based automated severity estimation
Supplemental material, sj-docx-1-pkn-10.1177_1877718X241312605 for Improving reliability of movement assessment in Parkinson's disease using computer vision-based automated severity estimation by Jinyu Xu, Xin Xu, Xudong Guo, Zezhi Li, Boya Dong, Chen Qi, Chunhui Yang, Dong Zhou, Jiali Wang, Lu Song, Ping He, Shanshan Kong, Shuchang Zheng, Sichao Fu, Wei Xie, Xuan Liu, Ya Cao, Yilin Liu, Yiqing Qiu, Zhiyuan Zheng, Fei Yang, Jing Gan and Xi Wu in Journal of Parkinson's Disease
Footnotes
Acknowledgments
This study was funded by the National Key Research and Development Program of China (No. 2022YFC2405105) and Climax Project of Changhai Hospital (No. 2019YXK049). The funder played no role in the study design, data collection, analysis, and interpretation of data, or the writing of this manuscript.
We extend our gratitude to all participants and institutions involved in this study. Researchers interested in exploring MoDAS can apply for a trial account via email at inquiry@neutonhealth.com.
Funding
The authors received no financial support for the research, authorship, and/or publication of this article.
Declaration of conflicting interests
The authors declared no potential conflicts of interest with respect to the research, authorship, and/or publication of this article.
Data availability
The data supporting the findings of this study are available on request from the corresponding author. The data are not publicly available due to privacy or ethical restrictions.
Supplemental material
Supplemental material for this article is available online.
References
Supplementary Material
Please find the following supplemental material available below.
For Open Access articles published under a Creative Commons License, all supplemental material carries the same license as the article it is associated with.
For non-Open Access articles published, all supplemental material carries a non-exclusive license, and permission requests for re-use of supplemental material or any part of supplemental material shall be sent directly to the copyright owner as specified in the copyright notice associated with the article.