
Abstract
Background
Breast cancer, the leading cause of cancer deaths among women, exhibits high heterogeneity, affecting prognosis. Understanding this heterogeneity and developing prognostic models are crucial for accurate identification of high-risk patients.
Methods
Accessing breast cancer gene expression and clinical data from public datasets, we identified differential expression genes in tumor vs. non-tumor tissues using TCGA data. Key DEGs were then selected using LASSO and Cox regression, and a prognostic risk model (BRCA-DEGs-LASSO-Cox) was constructed. Survival analysis estimated model predictability, identifying high-risk patients. Correlation between risk score and signaling pathways, immune status, and drug sensitivity was analyzed. Molecular mechanisms underlying high-risk patients were discussed.
Results
Our analysis identified 1217 downregulated and 689 upregulated DEGs in breast cancer tumor tissues. A BRCA-DEGs-LASSO-Cox model was constructed using four key DEGs, stratifying patients into high/low-risk groups. High-risk patients had worse OS across cohorts and were associated with androgen, estrogen, and PI3 K signaling pathway dysregulation. They also exhibited immune status dysregulation and drug sensitivity disturbances. Molecular mechanism analysis indicated abnormal regulation of cell cycle, mitosis, and immune-related signals in high-risk patients, explaining their poorer prognosis.
Conclusions
BRCA-DEGs-LASSO-Cox model effectively identifies high-risk breast cancer patients, revealing key signaling pathways, immune status, drug sensitivity, and molecular mechanisms.
Introduction
Breast cancer is the leading cause of cancer-related morbidity, disability, and mortality worldwide. 1 In 2020, there were 2.3 million new cases of breast cancer, with lung cancer being the most commonly diagnosed cancer worldwide. An increasing burden of breast cancer has been reported worldwide. 2 In China, the prevention and control of breast cancer are also not optimistic. An analysis by the National Cancer Center showed that the morbidity of breast cancer in China increased to 17.11% (117,174 deaths) in 2020.3,4 Recently, the treatment of breast cancer, including surgery, chemotherapy, endocrine therapy, radiotherapy, and targeted therapy based on trastuzumab, has made a spurt of progress and a great improvement in patient prognosis. However, many high-risk breast cancer patients still have poor prognosis. 5
Tumor heterogeneity is the leading cause of poor prognosis in patients with breast cancer. Aberrant proliferation and differentiation processes give rise to changes in gene expression and epigenetic modification status in breast cancer, which results in tumor heterogeneity in breast cancer. 6 First, tumor heterogeneity is mainly observed in heterogeneous gene expression profiles across tumor cells. 7 Second, differences in signaling pathway activation are important components of tumor heterogeneity.8,9 These pathways include human epidermal growth factor receptor 2 (HER2), Wnt/β-catenin, PI3 K/AKT/mTOR, Notch, hypoxia, NF-κB, p53, and TNF-α, which are involved in the malignancy of breast cancer. 8 Finally, the heterogeneity of the tumor immune microenvironment, which is composed of complex cell types such as tumor, matrix, and immune cells, also impedes patient prognosis and therapeutic potency. 10 Therefore, the heterogeneity of breast cancer poses impediments to the identification of high-risk breast cancer patients and successful clinical precision therapy.
Tumor heterogeneity leads to complexity in breast cancer prognosis. Therefore, a single-factor prognosis analysis could not fulfill the real situation of patients. In recent years, machine learning algorithms and the explosive growth of biopharmaceutical big data have accelerated advances in tumor biology, including prognosis prediction, therapeutic schedule optimization, and drug target exploration. Risk assessment models constructed with machine learning combine different types of features in a nonlinear manner using autonomous learning, which can overcome the limitations of single factors and the heterogeneity of breast cancer. 11
Many accurate prognosis prediction models for breast cancer have been established, which mainly focus on ferroptosis, cuproptosis, Epithelial-Mesenchymal Transition (EMT), m6A-immune, pyroptosis, and hypoxia-related signatures.12–17 For example, a hypoxia-related gene model was structured in kidney renal clear cell carcinoma to predict patient prognosis. 18 Similarly, an immune cell infiltration-based model that predicts prognosis and chemotherapy effects in breast cancer was also developed by Sui et al.. 19 These prognostic systems not only improve the prognosis prediction accuracy of different cancer types but also provide directions for drug development.20,21 However, these models mainly focus on the statistical analysis of public databases. Clinical practice and experimental verification were missing. Simultaneously, limitations inherent to gene sets may compromise their universal applicability. This constraint confines model utility to tumor patients exhibiting specific signaling pathway aberrations, thereby restricting its generalizability across diverse clinical populations.
LASSO (Least Absolute Shrinkage and Selection Operator) is a regression analysis method that achieves feature selection through L1 regularization. It automatically shrinks the coefficients of unimportant features to zero, thereby simplifying the model. 22 Cox regression is a commonly used method in survival analysis for evaluating the impact of multiple factors on survival time. 23 LASSO-Cox regression combines the feature selection capability of LASSO with the survival analysis functionality of Cox regression, making it suitable for feature selection in high-dimensional data, such as gene expression data.
In this study, we successfully constructed a prognostic model for breast cancer based on differential expression genes (DEGs) using LASSO (BRCA-DEGs-LASSO-Cox model). First, this model had a better performance in prognosis prediction and identification of high-risk patients. Second, the BRCA-DEGs-LASSO-Cox model could also predict high-risk patient-related signaling pathways. Immune state prediction analysis of patients with different risk scores was also assessed using the BRCA-DEGs-LASSO-Cox model. Furthermore, we also detected the drug sensitivity to predict the potentiality of this model. Finally, we also explored its potential molecular mechanism in the identification of high-risk patients, which may provide new targets for precise treatment of breast cancer.
Materials and methods
Breast cancer clinical and expression data collection and differentially expressed genes analysis
The expression and clinical data of breast cancer (BRCA) from The Cancer Genome Atlas (TCGA) were downloaded using the R/Bioconductor packages TCGAbiolinks, SummarizedExperiment, and stringr.24–26 The expression dataset ID for breast cancer was TCGA-BRCA. htseq_counts.tsv. The survival dataset ID used was TCGA-BRCA. survival.tsv. Gene Expression Omnibus (GEO, GSE42568, https://www.ncbi.nlm.nih.gov/geo/) was also downloaded to assess the expression and clinical data of breast cancer (BRCA). 27 Differentially expressed gene (DEGs) analysis between normal and tumor samples from TCGA breast cancer (BRCA) was performed using the R/Bioconductor package limma. 28 DEGs were displayed with a heatmap and volcano plot using R/Bioconductor packages ggplot2 and tinyarray.29,30 The criteria for DEGs were |log2FC| > 1 and false discovery rate (FDR) < 0.05.
Patient inclusion/ exclusion criteria
Patients were included if they had complete survival data, defined as clear documentation of survival time (e.g., Overall Survival [OS] or Progression-Free Survival [PFS]) and outcome events (e.g., death, recurrence), along with fully recorded key clinical parameters such as age, sex, TNM stage, tumor grade, and treatment regimen. Cases were excluded if survival time was ambiguously labeled (e.g., marked as “censored” without follow-up duration) or if critical clinical variables (e.g., tumor stage, treatment type) exhibited a missing rate exceeding 20%.
LASSO regression cox analysis and gene risk model establishment
A total of 1052 TCGA BRCA-expressing and clinical samples, named the total TCGA cohort, were incorporated in our Cox analysis and risk model establishment. The discovery and validation TCGA cohorts (526 samples each) were randomly divided from the total TCGA cohort by a ratio of 1 to 1 randomly the R/Bioconductor package caret. 31 The BRCA-DEGs-LASSO-Cox model was established using TCGA cohort. First, univariate Cox regression was performed to estimate the prognostic role of BRCA-DEGs, and prognosis-related BRCA-DEGs were identified. 32 Then, further BRCA-DEGs extraction was performed with LASSO regression, and a precise risk model was constructed, which was accessed with R/Bioconductor packages glmnet, My.stepwise, survival, and survminer. Finally, the risk score of all samples was calculated using the coefficient and expression values of each BRCA-DEG.13,33–35
BRCA-DEGs-LASSO-Cox model validation
First, overall survival (OS) and log-rank test analysis, performed with R/Bioconductor packages ggplot2 and survival, were used to estimate the suitability of the BRCA-DEGs-LASSO-Cox model in the discovery, validation TCGA, and GEO cohorts. Risk score groups were divided into high and low groups depending on whether they were above the median value of the risk score.
To clarify whether the risk score was an independent factor for the prognosis of BRCA, multivariate Cox regression was performed and displayed with forest plots with the ggforest function from the R/Bioconductor package survminer. 36 Clinical stage, age, and risk group were involved in this Cox regression analysis across the discovery TCGA cohort, validation TCGA cohort, total TCGA cohort, and GEO cohort.
Next, the prognostic value of the BRCA-DEGs-LASSO-Cox model was estimated using receiver operating characteristic curve (ROC) analysis and Area Under the Curve (AUC) values at 1, 3, and 5 years across these four cohorts with R/Bioconductor packages pROC and ggplot2. 37 The correlation between the Cox model risk score and the outcome of breast cancer patients is displayed by a boxplot with R/Bioconductor packages ggplot2.
Finally, the nomogram BRCA-DEGs-LASSO-Cox model was plotted for its clinical application with the R/Bioconductor package survival and rms.38,39
Evaluation of BRCA-DEGs-LASSO-Cox model with tumor immune dysfunction and exclusion (TIDE) score and microsatellite instability (MSI)
The TIDE score of TCGA patients was calculated online (http://tide.dfci.harvard.edu/). 40 The effect of risk score on TIDE score and MSI was displayed by violin plots with the R/Bioconductor package ggplot. The Student's t test was used to compare significant differences (****p < 0. 0001).
Effect of BRCA-DEGs-LASSO-Cox model and key DEGs on immune score and canonical cell signals score
Immune scores of TCGA-BRCA samples were obtained using R/Bioconductor package utils and estimate, which could calculate tumor purity and immune score based on its gene expression profile. 41 The differences in immune scores between high- and low-risk scores are displayed by boxplots with the R/Bioconductor packages ggpubr and reshape2.42,43 The canonical cell signal score for each TCGA BRCA sample was estimated using Pathway RespOnsive GENes for activity inference (PROGENy) depending on the R/Bioconductor package progeny. 44 The comparison of different canonical cell signal scores between high- and low-risk scores was shown with violin plots, which were generated with the R/Bioconductor packages ggplot2. Student's t test was performed to compare significant differences between the high- and low-risk groups (*p < 0. 05, **p < 0. 01, ***p < 0. 001).
Correlation between BRCA-DEGs-LASSO-Cox model and drug sensitivity
The R/Bioconductor package oncoPredict was used to predict the drug sensitivity of each TCGA BRCA samples. 45 The effect of risk score and key DEGs on different drug sensitivity scores is displayed in box plots using the R/Bioconductor package ggplot2. The correlation was estimated using Student's t test (*p < 0. 05, **p < 0. 01, ***p < 0. 001).
DEGs filtering function enrichment of BRCA-DEGs-LASSO-Cox model
DEGs filtering with the BRCA-DEGs-LASSO-Cox model was performed using the R/Bioconductor limma package. The screening threshold for DEGs was |log2FC| greater than 0.58 and p < 0.05. Gene Ontology (GO) function enrichment of these DEGs was accessed with R/Bioconductor packages clusterProfiler, org.Hs.eg.db, and ggplot2.46–48 Gene set enrichment analysis (GSEA) was used to estimate function enrichment of these DEGs with cowplot, enrichplot, ggplot2, and clusterProfiler.48–50
Results
Differentially expressed genes (DEGs) analysis and BRCA-DEGs-LASSO-Cox prognosis model establishment and validation were performed in TCGA breast cancer dataset
To construct a precise prediction model based on DEGs, 1052 breast cancer patients in the TCGA data repository were included in our analysis to screen the DEGs between tumor and non-tumor samples (Figure S1A). As shown in the volcano plot (Figure S1B) illustrated, 1217 genes were downregulated, whereas 689 genes were upregulated.
Subsequently, LASSO regression with ten-fold cross validation was employed to further screen DEGs that were significantly correlated with the prognosis of BRCA patients. During the specific implementation of LASSO regression, we used ten-fold cross-validation to determine the optimal penalty parameter λ. By continuously adjusting the λ value, we observed the model's predictive performance and selected the λ value that minimized the cross-validation error as the optimal one. After determining the optimal λ value, we used the LASSO regression model to screen the BRCA-DEGs, retaining only those genes with non-zero coefficients (Figure 1A, B). Four key DEGs were identified in the BRCA-DEGs-LASSO-Cox prognosis model. These key DEGs included WT1 (WT1 transcription factor), SHCBP1 (SHC binding and spindle associated 1), TNFRSF18 (TNF receptor superfamily member 18), and FOXJ1 (forkhead box J1).
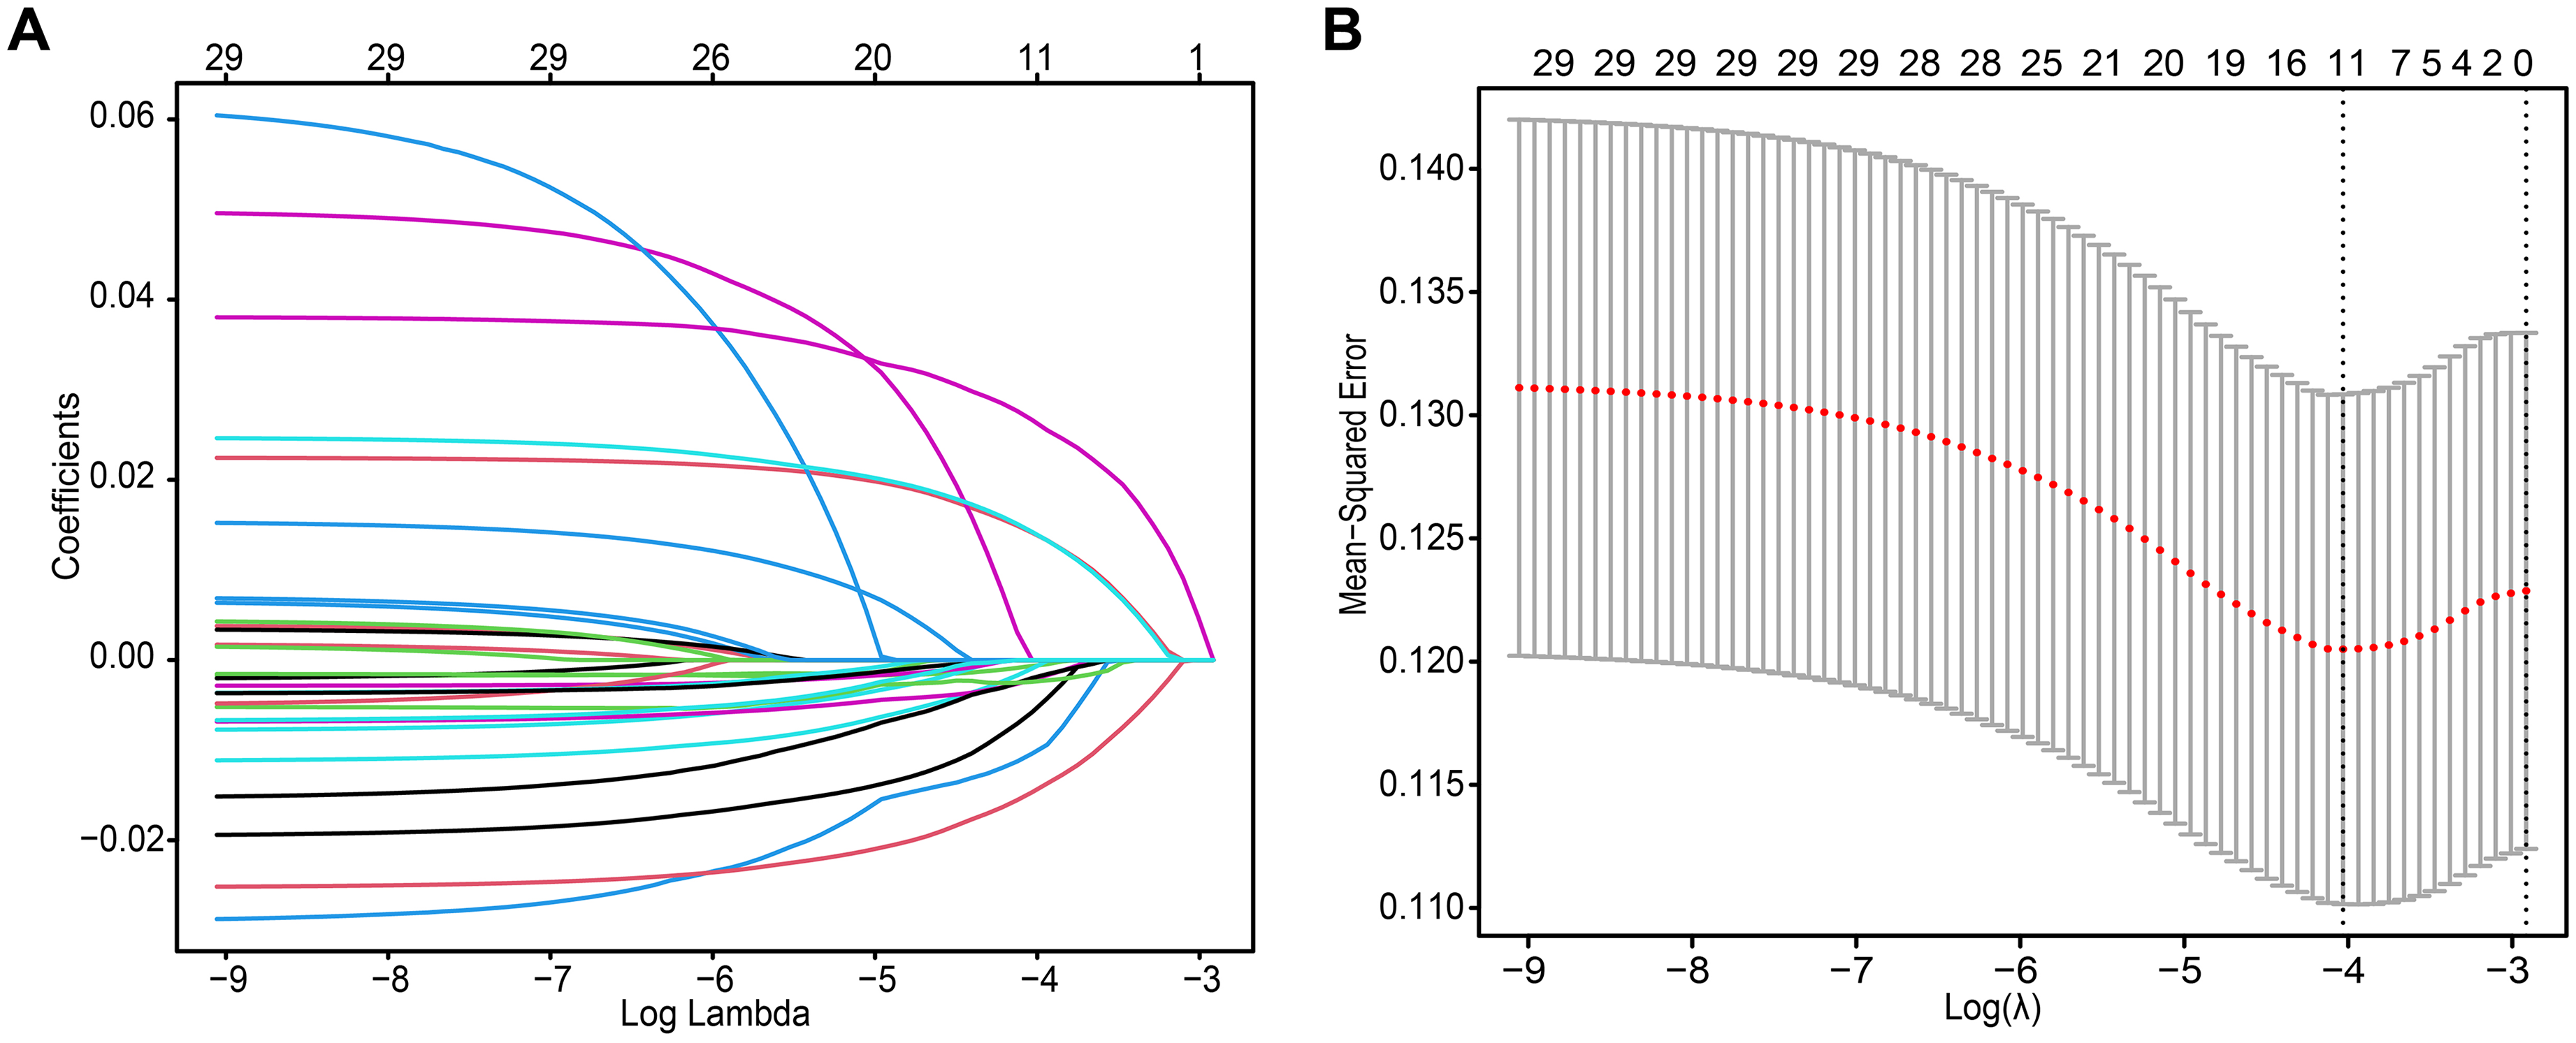
Regression analysis of BRCA DEGs was performed with least absolute shrinkage and selection operator (LASSO) cox model. (A) The best lambda of BRCA-DEGs-LASSO cox model, a minimum mean cross validated error, was calculated by ten-fold cross-validation. (B) Partial likelihood deviance for BRCA-DEGs-LASSO cox model. The partial likelihood values of LASSO cox model were presented with red dots. And standard error (SE) was represented with gray lines.
Next, the Cox coefficients of these four DEGs were calculated using multivariate Cox proportional hazard regression analysis. The risk score of each patient was then calculated based on the coefficients and expression of these four DEGs. Patients in the discovery TCGA cohort (Figure S2A), validation TCGA cohort (Figure S2B), total TCGA cohort (Figure S2C), and GEO cohort (Figure S2D) were grouped into high- or low-risk groups depending on the median risk score. The expression of each final gene in patients at different risk is displayed with heatmaps (Figure S2).
To estimate the correlation between the BRCA-DEGs-LASSO-Cox model and patient survival, log-rank test survival analysis was performed. We found that patients with higher risk scores (red groups) displayed poor overall survival in discovery TCGA cohorts (Figure 2A), and this phenomenon was also observed in the validation TCGA cohort (Figure 2B), total TCGA cohort (Figure 2C), and GEO cohort (Figure 2D).
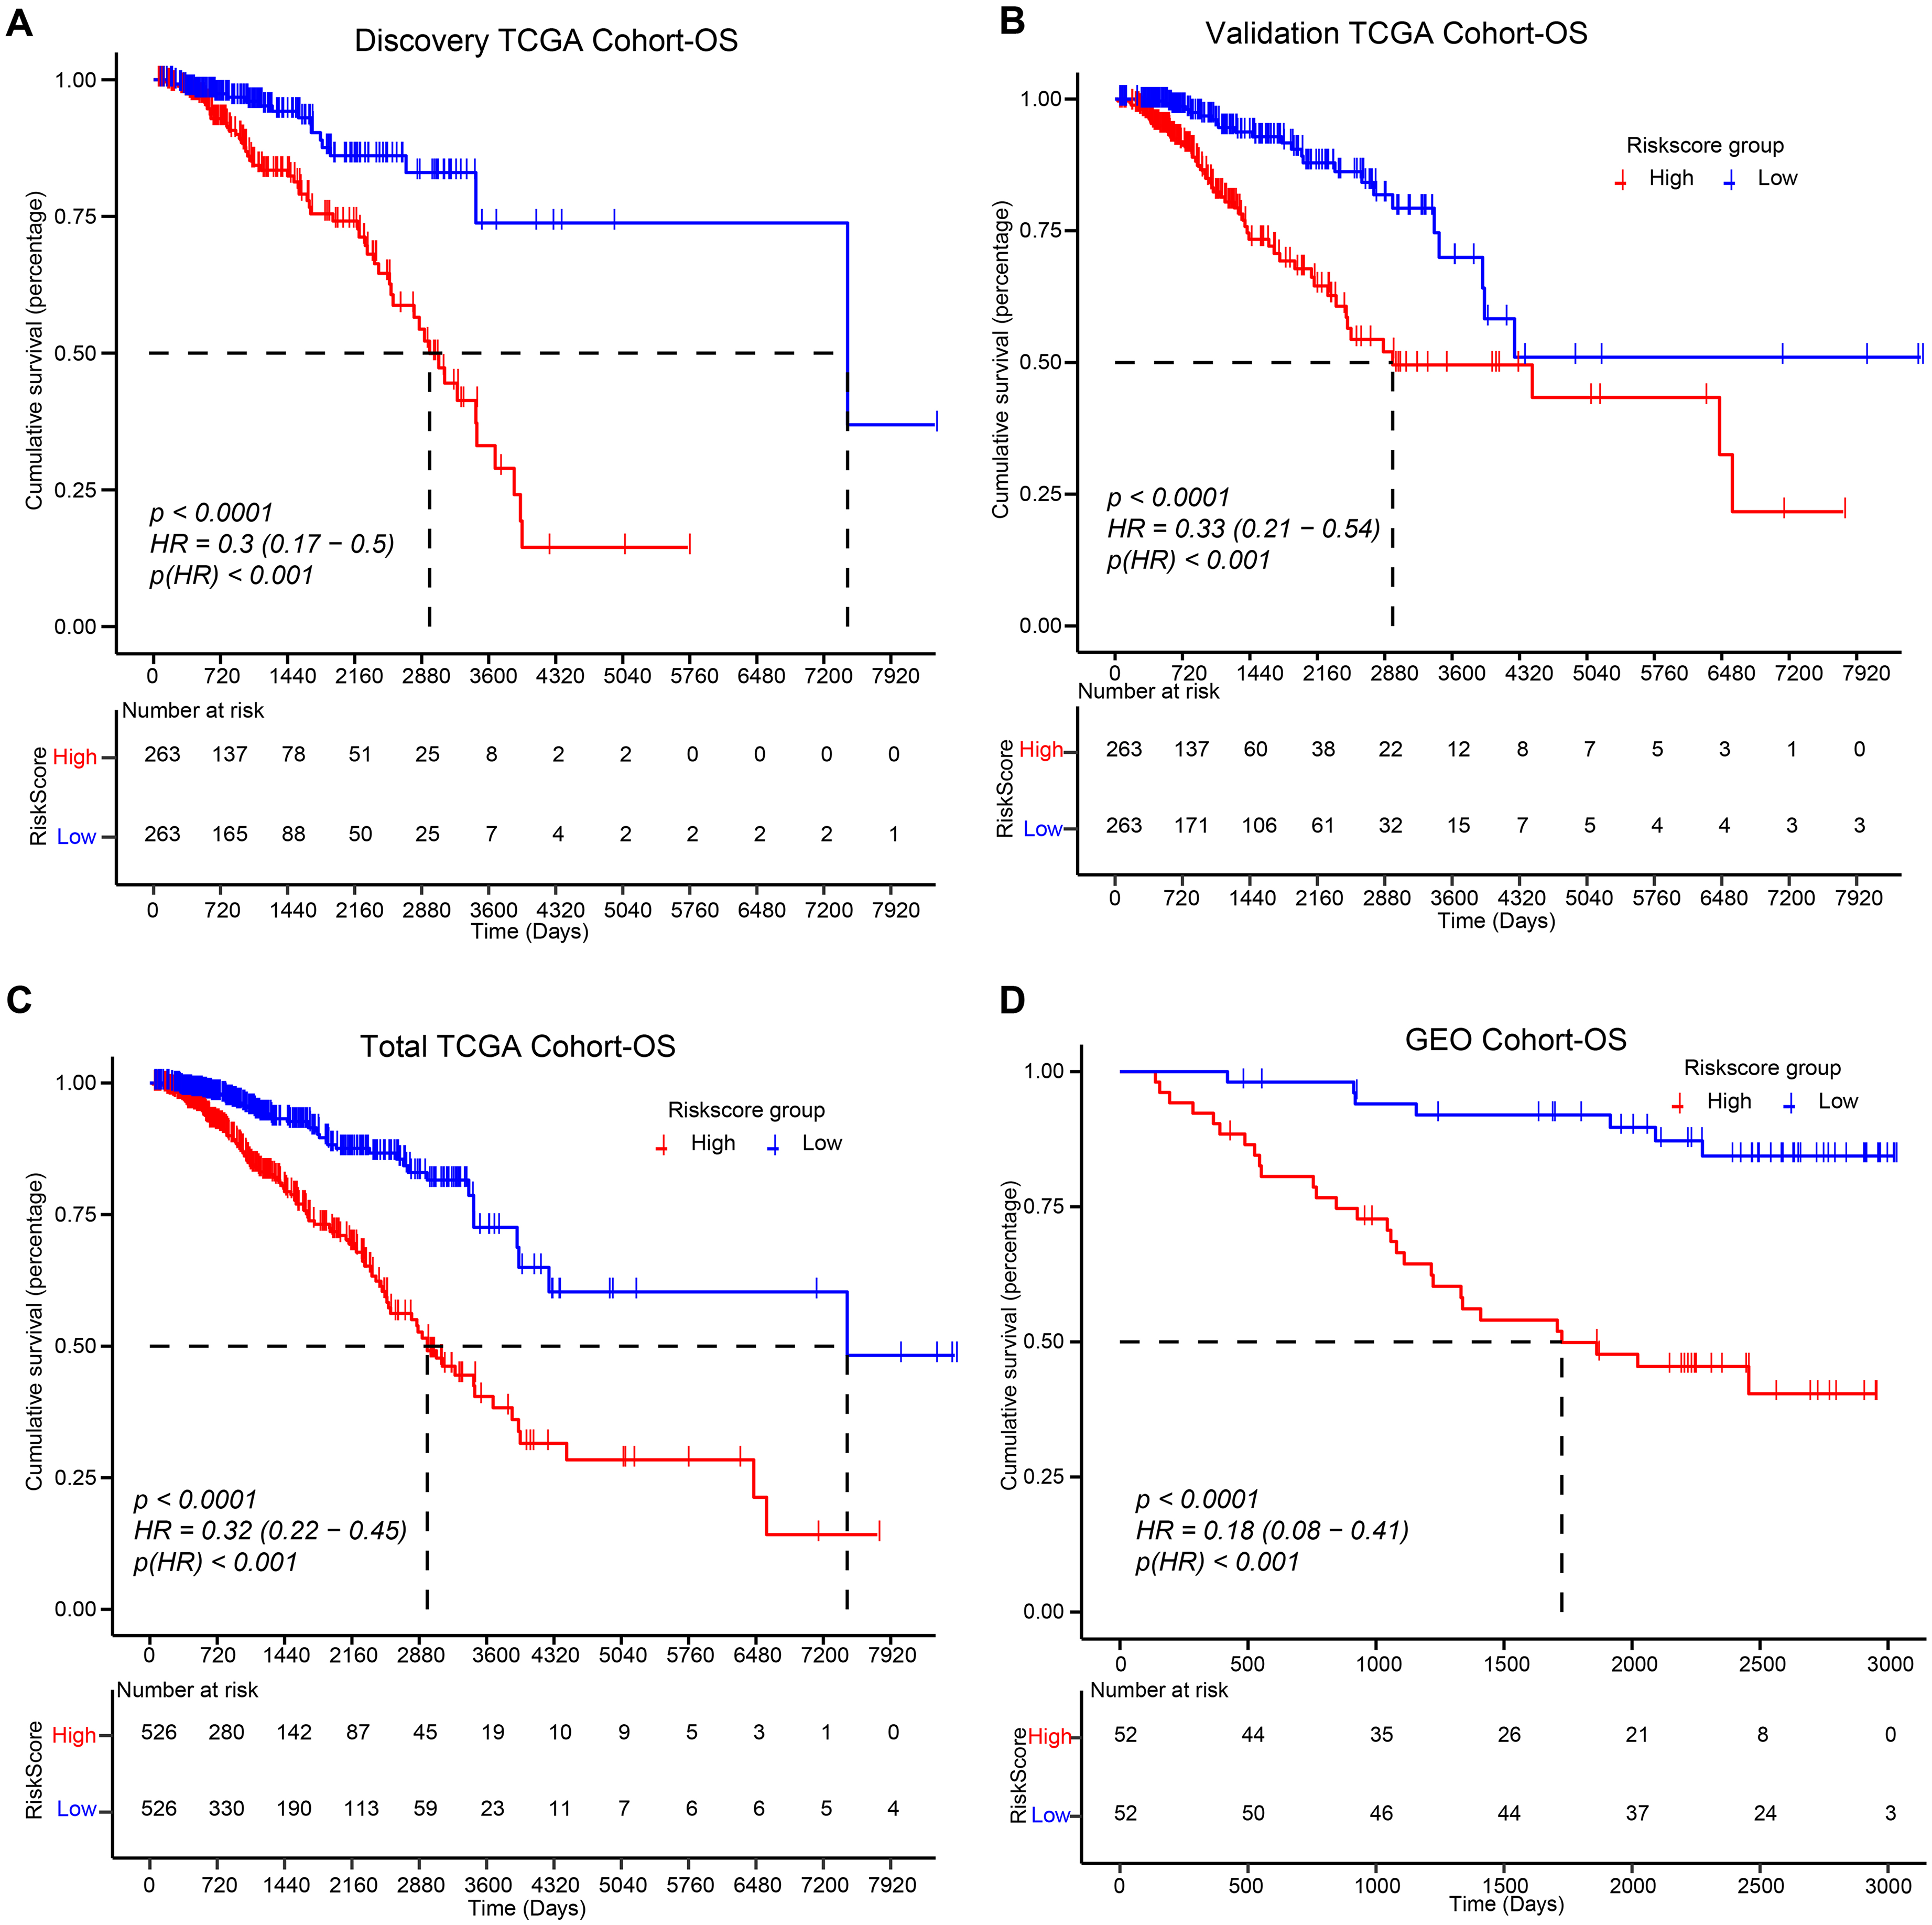
Effect of risk-score on overall survival (OS) in BRCA database, including discovery TCGA cohort (A), validation TCGA cohort (B), total TCGA cohort (C), and GEO cohort (D), was assessed about BRCA-DEGs-LASSO cox model with log-rank test survival analysis.
Finally, the multivariate Cox regression analyses of the BRCA-DEGs-LASSO-Cox model were also displayed with forest plots in different cohorts (Figure 3A-D), which displayed the aggregated combined effects of different indicators (including clinical stage, patient age, and risk score).
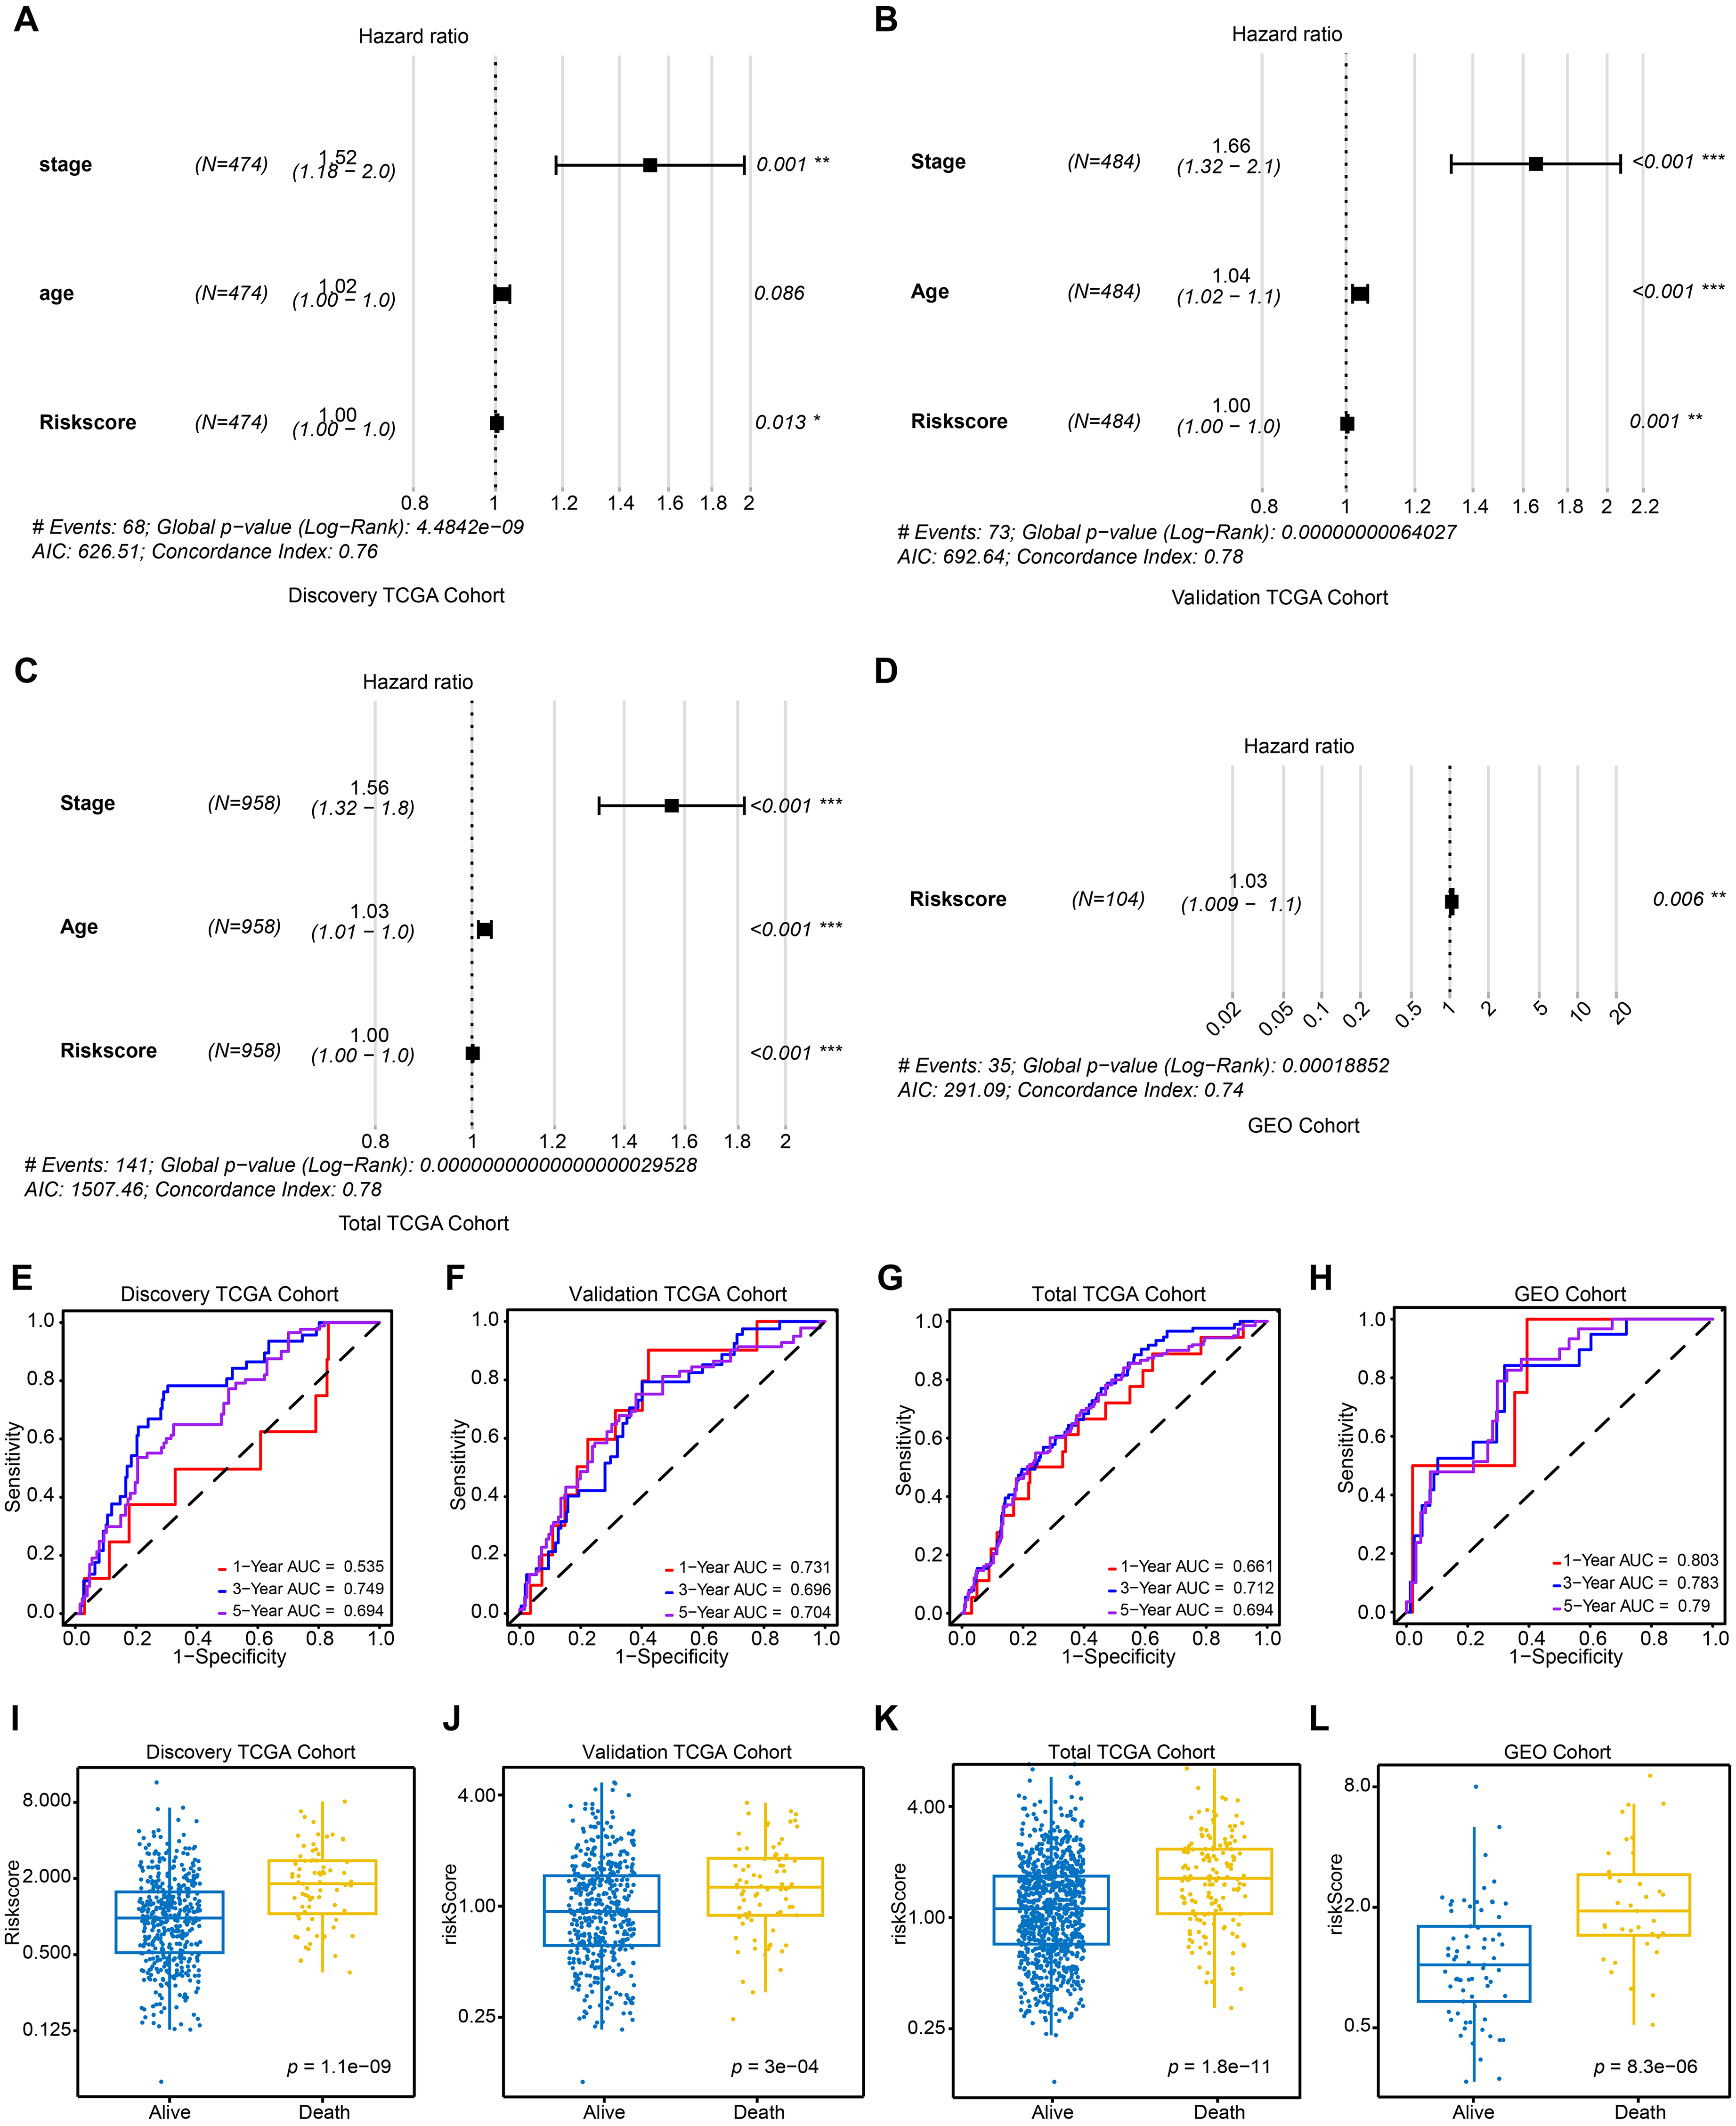
The prognostic value of BRCA-DEGs-LASSO cox model was estimated with different BRCA database. Multivariate Cox regression analyses of BRCA-DEGs-LASSO cox model was displayed with forest plots in BRCA database, including discovery TCGA cohort (A), validation TCGA cohort (B), total TCGA cohort (C), and GEO cohort (D). AUC of ROC curves was calculated to evaluate the prognostic value of the BRCA-DEGs-LASSO cox model in 1-, 3-, 5-years in the discovery TCGA cohort (E), the validation TCGA cohort (F), the total TCGA cohort (G), and GEO Cohort (H). Riskscore of BRCA-DEGs-LASSO cox model was compared between alive and death patients in the discovery TCGA cohort (I), the validation TCGA cohort (J), the total TCGA cohort (K), and GEO Cohort (L). *p < 0.05, **p < 0.01, ***p < 0.001.
Collectively, these data indicate that the BRCA-DEGs-LASSO-Cox model demonstrates a promising prognostic prediction capability.
Diagnostic value of BRCA-DEGs-LASSO-Cox model in breast cancer
Furthermore, to investigate the clinical relevance of the BRCA-DEGs-LASSO-Cox model, we generated AUC values of the ROC curves, which were utilized to assess the diagnostic accuracy of the prediction model. As depicted in Figure 3E, the BRCA-DEGs-LASSO-Cox model exhibited relative diagnostic accuracy (AUC: 0.6–0.75) across both 3-year and 5-year ROC in the discovery TCGA cohort. Similarly, this relative diagnostic accuracy was also observed in the validation TCGA cohort (Figure 3F), the total TCGA cohort (Figure 3G), and the GEO cohort (Figure 3H). More interestingly, we discovered a noteworthy distinction in the risk scores among the patient stages. (Figure 3I-L). Specifically, a higher risk score was primarily observed among patients who died than among those who were alive in the discovery TCGA cohort (Figure 3I). This finding indicates that the BRCA-DEG-LASSO Cox model can effectively predict patient outcomes. This phenomenon was also observed in the other three breast cancer cohorts (Figure 3J-L).
Finally, we integrated these independent prognostic factors, including clinical stage, risk score, and 1-, 3-, and 5-year OS, into nomogram plots (Figure S3).
These statistical results strongly suggested a close correlation between the BRCA-DEGs-LASSO-Cox model and the diagnostic accuracy of breast cancer.
Expressing and survival analysis of BRCA-DEGs-LASSO-Cox model key DEGs
To evaluate the expression patterns of key differentially expressed genes (DEGs) within the BRCA-DEGs-LASSO-Cox model, we performed a comparative analysis of these genes across breast tumor and adjacent non-tumor tissues. Boxplot visualization (Figure 4A) revealed significantly elevated expression levels of all model-derived DEGs in tumor specimens compared to non-malignant counterparts across the TCGA cohort. This differential expression pattern was consistently validated in an independent GEO cohort (Figure 4B). Complementary protein-level analysis using the Human Protein Atlas (HPA) further corroborated these findings, demonstrating increased abundance of these key DEGs at the translational level (Figures 4C-E).
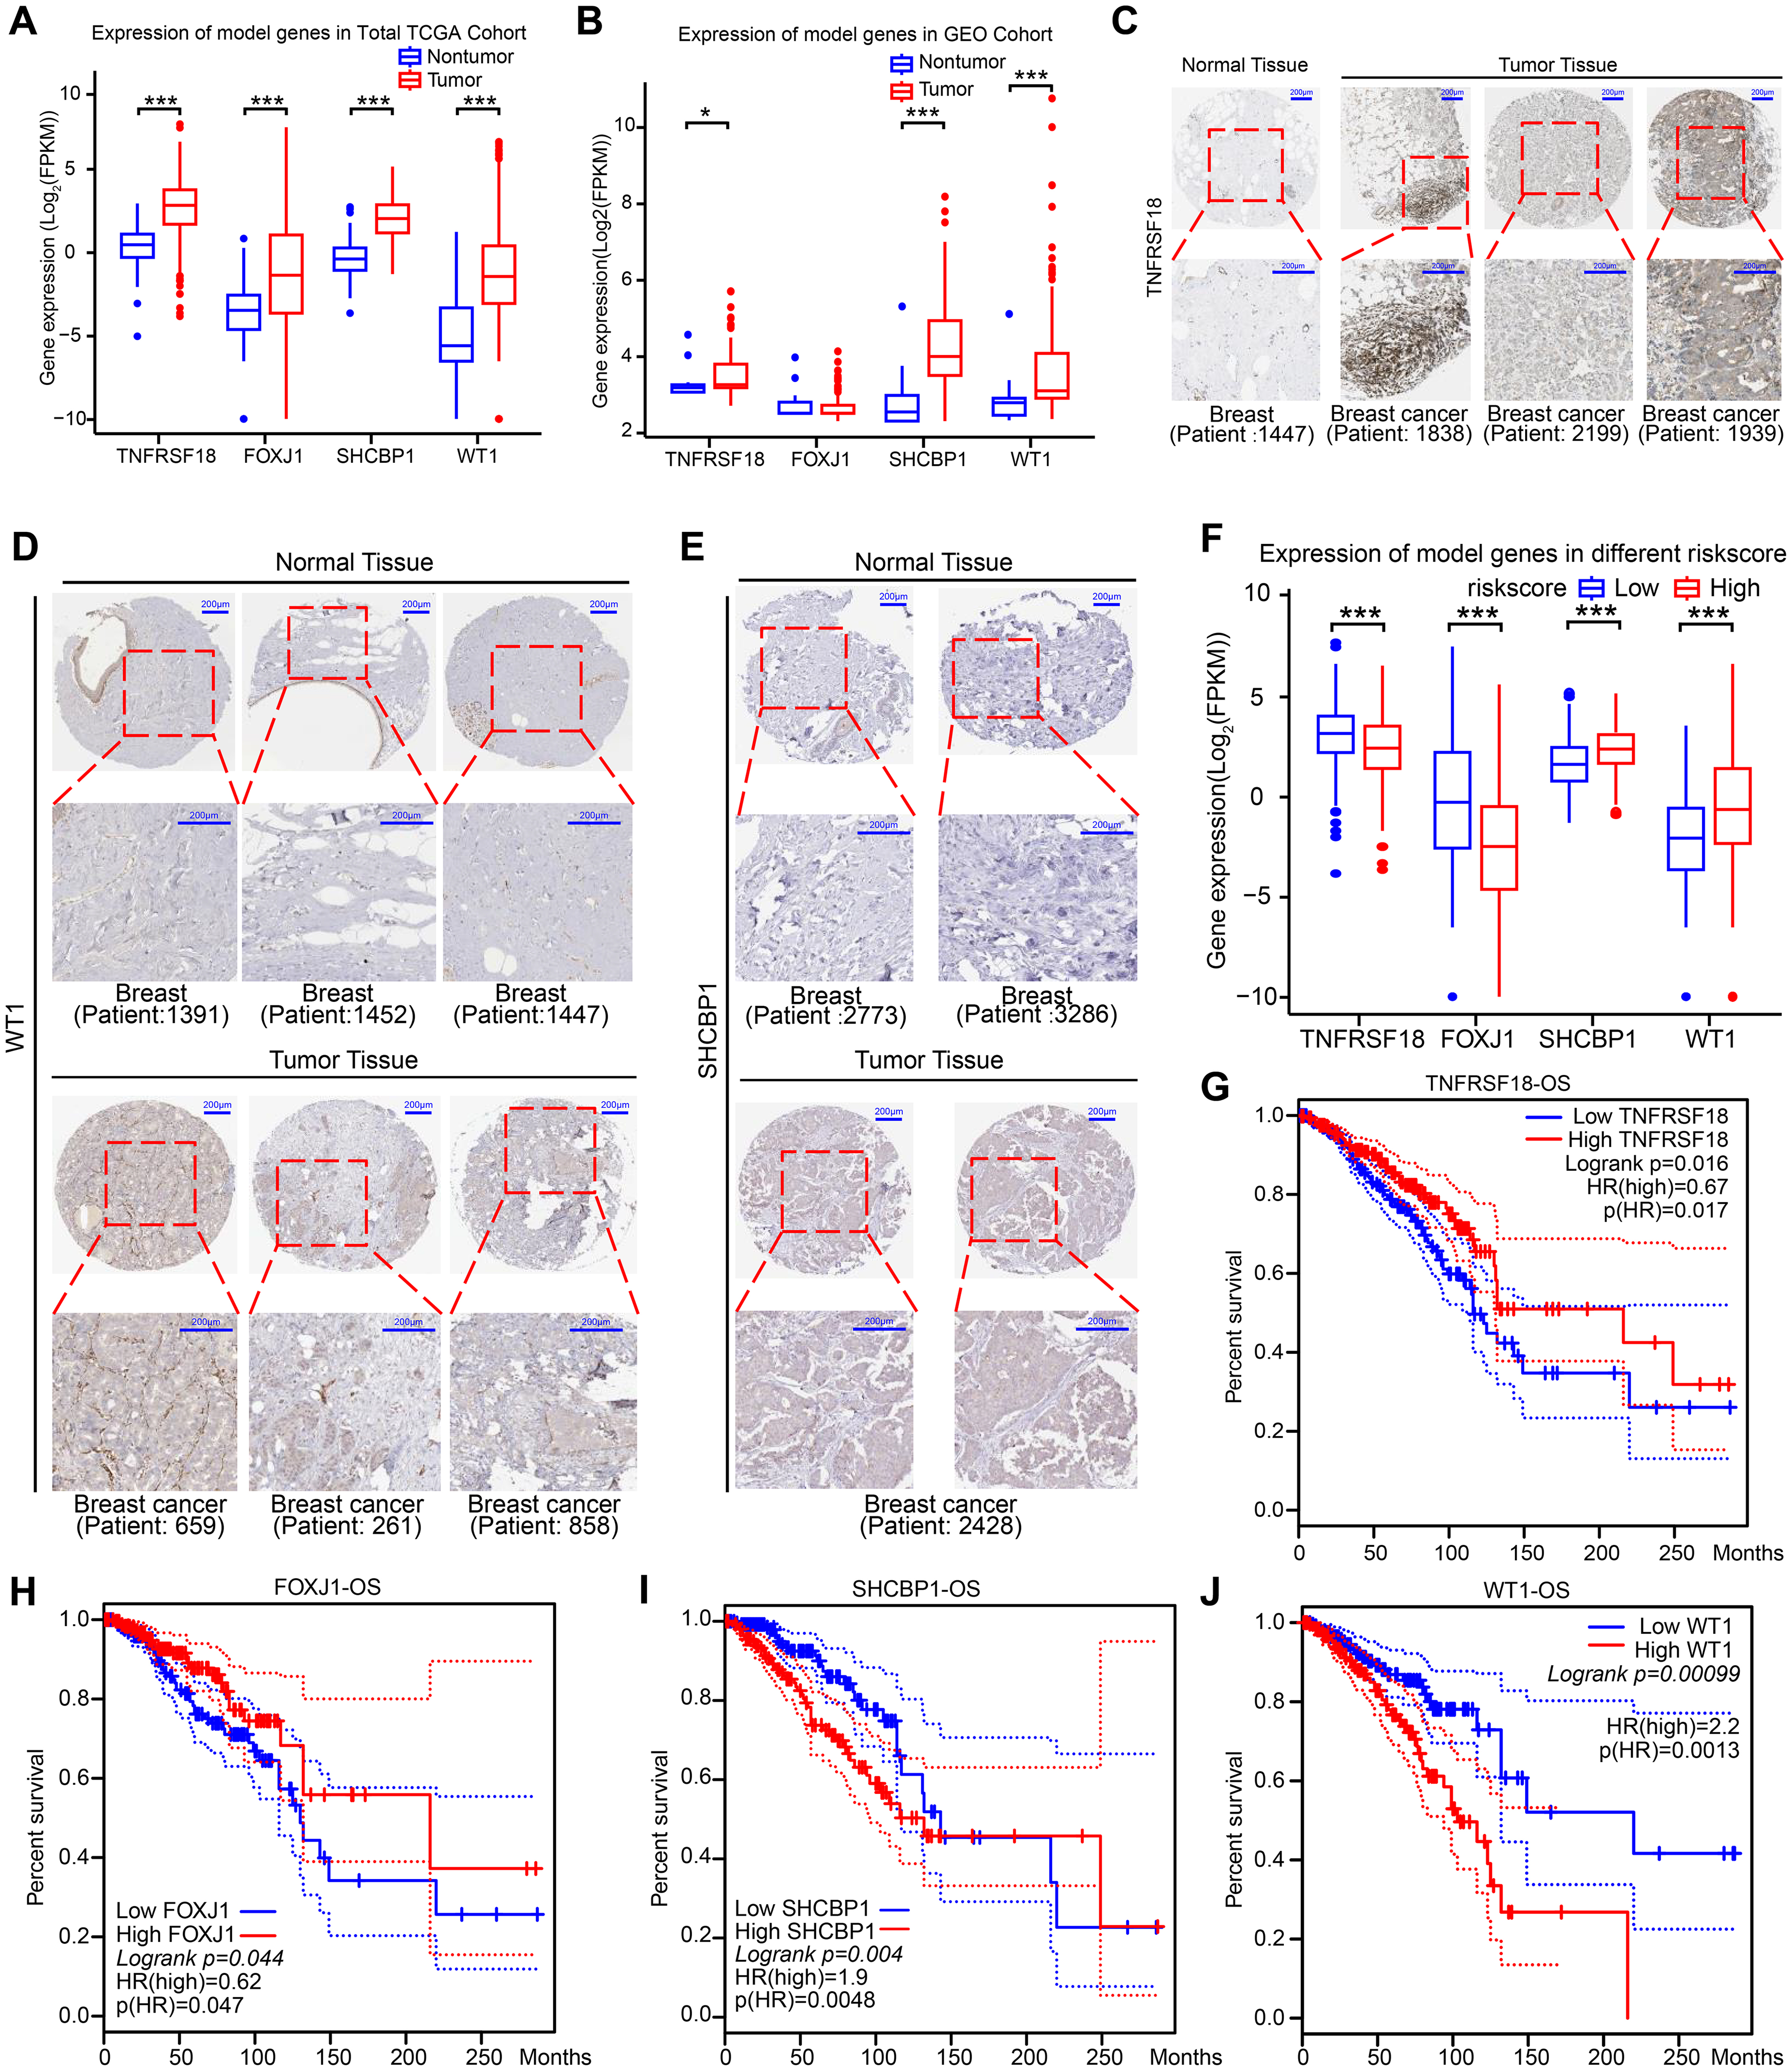
Expression and survival analysis of BRCA-DEGs-LASSO-cox model genes were performed in BRCA database. Expression of BRCA-DEGs-LASSO-Cox model genes between tumor and nontumor samples were accessed in TCGA cohort (A) and GEO cohort (B). Protein expression of BRCA-DEGs-LASSO-Cox model genes in breast cancer nontumor and tumor samples were displayed with immunohistochemical in HPA database (C-E). (F) Expression of BRCA-DEGs-LASSO-Cox model genes between different risk-score samples were accessed in TCGA cohort. (G-J) The effect of BRCA-DEGs-LASSO-Cox model genes’ expression on OS were accessed in TCGA cohort with Log rank test. * p < 0.05, *** p < 0.001. Patient id, patient identifier id from HPA. Scale bar, 200 μm.
Correlation analysis between risk scores and DEG expression profiles revealed distinct regulatory patterns: protective factors TNFRSF18 and FOXJ1 exhibited reduced expression in high-risk patients, whereas risk-associated genes SHCBP1 and WT1 showed marked upregulation in this subgroup (Figure 4F). Prognostic assessment demonstrated that patients with elevated expression of protective factors (TNFRSF18, FOXJ1) exhibited significantly improved survival outcomes (Figures 4G-H), while high expression of risk factors (SHCBP1, WT1) correlated with poor prognosis in breast cancer patients (Figures 4I-J).
Collectively, these findings demonstrate tight biological coupling between the BRCA-DEGs-LASSO-Cox model and its constituent DEGs, both at transcriptional and translational levels. The consistent association between risk stratification, DEG expression patterns, and clinical outcomes underscores the model's potential as a robust predictive biomarker for breast cancer prognosis and therapeutic decision-making.
Correlation between BRCA-DEGs-LASSO-Cox model, cell signals score, sex hormone receptor, and HER2
Dysregulation of classical cancer-related signals results in signaling pathway heterogeneity, which is a crucial factor in the diversity observed in breast cancer. To clarify the signaling pathway heterogeneity between patients with high- and low-risk scores, we assessed the relevance of the BRCA-DEGs-LASSO-Cox model with several classical cancer-related signals. As Figure 5A, patients with high-risk scores exhibited lower signal scores in terms of androgen, EGFR, estrogen, NF-κB, p53, TNF-α, Trail, and WNT than patients with low-risk scores. Conversely, hypoxia and PI3 K were hyperactivated in patients with high risk scores. These data imply that the poor prognosis of high-risk patients may be the result of repression of androgen, estrogen, EGFR, NF-κB, p53, TNF-α, Trail, and WNT signals, but activation of hypoxia and PI3 K signals. These data imply that the poor prognosis observed among high-risk patients may be attributed to the repression of androgen, estrogen, EGFR, NF-κB, p53, TNF-α, Trail, and WNT signals, whereas hyperactivation of hypoxia and PI3K signals may also contribute to this outcome.
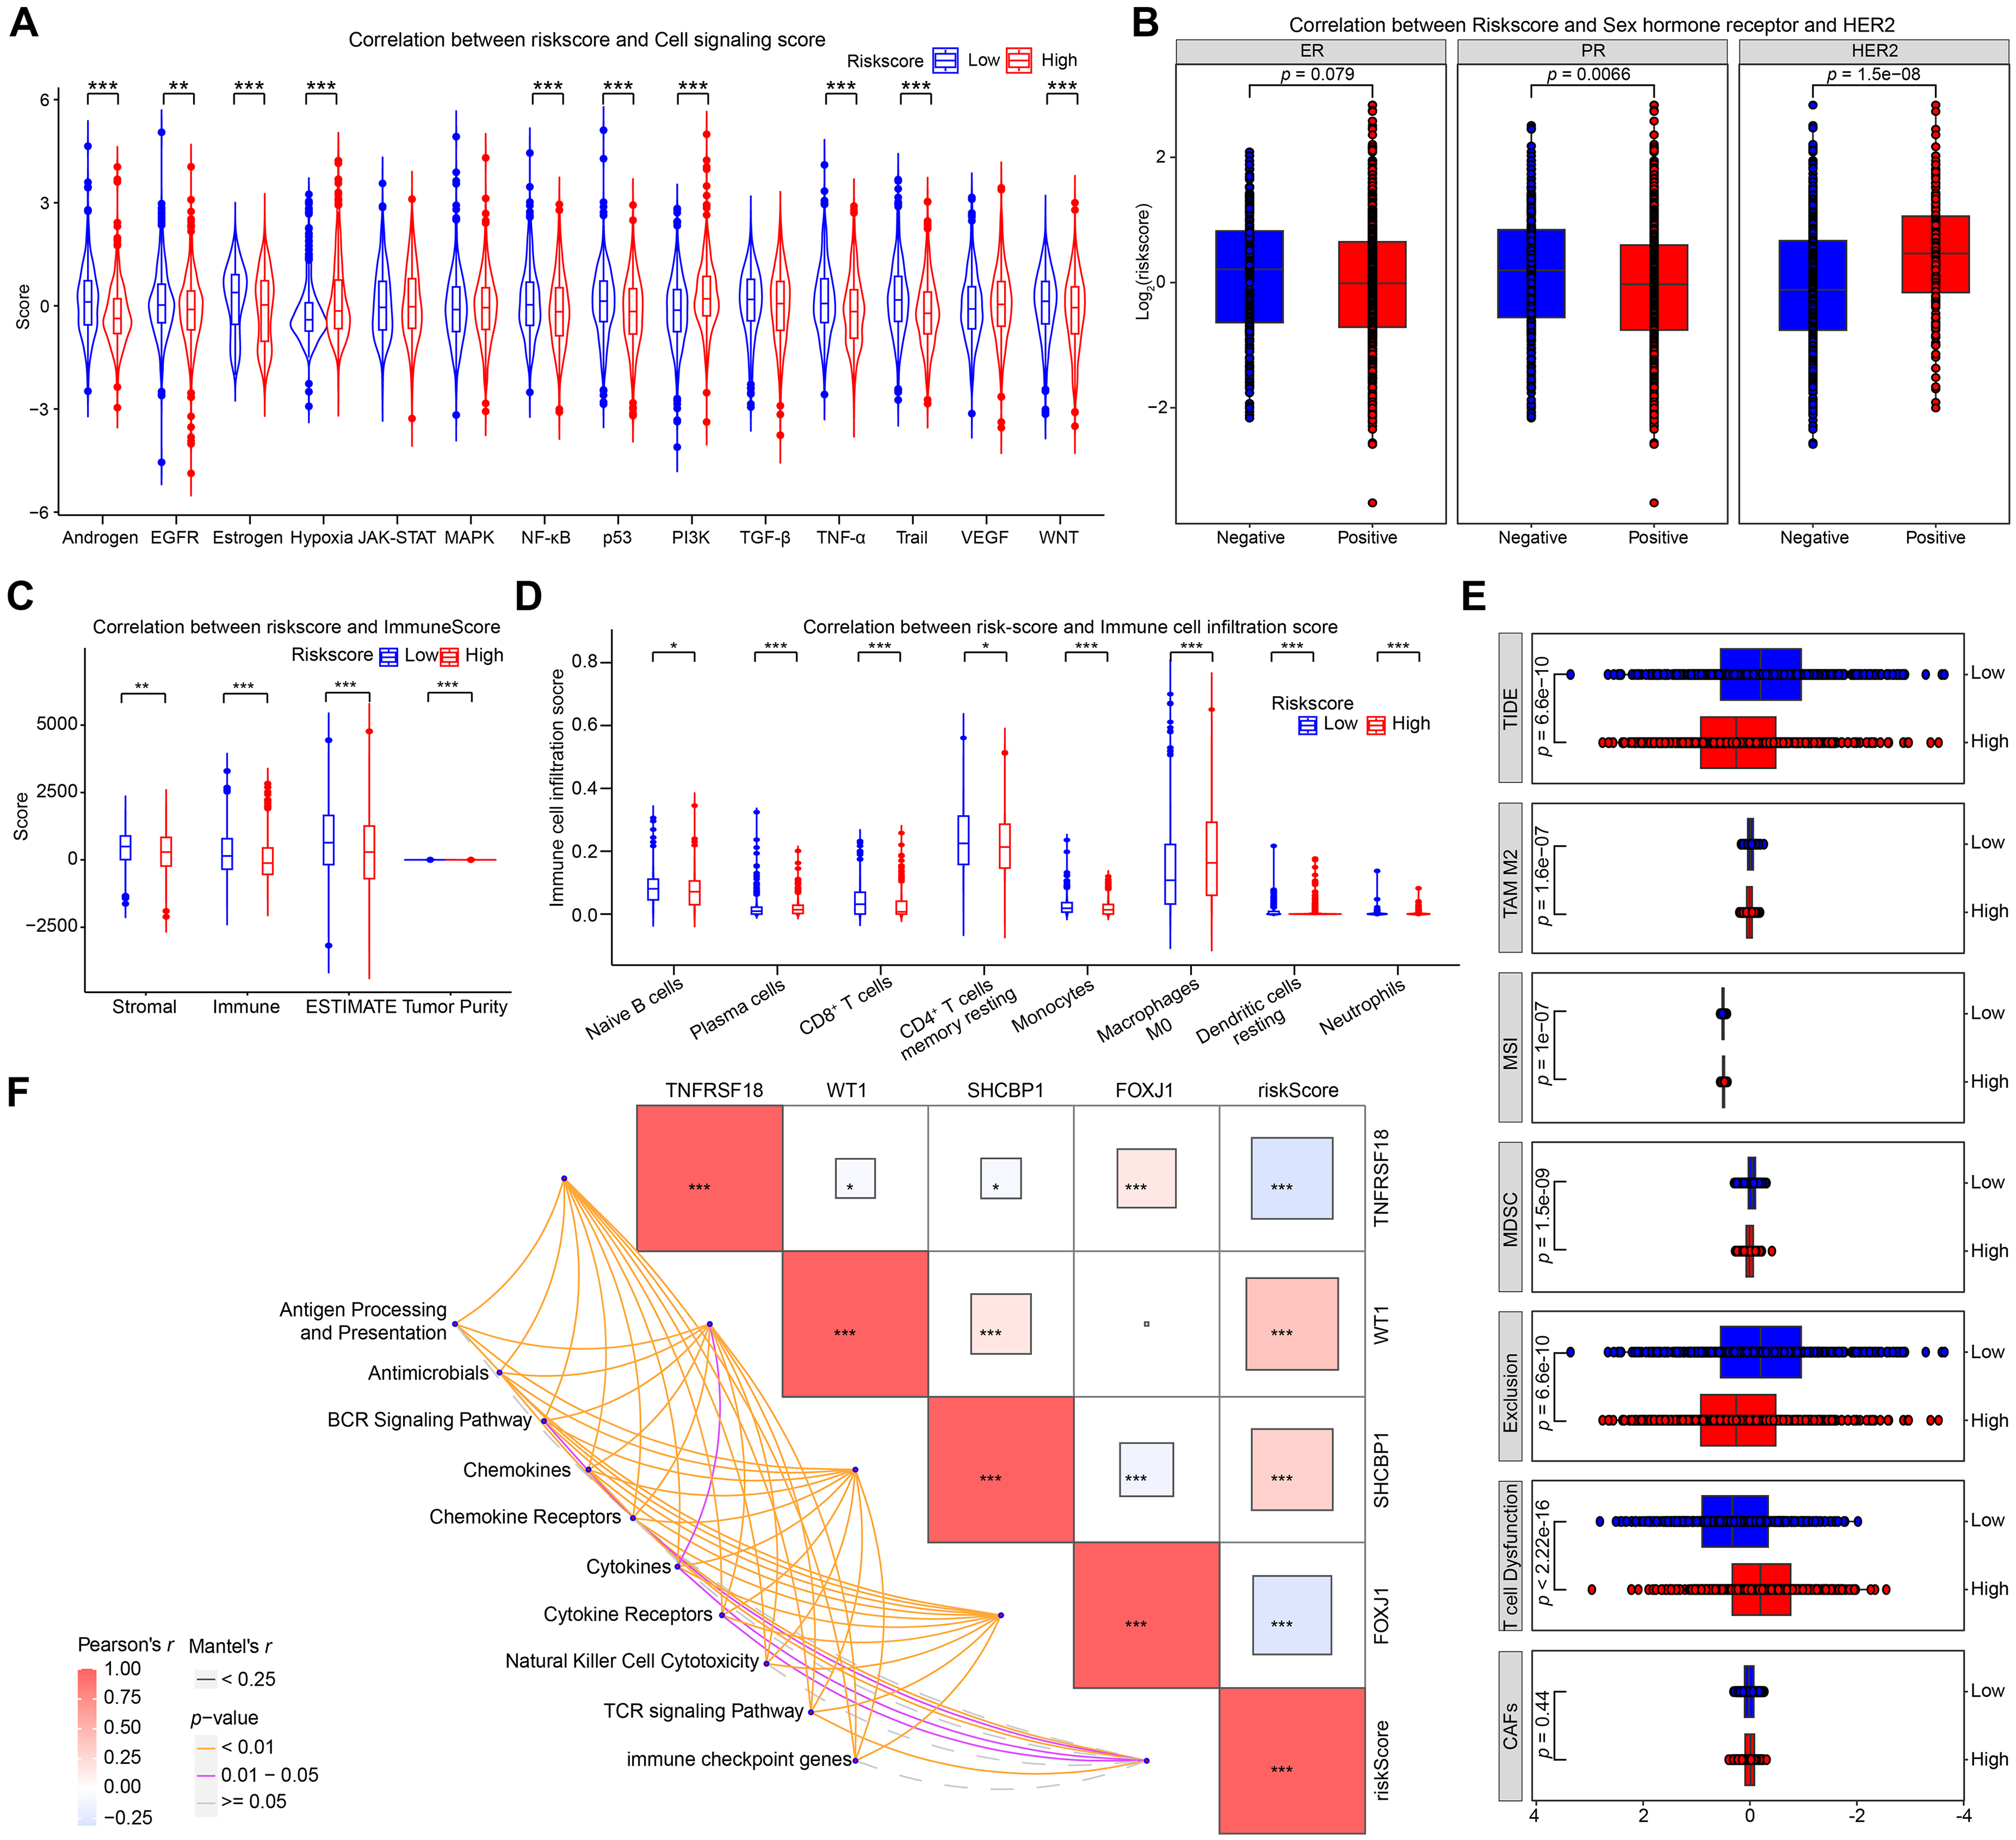
Correlation between BRCA-DEGs-LASSO-Cox model, cell signals score, sex hormone receptor, HER2 status, and immune microenvironment were estimated in TCGA BRCA cohort. (A) The effect of BRCA-DEGs-LASSO-Cox model's risk-score on cell signals score was displayed with violin plot. (B) The relationship between BRCA-DEGs-LASSO-Cox model, sex hormone receptor, and HER2 were showed with boxplots. (C) The effect of risk-score on immune score was displayed with boxplot. (D) Correlation between risk-score and immune cell infiltration score was performed with boxplot. (E) BRCA-DEGs-LASSO-Cox model was evaluated with cancer-associated fibroblasts (CAFs), T cell Dysfunction, Exclusion, Myeloid-derived suppressor cells (MDSC), Microsatellite Instability (MSI), M2-like tumor-associated macrophage (TAM M2), and tumor immune dysfunction and exclusion (TIDE) score. (F) Correlation between BRCA-DEGs-LASSO-Cox model and immune related genes were performed with correlation matrix diagram by Pearson's r. Student's t test was used to compare the significant differences between the different groups (*p < 0. 05, **p < 0. 01, ***p < 0. 001).
We also estimated the effects of protective factors (TNFRSF18 and FOXJ1) and risk factors (SHCBP1 and WT1) on these signaling pathways (Figure S4). Their effect was aligned with the risk score, indicating a consistent association between protective/risk factors and modulation of the signaling pathways involved. For example, there was a positive correlation between protective factors (TNFRSF18 and FOXJ1) and estrogen signal scores (Figure S4A-B, group 3). Instead, patients with high expression of risk factors (SHCBP1 and WT1) had a lower estrogen signal score (Figure S4C-D, group 3).
Finally, we explored the correlation between risk score and sex hormone receptor (estrogen receptor, ER; progesterone receptor, PR) and human epidermal growth factor receptor-2 (HER2), which are important predictive and prognostic molecular markers for breast cancer.51,52 As Figure 5B, patients who exhibited positive sex hormone receptors exhibited lower risk scores (panels 1 and 2). This observation is consistent with previous classical cancer-related signal score analyses (Figure 5A). Conversely, a higher risk score was predominantly observed among patients with positive HER2 status (Figure 5B, panel 3).
These data suggested a strong association between the BRCA-DEGs-LASSO-Cox model, sex hormone receptors, and HER2 status. Further investigation of the specific molecular mechanisms underlying these associations is warranted.
Effect of BRCA-DEGs-LASSO-Cox model on immune microenvironment in breast cancer
The immune microenvironment represents a critical determinant of tumor heterogeneity and significantly influences tumor initiation and progression. 53 To elucidate the interplay between the BRCA-DEGs-LASSO-Cox prognostic model and the tumor immune landscape, we first examined its impact on patient immune scores. Our analysis revealed that high-risk patients exhibited markedly reduced immune cell infiltration (Figure 5C), correlating with poorer clinical outcomes.
Detailed immunophenotyping demonstrated diminished infiltration of key antitumor immune cells in high-risk individuals, including naive B cells, CD8 + cytotoxic T lymphocytes, and resting memory CD4+ T cells. This immunosuppressive profile was further validated through spatial immune cell profiling, which confirmed significantly lower abundance of these antitumor effector populations in high-risk patients-a finding strongly associated with adverse prognosis (Figure 5D).
Mechanistic investigations into the biological underpinnings of this association revealed two key observations: 1) High-risk patients displayed evidence of T-cell exhaustion characterized by reduced effector function, and 2) Elevated Tumor Immune Dysfunction and Exclusion (TIDE) scores in this cohort suggested enhanced capacity for immune evasion and diminished likelihood of responding to immunotherapy (Figure 5E). These combined findings implicate immune escape mechanisms as contributors to the poor prognosis observed in high-risk patients.
To dissect the molecular pathways mediating these immune interactions, we evaluated correlations between the risk model and multiple immune-related gene signatures (Figure 5F). Notably, we observed significant associations with B-cell receptor (BCR) and T-cell receptor (TCR) signaling pathways, as well as immune checkpoint genes. These molecular connections highlight a bidirectional relationship where immune system dynamics both influence and are influenced by the BRCA-DEGs-LASSO-Cox risk stratification system.
In conclusion, our study establishes a robust connection between the BRCA-DEGs-LASSO-Cox prognostic model and the immune microenvironment in breast cancer. This interdisciplinary relationship holds considerable promise for predicting immunotherapy responsiveness and may inform the development of personalized treatment paradigms that integrate genomic risk assessment with immune modulation strategies.
Effect of BRCA-DEGs-LASSO-Cox model on BRCA drug sensitivity
Tumor heterogeneity is the main cause of drug resistance and an important prognostic factor for patients with breast cancer. 54 A comprehensive evaluation was conducted to assess the intricate relationship between this model and drug sensitivity in breast cancer patients.
First, we calculated the drug sensitivity of patients with breast cancer using their gene expression profiles. Next, the effect of the risk score and key DEGs on drug sensitivity was compared and displayed as boxplots (Figure 6A). We found that patients with high-risk scores were more sensitive to several breast cancer-related drugs, including cisplatin, olaparib, axitinib, alisertib, palbociclib, crizotinib, sorafenib, irinotecan, oxaliplatin, iraparib, talazoparib, XAV939, dabrafenib, temozolomide, leflunomide, tospletinib, ribociclib, selumetinib, zoledronate, fludarabine, and pyridostatin. In line with this, high sensitivity to these drugs was also observed in patients with high protective factors (TNFRSF18 and FOXJ1) (Figure 6B-C). Meanwhile, patients with high-risk factors (SHCBP1 and WT1) displayed lower sensitivity to these drugs than those with low-risk factors (Figure 6D-E).
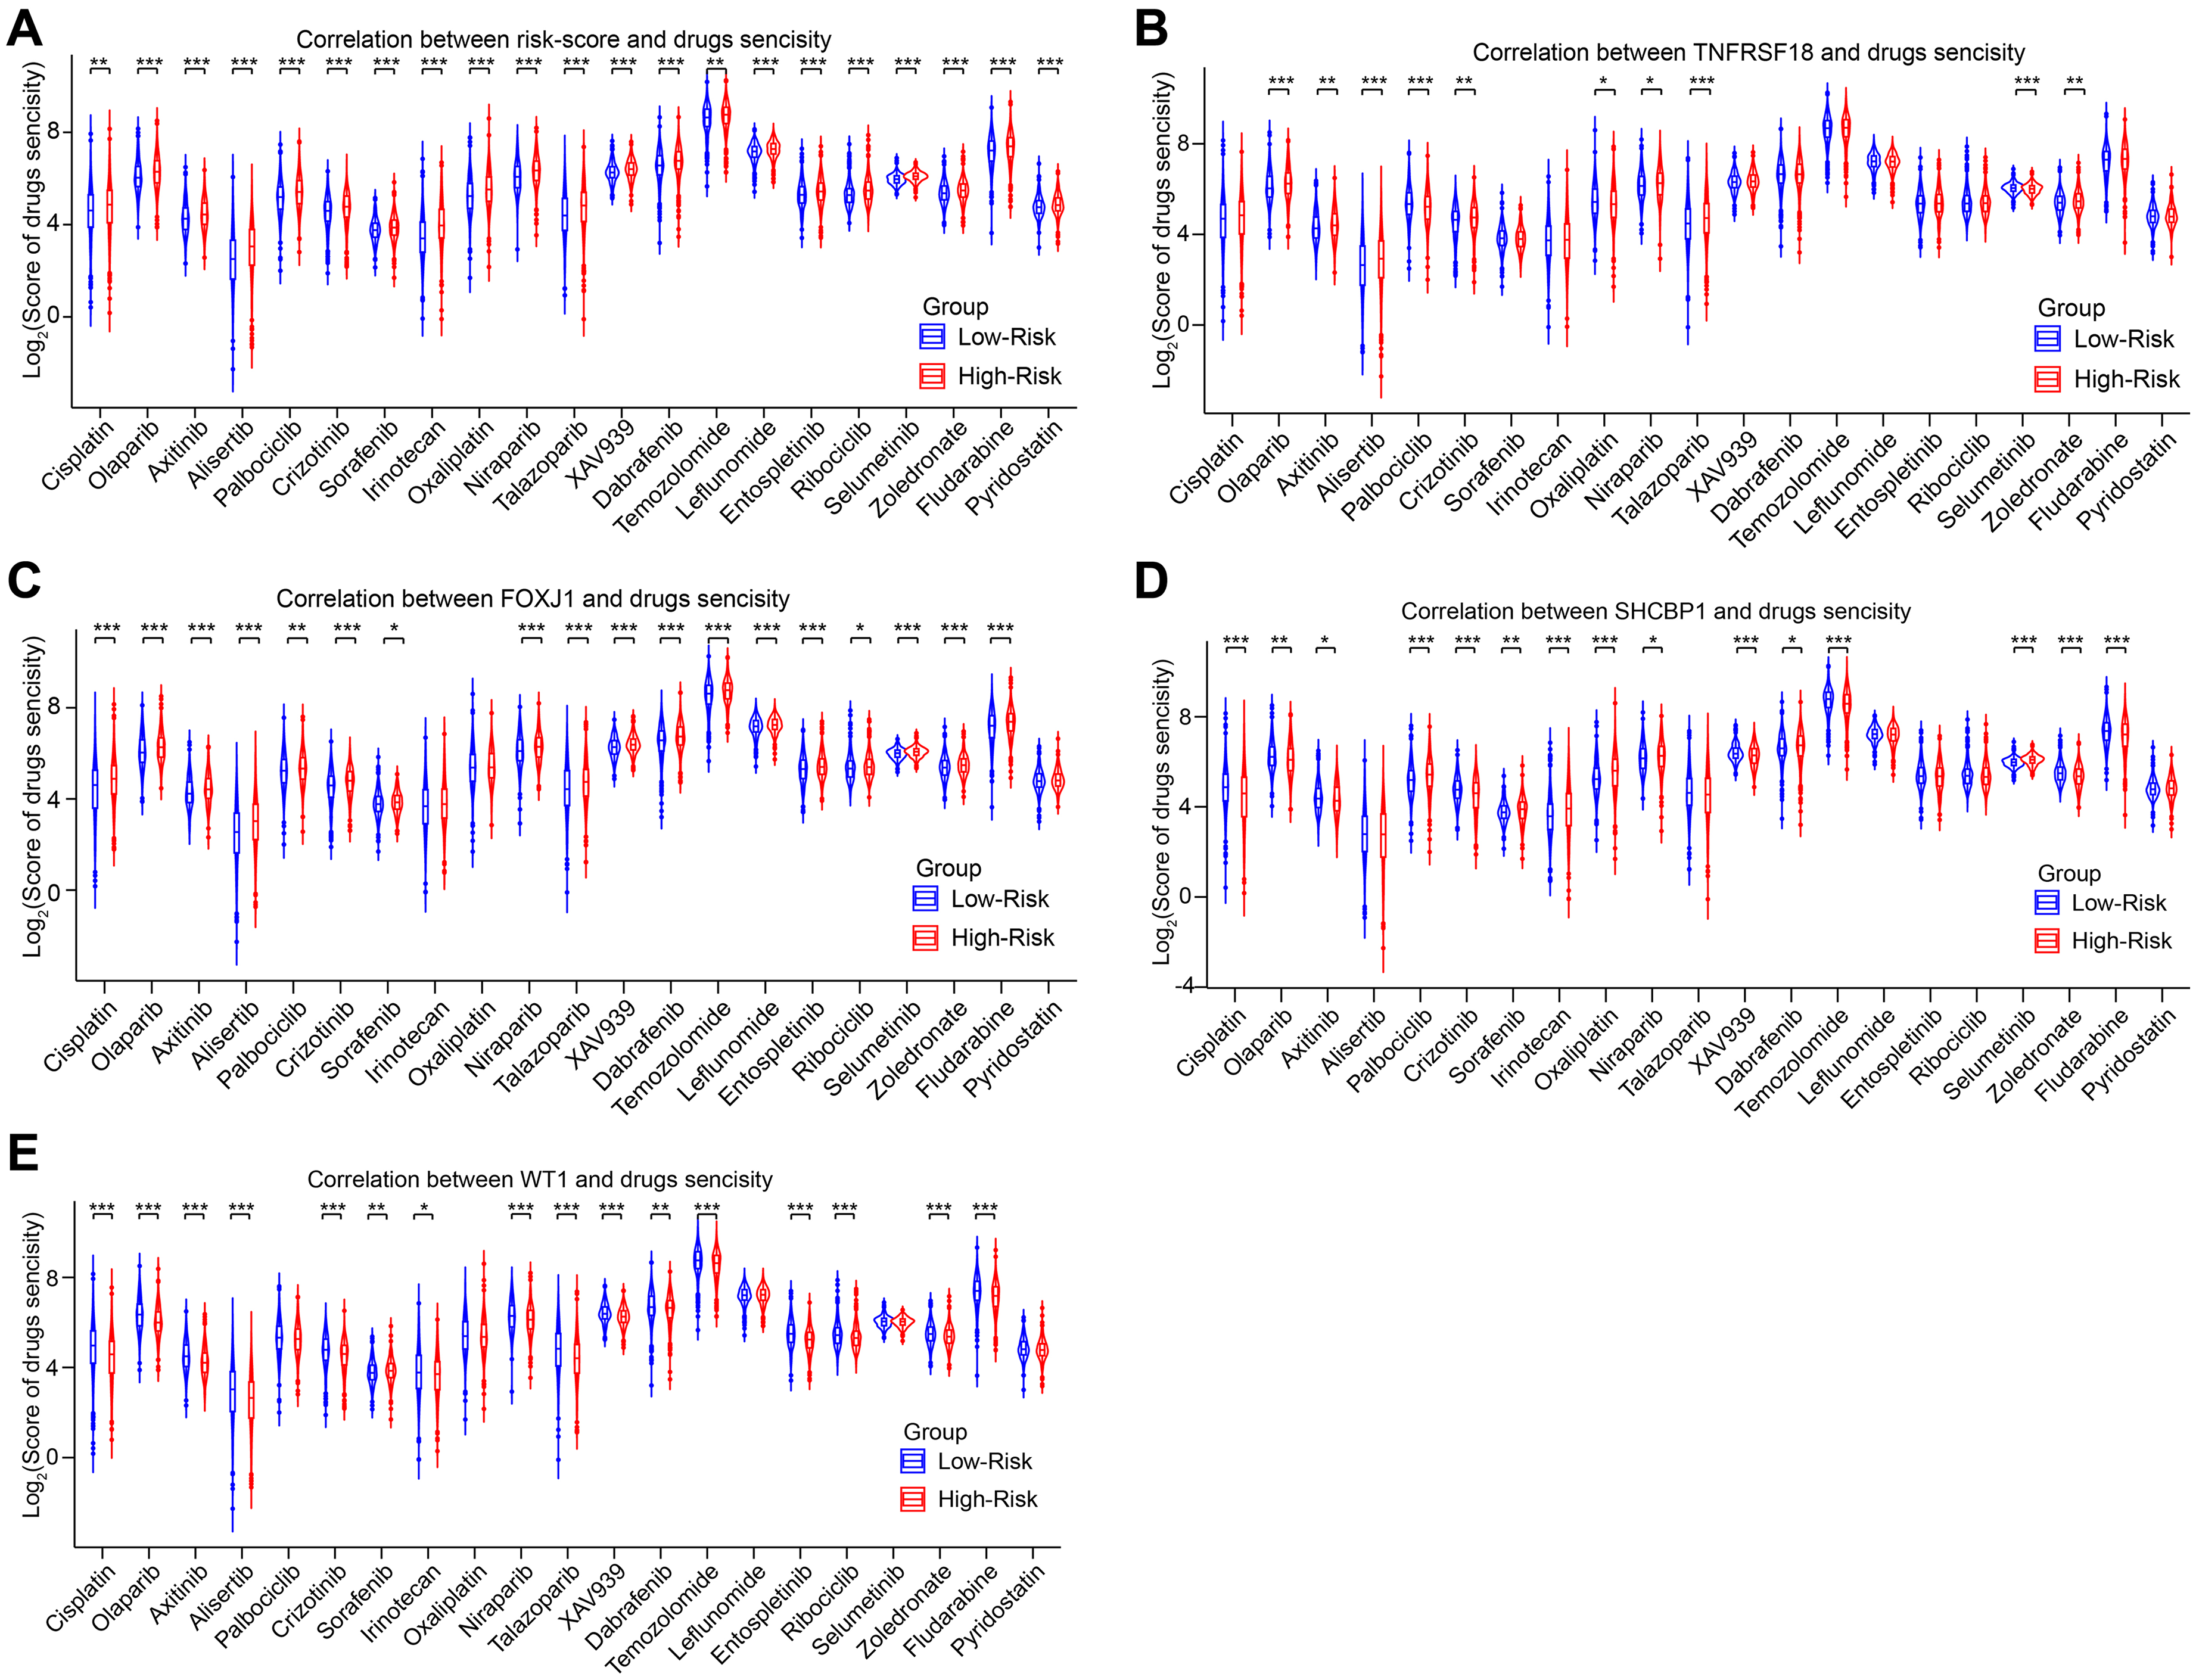
Correlation between BRCA-DEGs-LASSO-Cox model and drug sensitivity was accessed in TCGA cohort. (A) The effect of risk-score on BRCA drug sensitivity was displayed with violin diagram. (B-E) The effect of BRCA-DEGs-LASSO-Cox model's genes on BRCA drug sensitivity were performed with violin diagram. Student's t test was used to compare the significant differences between the different groups (*p < 0. 05, **p < 0. 01, ***p < 0. 001).
These data suggest that the BRCA-DEGs-LASSO-Cox model could be an indicator for drug prediction in breast cancer.
Potential molecular mechanism underlying the poor prognosis in high-risk breast cancer patients
To explore the potential molecular mechanism of poor prognosis in high-risk patients, TCGA breast cancer samples were stratified into high- and low-risk groups based on their risk scores. Subsequently, 358 differentially expressed genes (DEGs) were identified between the two groups. Of these, 330 genes were downregulated and 28 genes were upregulated (Figure 7A). Interestingly, our analysis revealed that protective factors such as TNFRSF18 and FOXJ1 showed lower expression levels in high-risk patients, whereas risk factors such as SHCBP1 and WT1 showed elevated expression levels. These findings align with the previously established correlation between the BRCA-DEGs-LASSO-Cox model and protective/risk factors, thus further validating the reliability of our results. To investigate the function of these DEGs, GO functional enrichment analysis was conducted. As shown in Figure 7B, these high-risk related DEGs were mainly enriched in cell cycle and mitosis. Additionally, GSEA enrichment analysis showed that high-risk related DEGs were mainly involved in immune-related signals, such as TNF-α, IL-6, IL-2, INF-γ, and inflammation. These findings suggest that the poor prognosis of high-risk patients may be attributed to the abnormal regulation of glycoproteins and immune-related signals. These results were consistent with those of previous immune microenvironment analyses.
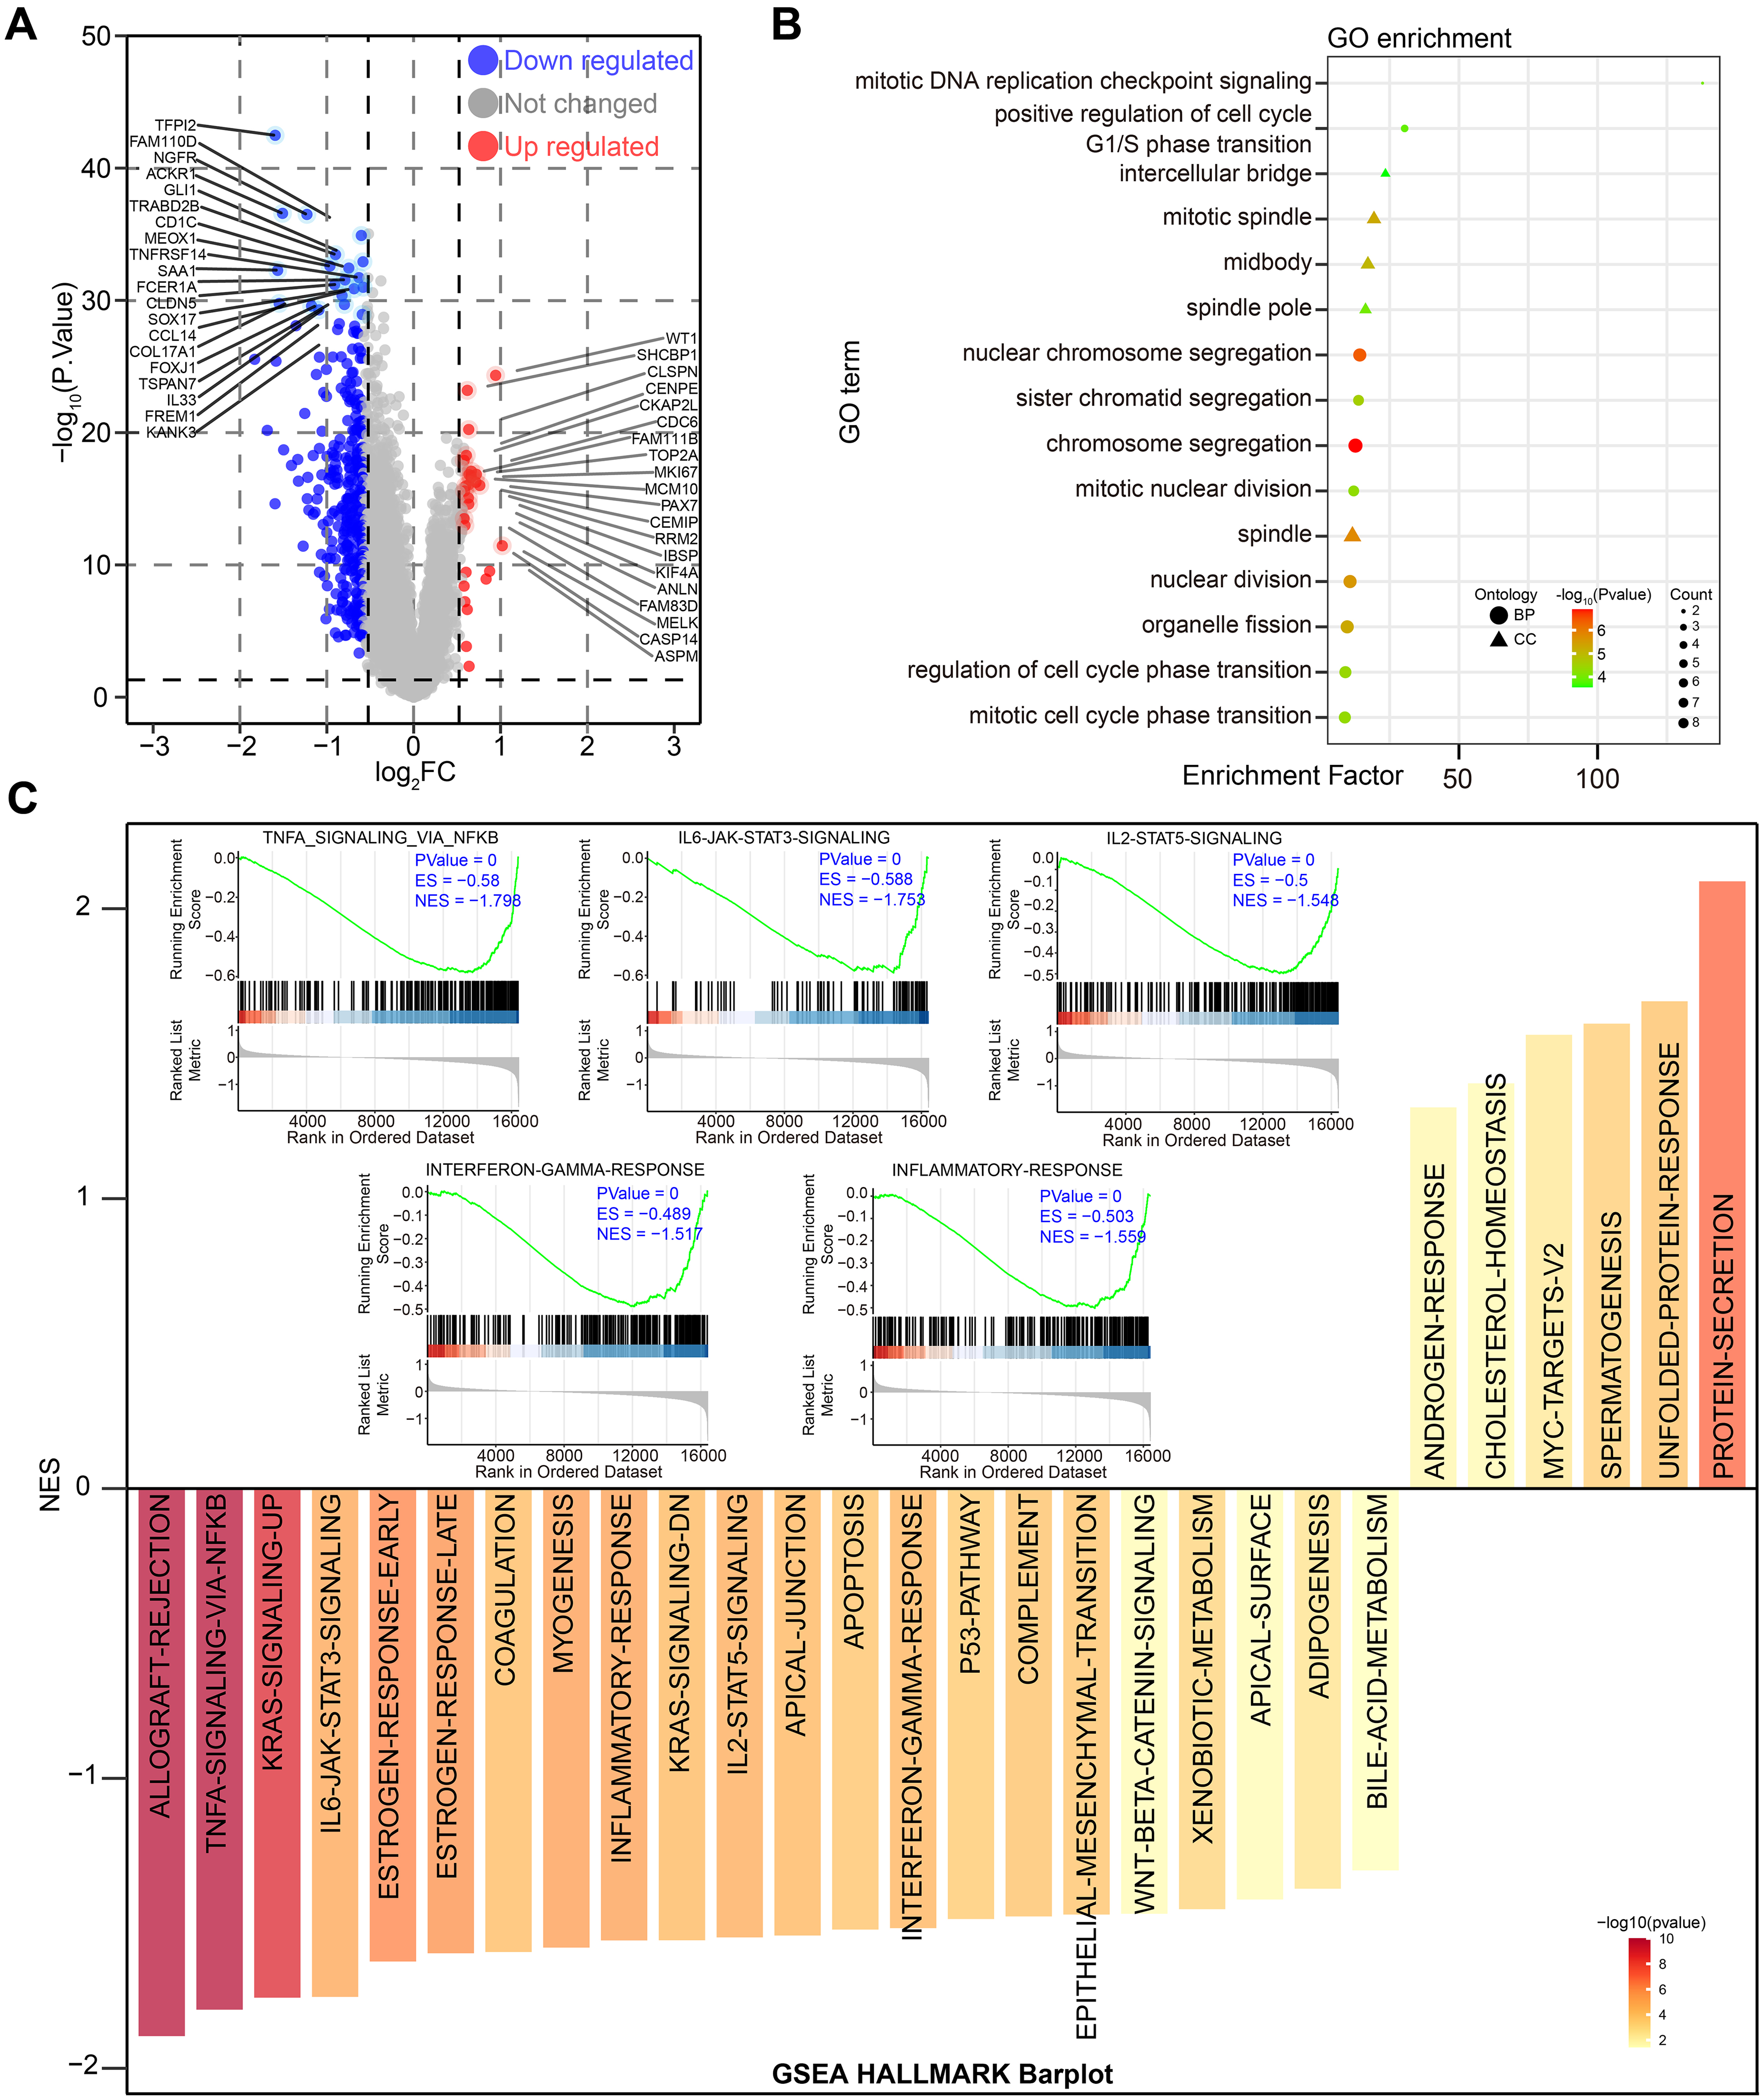
DEGs filtering and function enrichment of BRCA-DEGs-LASSO-Cox model was accessed in TCGA BRCA cohort. (A) The effect of BRCA-DEGs-LASSO-Cox model's risk-score on gene expression profile was displayed with volcano plot. (B) Function enrichment of these DEGs was performed with Gene Ontology (GO). (C) Function of these DEGs were estimated by GSEA (gene set enrichment analysis). The criteria of DEGs were |log2FC| > 0.58 and p < 0.05.
Collectively, these data suggest that the poor prognosis observed in high-risk patients may be attributed to dysregulation of the immune microenvironment and the cell cycle. This dysregulation is mediated by immune-related signals and glycoproteins.
Discussion
The rapid evolution of high-throughput sequencing technology has paved the way for the generation of a vast amount of biomedical data, laying a robust foundation for the creation of machine-learning-based prognostic models. In this research endeavor, we harnessed breast cancer data from The Cancer Genome Atlas (TCGA) to construct a prognosis model centered on differentially expressed genes. Employing machine learning techniques, we named this model the BRCA-DEGs-LASSO-Cox model. Subsequently, we validated the model using independent datasets. Our research findings reveal that the BRCA-DEGs-LASSO-Cox model demonstrates exceptional performance in forecasting patient survival. In particular, the risk score generated by this model stands out as an independent prognostic factor. Its efficacy is on par with that of previously established BRCA risk models associated with ferroptosis, cuproptosis, epithelial-mesenchymal transition (EMT), m6A-immune regulation, pyroptosis, and hypoxia.14,15,18,21,55 Specifically, breast cancer patients classified as high-risk by our BRCA-DEGs-LASSO-Cox model displayed a dismal clinical prognosis across multiple patient cohorts. This model exhibited a remarkably high diagnostic accuracy in breast cancer cases. Moreover, the dysregulation of the pivotal genes incorporated into the model consistently showcased a strong capacity for survival prediction, with the risk score acting as a dependable prognostic indicator. It is also worth highlighting that breast cancer samples from high-risk patients predominantly exhibited a negative status for sex hormone receptors while showing positive HER2 expression. Finally, the high-risk designation assigned by our model has the potential to function as a marker for predicting the response to immunotherapy and drug sensitivity.
The majority of breast cancer prognosis models center their attention on particular sets of signature genes, including those associated with ferroptosis, fatty acid metabolism, pyroptosis, cuproptosis, and m6A modification.56,57 Additionally, some models specifically target pyroptosis-related, 55 cuproptosis-related, 17 and m6A-related 58 genes. The aforementioned models have highlighted a strong correlation between breast cancer and various gene sets along with distinct phenotypes, suggesting promising application prospects for breast cancer prediction models. Nevertheless, these predictive models are constrained by the specifically chosen gene sets, potentially resulting in biased outcomes. In contrast, the BRCA-DEGs-LASSO-Cox model was constructed using DEGs in breast cancer, without being restricted to particular signature genes, thereby circumventing this limitation.
PROGENy, a software designed to assess the extent of tumor signaling pathway activation, can surmount the constraints of traditional pathway activity inference approaches by leveraging a substantial number of perturbation experiments. 59 This software has showcased the efficacy of its algorithm in delving into the potential molecular mechanisms underlying target genes or models. However, the previously discussed LASSO-based prognosis models for breast cancer failed to gauge the correlation between the risk score and the degree of tumor signaling pathway activation. In high-risk patients, a notable decrease in activity was observed across several signaling pathways, including the sex hormone receptor, EGFR, NF-κB, p53, TNF-α, Trail, and Wnt/β-catenin pathways. Conversely, the hypoxia and PI3 K signaling pathways were found to be activated.
It is well-established in the field of immunology that an “immunologically cold” state is a prominent feature of most breast cancers. Among breast cancer subtypes, only triple-negative breast cancers (TNBCs) have shown promising outcomes in immunotherapy. The potential effectiveness of immunotherapy for other breast cancer subtypes remains a subject of intensive research. 60 In our current study, we observed a pronounced regulation of immune-related signaling pathways. This finding suggests that the BRCA-DEGs-LASSO-Cox model may play a role in the immune microenvironment of breast cancer. Moreover, high-risk patients demonstrated a decrease in immune cell infiltration and an increase in TIDE scores. These observations imply that the poor prognosis of high-risk patients may be linked to immune evasion. Interestingly, while high-risk patients show a higher infiltration of plasma cells, which are typically considered a marker of antitumor immunity, 61 they also exhibit a lower infiltration of antitumor immune cells, specifically CD4+ T cells and CD8+ T cells. All these immune microenvironment characteristics of high-risk patients are closely associated with their unfavorable prognosis.
Drug resistance continues to be a major hurdle in determining the prognosis of breast cancer patients, and tumor heterogeneity stands as a crucial factor contributing to this resistance. To begin with, tumor heterogeneity can give rise to drug resistance through mutations in therapeutic targets. For instance, in the case of breast cancer, resistance to anti-estrogen therapy is predominantly attributed to mutations in the estrogen receptor 1 (ESR1) gene. These mutations lead to the hyperactivation of the estrogen receptor (ER) signaling pathway. 62 Secondly, tumor heterogeneity can bring about changes in the expression of key genes, which in turn affects the response to immunotherapy. For example, the heterogeneous expression of programmed death-ligand 1 (PD-L1) in tumor cells results in a wide range of sensitivities to PD-1 and anti-PD-L1 treatments among patients. 63 Moreover, tumor heterogeneity determines the extent of immune cell infiltration within the tumor and subsequently influences resistance to immunotherapy. 64 Furthermore, tumor heterogeneity leads to the dysregulation of critical signaling pathways, ultimately causing drug resistance. A prime example is the abnormal regulation of interferon-γ signaling, which has a direct impact on the effectiveness of tumor immunotherapy. 65 In summary, tumor heterogeneity exerts its influence on the tumor microenvironment by affecting key target mutations, altering gene expression, and modulating immune cell infiltration as well as key signaling pathways, all of which collectively lead to tumor resistance. Our research findings have unveiled a significant correlation between risk scores and sensitivity to a variety of drugs. Notably, patients with high-risk breast cancer have demonstrated increased sensitivity to several well-established cancer-related drugs. These include cisplatin, olaparib, axitinib, alisertib, palbociclib, crizotinib, sorafenib, irinotecan, oxaliplatin, niraparib, talazoparib, dabrafenib, temozolomide, leflunomide, tospletinib, ribociclib, selumetinib, zoledronate, fludarabine, and Pyridostatin.66–70 These discoveries may provide valuable insights that could potentially revolutionize the treatment of breast cancer.
Finally, it has been reported that the molecular mechanisms underlying the poor prognosis of breast cancer involve a range of signaling pathways, including STAT3, PI3K-AKT, NF-κB, Notch, and HER2-HER3 signaling pathways.71,72 In our current study, we discovered that the poor prognosis of high-risk patients might be predominantly regulated by several key genes within our model, namely TNFRSF18, FOXJ1, SHCBP1, and WT1. Previous research has indicated that FOXJ1 may act as a tumor suppressor gene in breast cancer,73,74 a finding that aligns with its protective effect observed in our study. Similarly, the risk factor SHCBP1 has been shown to play a tumor-promoting role in multiple types of cancer.75,76 Specifically, when SHCBP1 is hyperactivated in conjunction with HER2 activation, it promotes tumor cell mitosis and reduces the sensitivity of cancer cells to trastuzumab. 77 In our analysis, SHCBP1 was found to be highly expressed in high-risk patients and was associated with a poor prognosis. Moreover, in breast cancer, patients with high levels of WT1 expression exhibited significantly lower overall survival compared to those with low WT1 expression, 78 a trend that was also evident in our study. Additionally, our analysis of high-risk-related DEGs suggested that the poor prognosis might be a result of dysregulation in cell cycle transition or mitosis. Furthermore, immune microenvironment-related signaling pathways, such as TNF-α/NF-κB and IL-6-JAK-STAT3, are also implicated in this process. In summary, we have constructed a prognostic risk model based on DEGs, known as the BRCA-DEGs-LASSO-Cox model, which demonstrates robust performance in predicting high-risk patients. The signaling pathways, immune status, drug sensitivity, and molecular mechanisms associated with the BRCA-DEGs-LASSO-Cox model may lay the groundwork for precision medicine and individualized treatment strategies.
The BRCA-DEGs-LASSO-Cox model shows immense potential for revolutionizing clinical practice in the realm of breast cancer. It enables biology-driven risk stratification and the development of personalized treatment strategies. By categorizing patients into high-and low-risk groups based on their gene expression profiles, the model paves the way for tailored surveillance and intervention. High-risk individuals may receive aggressive monitoring and early adjuvant therapies, while low-risk patients could potentially be spared from overtreatment. When integrated with clinical staging, such as the TNM classification, the model enhances prognostic precision. It captures the biological heterogeneity that traditional parameters often overlook. In the context of treatment decision-making, the model serves as a valuable guide for selecting targeted therapies. For instance, it can recommend endocrine therapies or CDK4/6 inhibitors for ER + tumors with estrogen signaling dysregulation, PI3 K/AKT/mTOR inhibitors for cases with PIK3CA mutations, or androgen receptor modulators for specific subsets of patients. Moreover, it informs immunotherapy approaches, including the use of immune checkpoint blockade (e.g., pembrolizumab) for patients with immune dysregulation. The model also optimizes chemotherapy by aligning drug choices with predicted sensitivity profiles. For example, platinum agents can be prescribed for patients with DNA repair defects, and it allows for the de-escalation of treatment in low-risk groups. From a clinical perspective, the model enriches biomarker-driven trials by selecting patients with pathway-specific activation or immune profiles. This accelerates drug development. Additionally, it supports post-treatment monitoring through dynamic risk scoring, which helps in detecting recurrence or resistance mechanisms, such as MAPK pathway activation. The integration of the model with multi-omics data or artificial intelligence (AI) platforms has the potential to further refine predictions. However, it is crucial to address challenges like prospective validation across diverse patient cohorts, cost-benefit trade-offs, and ensuring equitable access to the model. Ultimately, this model represents a paradigm shift towards precision oncology. It offers actionable insights that can improve patient outcomes through interdisciplinary collaboration and its rigorous integration into evolving clinical frameworks.
Conclusion
In this study, we successfully constructed a prognostic risk model, the BRCA-DEGs-LASSO-Cox model, leveraging DEGs that exhibited robust performance in predicting high-risk patients with breast cancer. Unlike previous studies that relied solely on a single type of data (such as gene expression data), we have integrated multi-dimensional information from various sources (including transcriptome, immunome, and drug sensitivity data) to construct a comprehensive risk model. This cross-dimensional data integration approach enables a more comprehensive reflection of the complexity and heterogeneity of breast cancer, thereby enhancing the predictive accuracy and reliability of the model. Our study not only focuses on prognosis prediction but also delves into the association between the risk model and tumor immune status as well as drug sensitivity. Through bioinformatics analysis, we have identified multiple gene signatures related to immune cell infiltration, immune pathway activation, and drug response. These signatures provide new insights into understanding the immune escape mechanisms of breast cancer and developing personalized treatment plans. Meanwhile, our risk model demonstrates good predictive performance in an independent validation set, suggesting its potential clinical application value. With further clinical validation and optimization, this model is poised to become a powerful tool to assist doctors in making treatment decisions, assessing patient prognosis, and predicting drug sensitivity. Finally, this study not only provides new ideas and methods for precision medicine in breast cancer but also promotes interdisciplinary collaboration and cross-disciplinary research. By integrating knowledge and technologies from multiple fields such as genomics, immunology, pharmacology, and clinical medicine, we aim to provide more precise and personalized treatment options for breast cancer patients. Therefore, by exploring the molecular mechanisms underlying high-risk patient identification, we have gained a deeper understanding of the malignant process in breast cancer, paving the way for more effective and targeted treatment strategies.
Limitations
While our study provides a novel prognostic model for breast cancer, several limitations should be acknowledged: The retrospective nature of the TCGA data may introduce selection bias, requiring validation in prospective cohorts, and the computational predictions of our four-gene signature need experimental verification through in vitro/vivo studies. The model's performance across distinct breast cancer subtypes (e.g., luminal, HER2+, triple-negative) remains unstratified, potentially obscuring subtype-specific effects. Additionally, our immune microenvironment analysis was limited by bulk RNA-seq data's inability to capture spatial or single-cell interactions, while in silico drug sensitivity predictions may not fully reflect clinical responses. The model's generalizability may be constrained by the Western predominance in public datasets and its reliance on static baseline data rather than incorporating dynamic, longitudinal monitoring of treatment responses. These limitations highlight important directions for future refinement and validation of our prognostic model.
Supplemental Material
sj-docx-1-cbm-10.1177_18758592251357078 - Supplemental material for A risk model based on signature genes predicts prognosis and associates with tumor immunity, drug sensitivity in breast cancer
Supplemental material, sj-docx-1-cbm-10.1177_18758592251357078 for A risk model based on signature genes predicts prognosis and associates with tumor immunity, drug sensitivity in breast cancer by Yuan Li, Hao Li, Jichuan Quan, Ping Bi, Xuemei Liu, Yanwei Yao, Yanqin Peng, Congrui Wang, Xiaofang Gao, Junfang Duan, Xiaoru Wang and Jian Peng in Cancer Biomarkers
Supplemental Material
sj-jpg-2-cbm-10.1177_18758592251357078 - Supplemental material for A risk model based on signature genes predicts prognosis and associates with tumor immunity, drug sensitivity in breast cancer
Supplemental material, sj-jpg-2-cbm-10.1177_18758592251357078 for A risk model based on signature genes predicts prognosis and associates with tumor immunity, drug sensitivity in breast cancer by Yuan Li, Hao Li, Jichuan Quan, Ping Bi, Xuemei Liu, Yanwei Yao, Yanqin Peng, Congrui Wang, Xiaofang Gao, Junfang Duan, Xiaoru Wang and Jian Peng in Cancer Biomarkers
Supplemental Material
sj-jpg-3-cbm-10.1177_18758592251357078 - Supplemental material for A risk model based on signature genes predicts prognosis and associates with tumor immunity, drug sensitivity in breast cancer
Supplemental material, sj-jpg-3-cbm-10.1177_18758592251357078 for A risk model based on signature genes predicts prognosis and associates with tumor immunity, drug sensitivity in breast cancer by Yuan Li, Hao Li, Jichuan Quan, Ping Bi, Xuemei Liu, Yanwei Yao, Yanqin Peng, Congrui Wang, Xiaofang Gao, Junfang Duan, Xiaoru Wang and Jian Peng in Cancer Biomarkers
Supplemental Material
sj-jpg-4-cbm-10.1177_18758592251357078 - Supplemental material for A risk model based on signature genes predicts prognosis and associates with tumor immunity, drug sensitivity in breast cancer
Supplemental material, sj-jpg-4-cbm-10.1177_18758592251357078 for A risk model based on signature genes predicts prognosis and associates with tumor immunity, drug sensitivity in breast cancer by Yuan Li, Hao Li, Jichuan Quan, Ping Bi, Xuemei Liu, Yanwei Yao, Yanqin Peng, Congrui Wang, Xiaofang Gao, Junfang Duan, Xiaoru Wang and Jian Peng in Cancer Biomarkers
Supplemental Material
sj-jpg-5-cbm-10.1177_18758592251357078 - Supplemental material for A risk model based on signature genes predicts prognosis and associates with tumor immunity, drug sensitivity in breast cancer
Supplemental material, sj-jpg-5-cbm-10.1177_18758592251357078 for A risk model based on signature genes predicts prognosis and associates with tumor immunity, drug sensitivity in breast cancer by Yuan Li, Hao Li, Jichuan Quan, Ping Bi, Xuemei Liu, Yanwei Yao, Yanqin Peng, Congrui Wang, Xiaofang Gao, Junfang Duan, Xiaoru Wang and Jian Peng in Cancer Biomarkers
Supplemental Material
sj-jpg-6-cbm-10.1177_18758592251357078 - Supplemental material for A risk model based on signature genes predicts prognosis and associates with tumor immunity, drug sensitivity in breast cancer
Supplemental material, sj-jpg-6-cbm-10.1177_18758592251357078 for A risk model based on signature genes predicts prognosis and associates with tumor immunity, drug sensitivity in breast cancer by Yuan Li, Hao Li, Jichuan Quan, Ping Bi, Xuemei Liu, Yanwei Yao, Yanqin Peng, Congrui Wang, Xiaofang Gao, Junfang Duan, Xiaoru Wang and Jian Peng in Cancer Biomarkers
Footnotes
Abbreviations
Ethical considerations and consent to participate:
TCGA and GEO are public databases where the patients involved have obtained ethical approval. Users can freely download relevant data for research purposes and publish articles based on these data. Since our study relies on open-source data, there are no ethical concerns or conflicts of interest involved.
Consent for publication
The authors declare that they agree with the paper's content.
Author contributions
Y. Li, H. Li, J. Quan, P. Bi, and X. Liu performed the experiments, analyzed the data, and wrote the manuscript. Y. Yao, Y. Peng, C. Wang, and X. Gao collected the most bioinformatics data for this study. J. Peng, J. Duan, and X. Wang conceptualized the study, reviewed, and edited the manuscript. All authors have read and approved the final manuscript.
Funding
The authors disclosed receipt of the following financial support for the research, authorship, and/or publication of this article: The funding supported this study was received from the Research Project of the Health Commission of Shanxi Province (grant number 2022060).
Declaration of conflicting interests
The authors declared no potential conflicts of interest with respect to the research, authorship, and/or publication of this article.
Data availability statement
The datasets during and/or analyzed during the current study are available from the corresponding author upon reasonable request.
TCGA dataset: downloaded from UCSC Xena (https://xena.ucsc.edu/).
GEO dataset was downloaded from the NCBI GEO website (https://www.ncbi.nlm.nih.gov/geo/). HPA dataset: The immunohistochemical Figures were downloaded from HPA by searching the keywords “WT1”, “SHCBP1”, “TNFRSF18”, and “FOXJ1”.
Cohort
Gene expression
dataset ID
Survival
dataset ID
BRCA
TCGA-BRCA.htseq_
fpkm.tsv
TCGA-BRCA.
survival.tsv
Supplemental material
Supplemental material for this article is available online.
References
Supplementary Material
Please find the following supplemental material available below.
For Open Access articles published under a Creative Commons License, all supplemental material carries the same license as the article it is associated with.
For non-Open Access articles published, all supplemental material carries a non-exclusive license, and permission requests for re-use of supplemental material or any part of supplemental material shall be sent directly to the copyright owner as specified in the copyright notice associated with the article.