
Abstract
Breast cancer, the most common cancer in women, is characterized by cell cycle dysregulation and chromosome segregation errors, leading to mitotic catastrophe and genomic instability. Understanding these molecular mechanisms is crucial for better diagnosis and treatment. We used databases like TIMER 2.0, UALCAN, and Oncomine to determine the differential expression of Budding uninhibited by benzimidazole 1 (BUB1) in normal and pan-cancer tissues. we also used the Kaplan-Meier Plotter database to analyze gene expression associations with survival outcomes, bc-GenExMiner v5.0 to analyze BUB1 gene expression and histological subtypes, and ctcRbase and miR-TV to identify microRNAs associated with BUB1 expression in breast cancer. Our data show that BUB1 expression is overexpressed in breast cancer tumors, metastatic tissues, and circulating tumor cells, leading to
Highlights
Elevated BUB1 overexpression is observed in triple-negative breast cancer tissue, along with high E2F1/E2F8 transcription factor expression and low miR-495-3p expression.
BUB1 expression and breast cancer progression are strongly correlated with E2F1/E2F8 transcription factors.
There is a significant reduction in survival outcome for breast cancer patients with hsa-mir-495-3p downregulation and upregulation of BUB1 expression and elevated E2F1/E2F8 expression.
Tumor microenvironment CD4+ Th2 cell infiltration correlates with BUB1 and E2F1/E2F8 expression
It is possible that BUB1 could be a new therapeutic target for the treatment of TNBC.
Introduction
Breast cancer is the most common malignancy and the leading cause of cancer-associated deaths in women. 1 Based on histological biomarkers, breast cancer is classified into four subtypes: luminal A, luminal B, HER2-positive, and triple-negative breast cancer (TNBC).2–4 Despite advances in diagnosis and treatment, the prognosis of TNBC patients remains poor. Improving the prognosis of TNBC patients warrants the development of more sensitive and specific cancer biomarkers and targeted therapeutics. Furthermore, understanding the molecular mechanism of breast cancer may help in the stratification of patients and the development of more effective targeted therapies. Aberrations in the cell cycle are a hallmark of cancer. Accurate chromosome segregation is essential for proper alignment and attachment to microtubules 5 ; any error in this process can lead to mitotic catastrophe. Budding uninhibited by benzimidazole (BuB) family members are serine/threonine spindle checkpoint kinases. 6 BuB1 and Bub3 are required for chromosome segregation and the establishment and maintenance of bipolar attachments to spindle microtubules. 7 Several studies have demonstrated that BUB1 is one of the potential oncogenes and is overexpressed in a variety of human cancers, including breast cancer.8–10 BUB1 overexpression is associated with chromosomal instability, aneuploidy in breast cancer, and a poor prognosis.11,12 MicroRNAs (miRNAs) are small, non-coding RNA molecules that serve as crucial regulators of post-transcriptional gene expression across a diverse array of biological processes. 13 Typically, miRNAs negatively regulate the expression of the target gene by selectively binding to mRNAs, thereby instigating either the degradation of the mRNA or the repression of its translation. 14 Anomalous expression patterns of these miRNAs have been causally associated with breast cancer. 15 The tumor immune microenvironment (TIME) acts as a double-edged sword and has been shown to be involved in immunosurveillance as well as tumor progression. 16 Depending on the tumor microenvironment, CD4+ T-cells can differentiate into Th1 or Th2 helper T-cells. Th2 subtypes are known to promote tumor progression through the secretion of various cytokines that activate tumor-associated M2 macrophages, whereas Th1 subtypes induce tumor regression. 17 The mechanism by which BUB1 expression is dysregulated in TNBC is not understood. E2F1 controls the expression of multiple mitotic checkpoint factors. 18 Therefore, in the present in silico study, we have investigated the prognostic role and regulatory network of BUB1 in breast cancer. We first assessed BUB1 expression patterns in pan-cancer, including breast cancer, using data mining. Then, we investigated the prognostic significance of BUB1 expression in breast cancer. Finally, we explored possible mechanisms of BUB1 dysregulation in breast cancer, including the development and analysis of the BUB1 enrichment network and its association with infiltrating immune cells. We demonstrate that BUB1 is overexpressed in primary tumors from breast cancer patients. Its expression might be regulated by E2F1/E2F8 transcription factors and miR-495-3p. Elevated expression of BUB1 and E2F1/E2F8 and decreased levels of miR-495-3p are associated with a poor prognosis in breast cancer patients. We also show that the BUB1-E2F1/E2F8-miR-495-3p network may also contribute to the infiltration of Th2 into the tumor microenvironment. Thus, targeting BUB1 could be a promising therapeutic strategy for breast cancer.
Materials and methods
In silico expression analysis
Gene expression in pan-cancer and breast cancer patients was studied using the UALCAN, 19 the TIMER 2.0, 20 and the Oncomine databases. 21 In addition, differential BUB1 mRNA expression patterns in breast cancer patients were analyzed by the UALCAN using TCGA feature. The gene of interest was entered in the search window, and “Breast Invasive Carcinoma” was selected as the TCGA dataset. Images and statistical analysis were downloaded. Similarly, OncoDB, 22 the GEPIA2, 23 and the ENCORI 24 databases were used for differential expression analysis. Further, Gene-Expression Miner v5.0 was used to examine BUB1 expression levels in patients with different clinicopathological characteristics such as age, tumor-node-metastasis (TNM) stage, hormone receptor status (ER, PR, and HER2), and TNBC pathological subtypes. 25 The association of BUB1 expression levels with clinicopathological features of patients, such as age, nodal status, hormonal receptor status (ER and PR), HER2, and TNBC pathological subtypes, and metastasis, was analyzed using the DriverDBv3, 26 the TNMplot, 27 and the ctcRbase databases. 28 Flow Chart is given Supplementary Figure S1.
Survival analysis
Survival analysis was performed on breast cancer datasets using Kaplan-Meier Plotter. 20 The screening conditions were as follows: “Cancer: Breast Cancer”; “Gene symbol: BUB1”; “Affy id: 209642_at”; Survival: relapse-free survival (RFS), overall survival (OS), and distant metastases-free survival (DMFS), and split patients by median and JetSet-best probe. The inclusion criteria for the data was hazard ratio >1.4 and P value <0.001.
Functional heterogeneity analysis
CancerSEA was used to assess the diverse functional states of cancer cells at the single-cell level. 25 The CancerSEA web-based platform illustrates an atlas of single-cell functional states related to cancer, encompassing 14 distinct functional states including cell cycle, proliferation, DNA damage, DNA repair, apoptosis, differentiation, stemness, invasion, metastasis, EMT, angiogenesis, hypoxia, inflammation, and quiescence. The CancerSEA was also used to analyze the association of BUB1 gene expression with different biological processes.
Tumor-Infiltrating immune cells (TIICs) analysis
TISIDB 29 and TIMER 2.0 are interactive web applications that analyze tumor-immune cells using publicly available TCGA data. TIMER and TISIDB were used to correlate the BUB1 expression with TIICs (M1 macrophages, M2 macrophages, M0 macrophages, T follicular helper cells, naive CD4+ T cells, activated memory CD4+ T cells, resting memory CD4+ T cells, γδ T cells, regulatory T cells, CD8+ T cells, activated NK cells, resting NK cells, activated dendritic cells, resting dendritic cells, activated mast cells, resting mast cells, naive B cells, memory B cells, monocytes, neutrophils, eosinophils, and plasma cells) in different breast cancer subtypes. The Spearman correlation was adjusted using tumor purity.14,26 P-values of <0.05 or less are considered statistically significant.
Transcriptional factor correlation analysis
The association between the BUB1 gene and the E2F family transcriptional factors was examined using multiple databases, namely TIMER 2.0, GEPIA2, ENCORI, UALCAN, and bc-GenExMiner v5.0.
Co-expressed functional enrichment analysis
The Enrichr database 30 was used to identify BUB1 co-expressed genes, and the GSCALite database was further utilized to validate the co-expressed genes in breast cancer.27,28 Finally, the BUB1 gene ontology was analyzed using the TISIDB database. Furthermore, we used TNMplot to assess the co-expressed genes for metastatic function, and then we used TIMER 2.0 to investigate the relationship of the BUB1 gene with the co-expressed genes.
Transcriptional factor -microRNA- regulatory network
We utilized ctcRbase datasets GSE55807, GSE41245, and GSE75367 to identify miRNAs targeting the BUB1 gene. Then the validation was performed using miRNA Cancer MAP, 31 mirTarBase, 32 and mirTV. 33 Furthermore, UALCAN and KM plotter were used to evaluate the prognostic significance of BUB1-associated miRNAs.
Statistical analysis
The difference in BUB1 gene expression between tumor and normal tissue was analyzed by t-test. The relationship between BUB1 gene expression and prognosis was analyzed by online database models. The survival rate between the two groups was compared by the Log-Rank test. The test significance level was P < 0.05. The data used were analyzed by online database-based statistical analysis.
Results
BUB1 expression in human breast cancer: a pan-cancer approach
First, we analyzed the expression of BUB1 in different cancer types. Multiple databases were utilized to assess the pan-cancer differential expression between the tumor and corresponding normal tissues. The results demonstrated that BUB1 expression levels were significantly higher in tumor tissues in most malignancies compared to normal tissues (Figure 1A–C and Supplementary Table 1). Importantly, TCGA analysis by UALCAN and OncoDB showed that BUB1 gene expression was significantly elevated in tumors from breast cancer patients compared to normal tissues (Figure 2A–B). As shown in Figure 2A-B, UALCAN and OncoDB analyses showed an average nine-fold upregulation in tumors from breast cancer (p = <1e-12). The findings were validated using ENCORI (Figure 2C; P = 7.9 e-118) and GEPIA2 (Figure 2D; P < 0.05), revealing a consistent pattern of overexpression in breast cancer patients. As BUB1 expression was found to be elevated in the tumor tissues, we explored its prognostic role in breast cancer patients. The KM Plotter database was used to compare the survival outcomes of patients with high and low BUB1 expression levels. As shown in Figure 2E-G, patients with high BUB1 expression had a poor prognosis in breast cancer patients, with significant association with RFS (HR = 1.74, 95% CI: 1.57–1.93, P = 1e-16) (Figure 2E), overall survival (OS) (HR = 1.48, 95% CI: 1.22–1.79, P = 4.5e-05) (Figure 2F), and distant metastasis-free survival (DMFS) (HR = 1.73, 95% CI: 1.48–2.03, P = 3.7e-12) (Figure 2G). The survival analysis was performed using the KM plotter on patients with or without endocrine therapy treatment. The results showed that the patients receiving endocrine therapy, the low expression cohort and high expression cohort had the OS of 118 and 53.1 months, respectively (Supplementary Table 2). However, the patients who did not receive any therapy, the overall survival was less. Low expression cohort and high expression cohort had the OS of 71 and 30 months, respectively (Supplementary Table 2). However, in both cases, the hazard ratio was found >1.5. Similarly, the patients who received tamoxifen, the low expression cohort and high expression cohort had OS of 139.5 and 68.2, respectively, with a hazard ratio of 1.97 (Supplementary Table 2). The overall data suggests that BUB1 is a poor prognostic biomarker in breast cancer and its overexpression is associated with worse survival outcome irrespective of the treatment given or not and hence, there is a significant need for the direct inhibitors of BUB1.
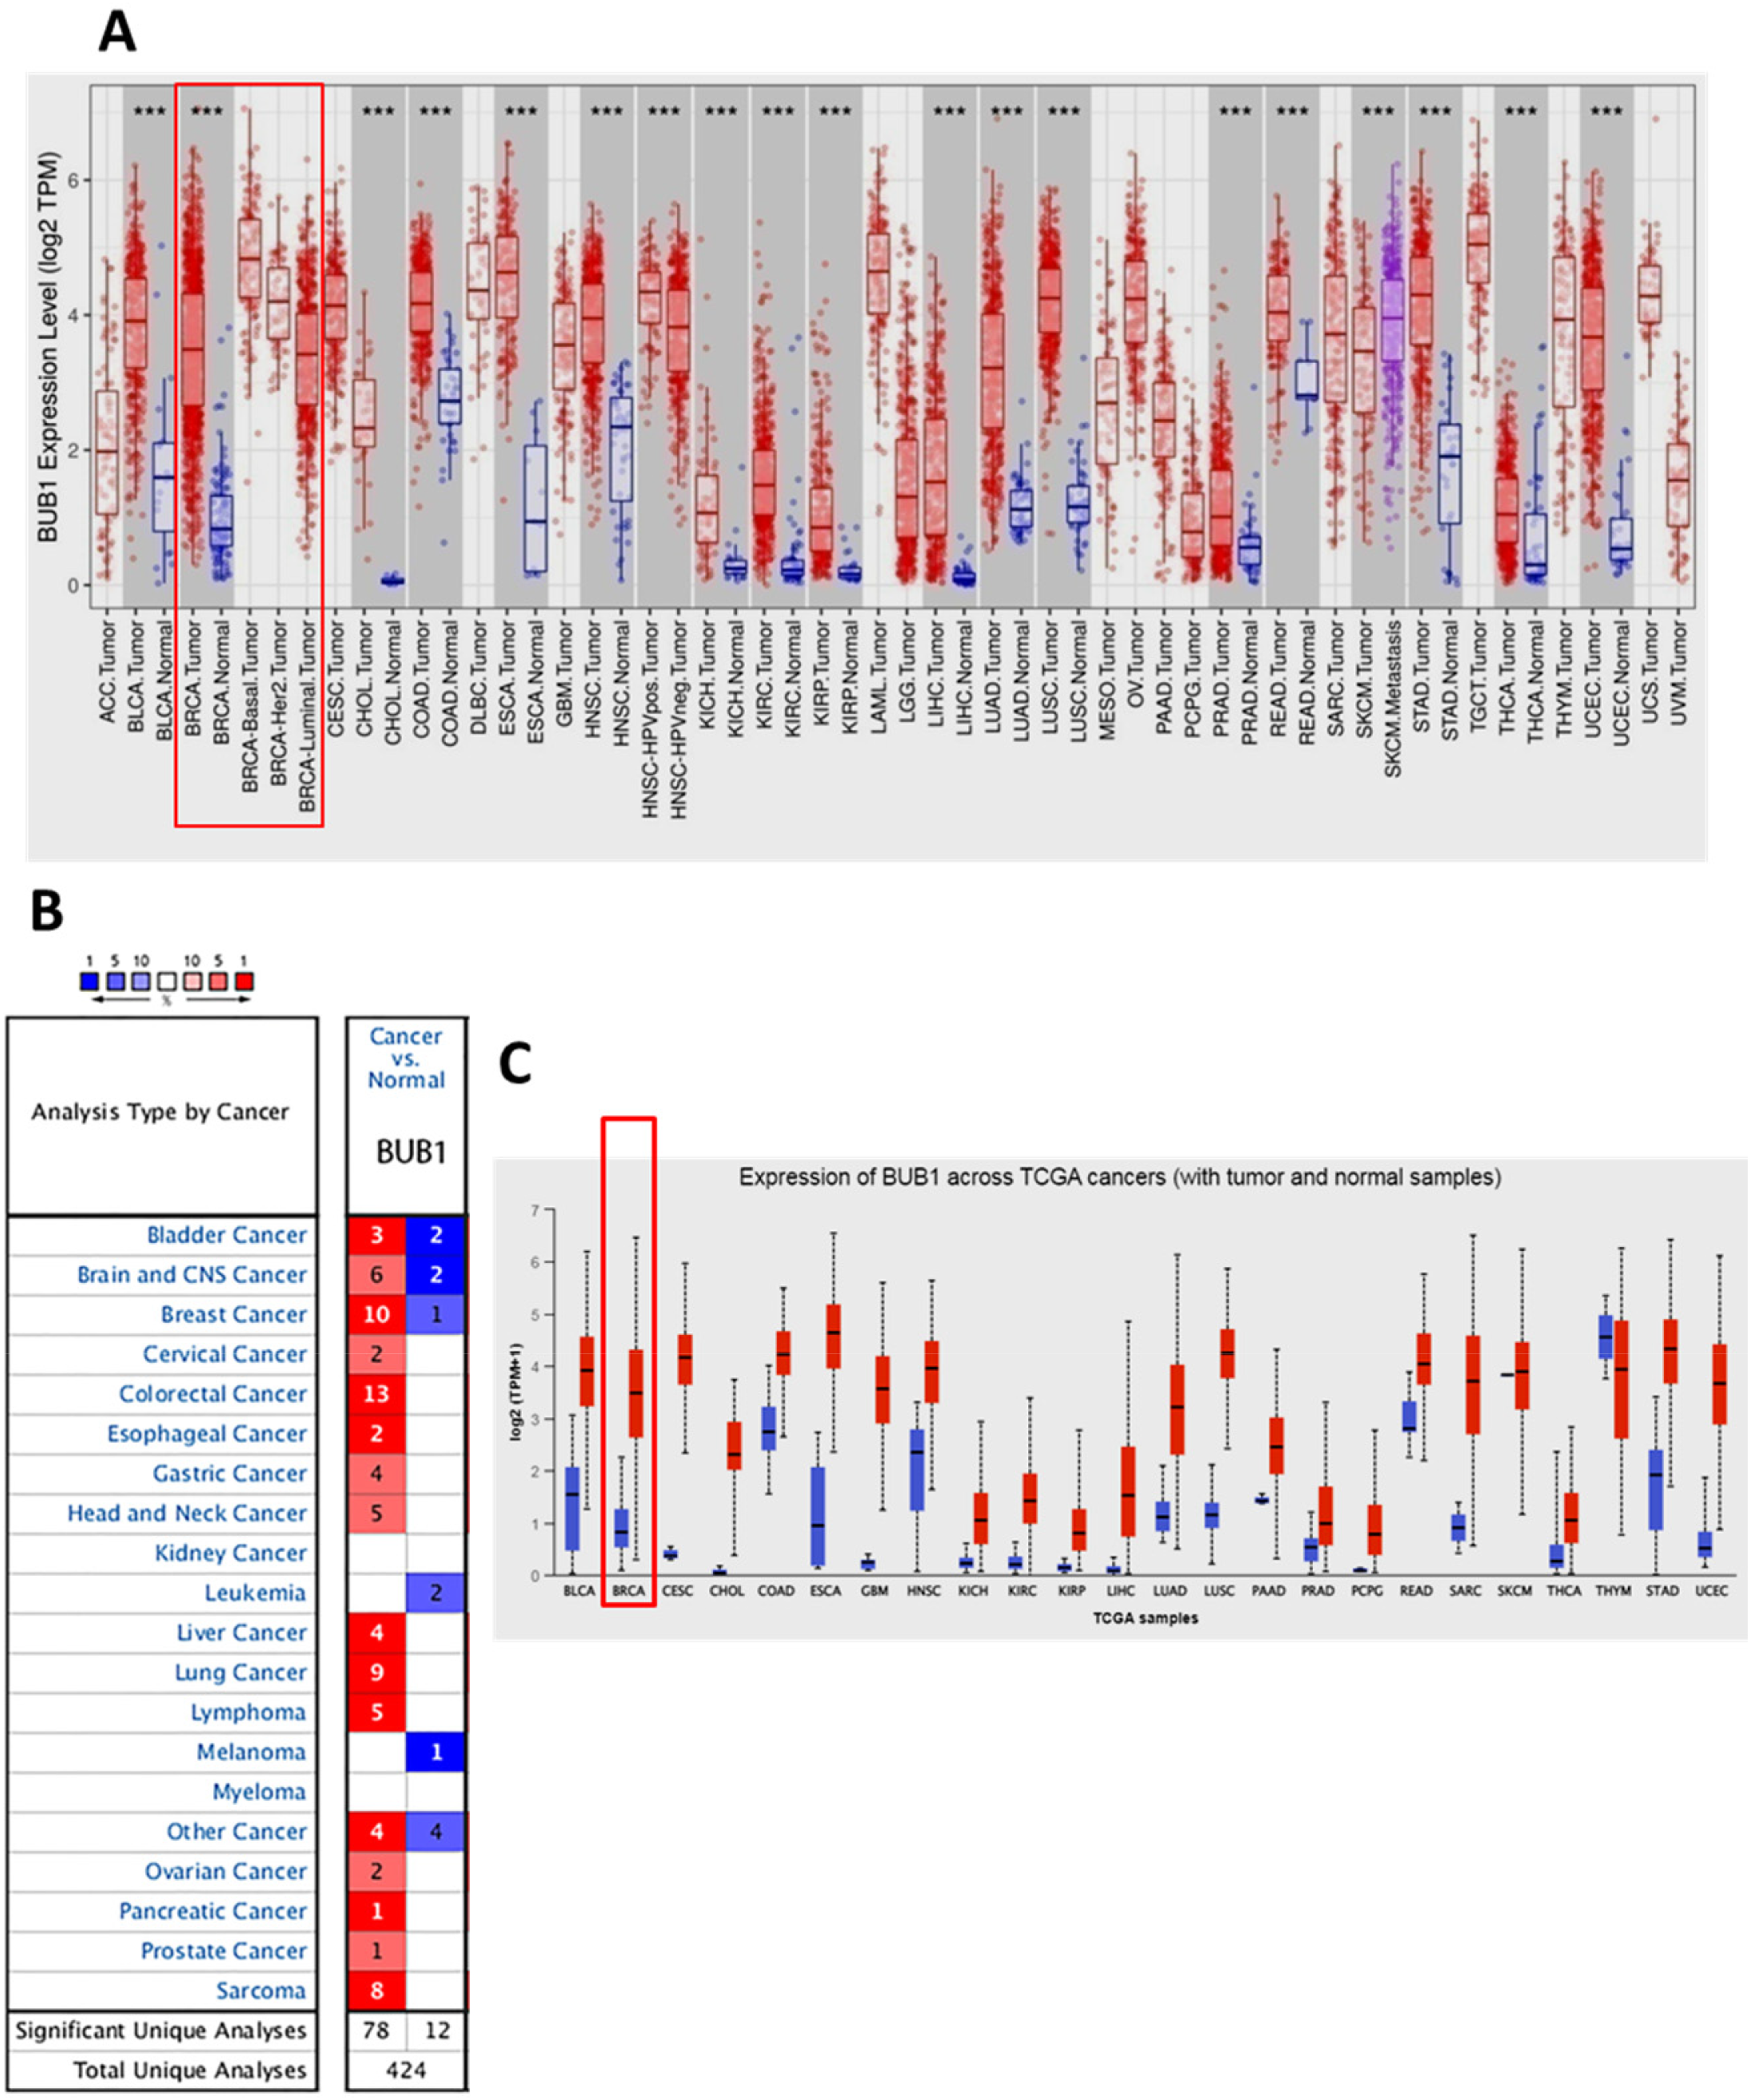
Expression Pattern of BUB1 in Pan-Cancer
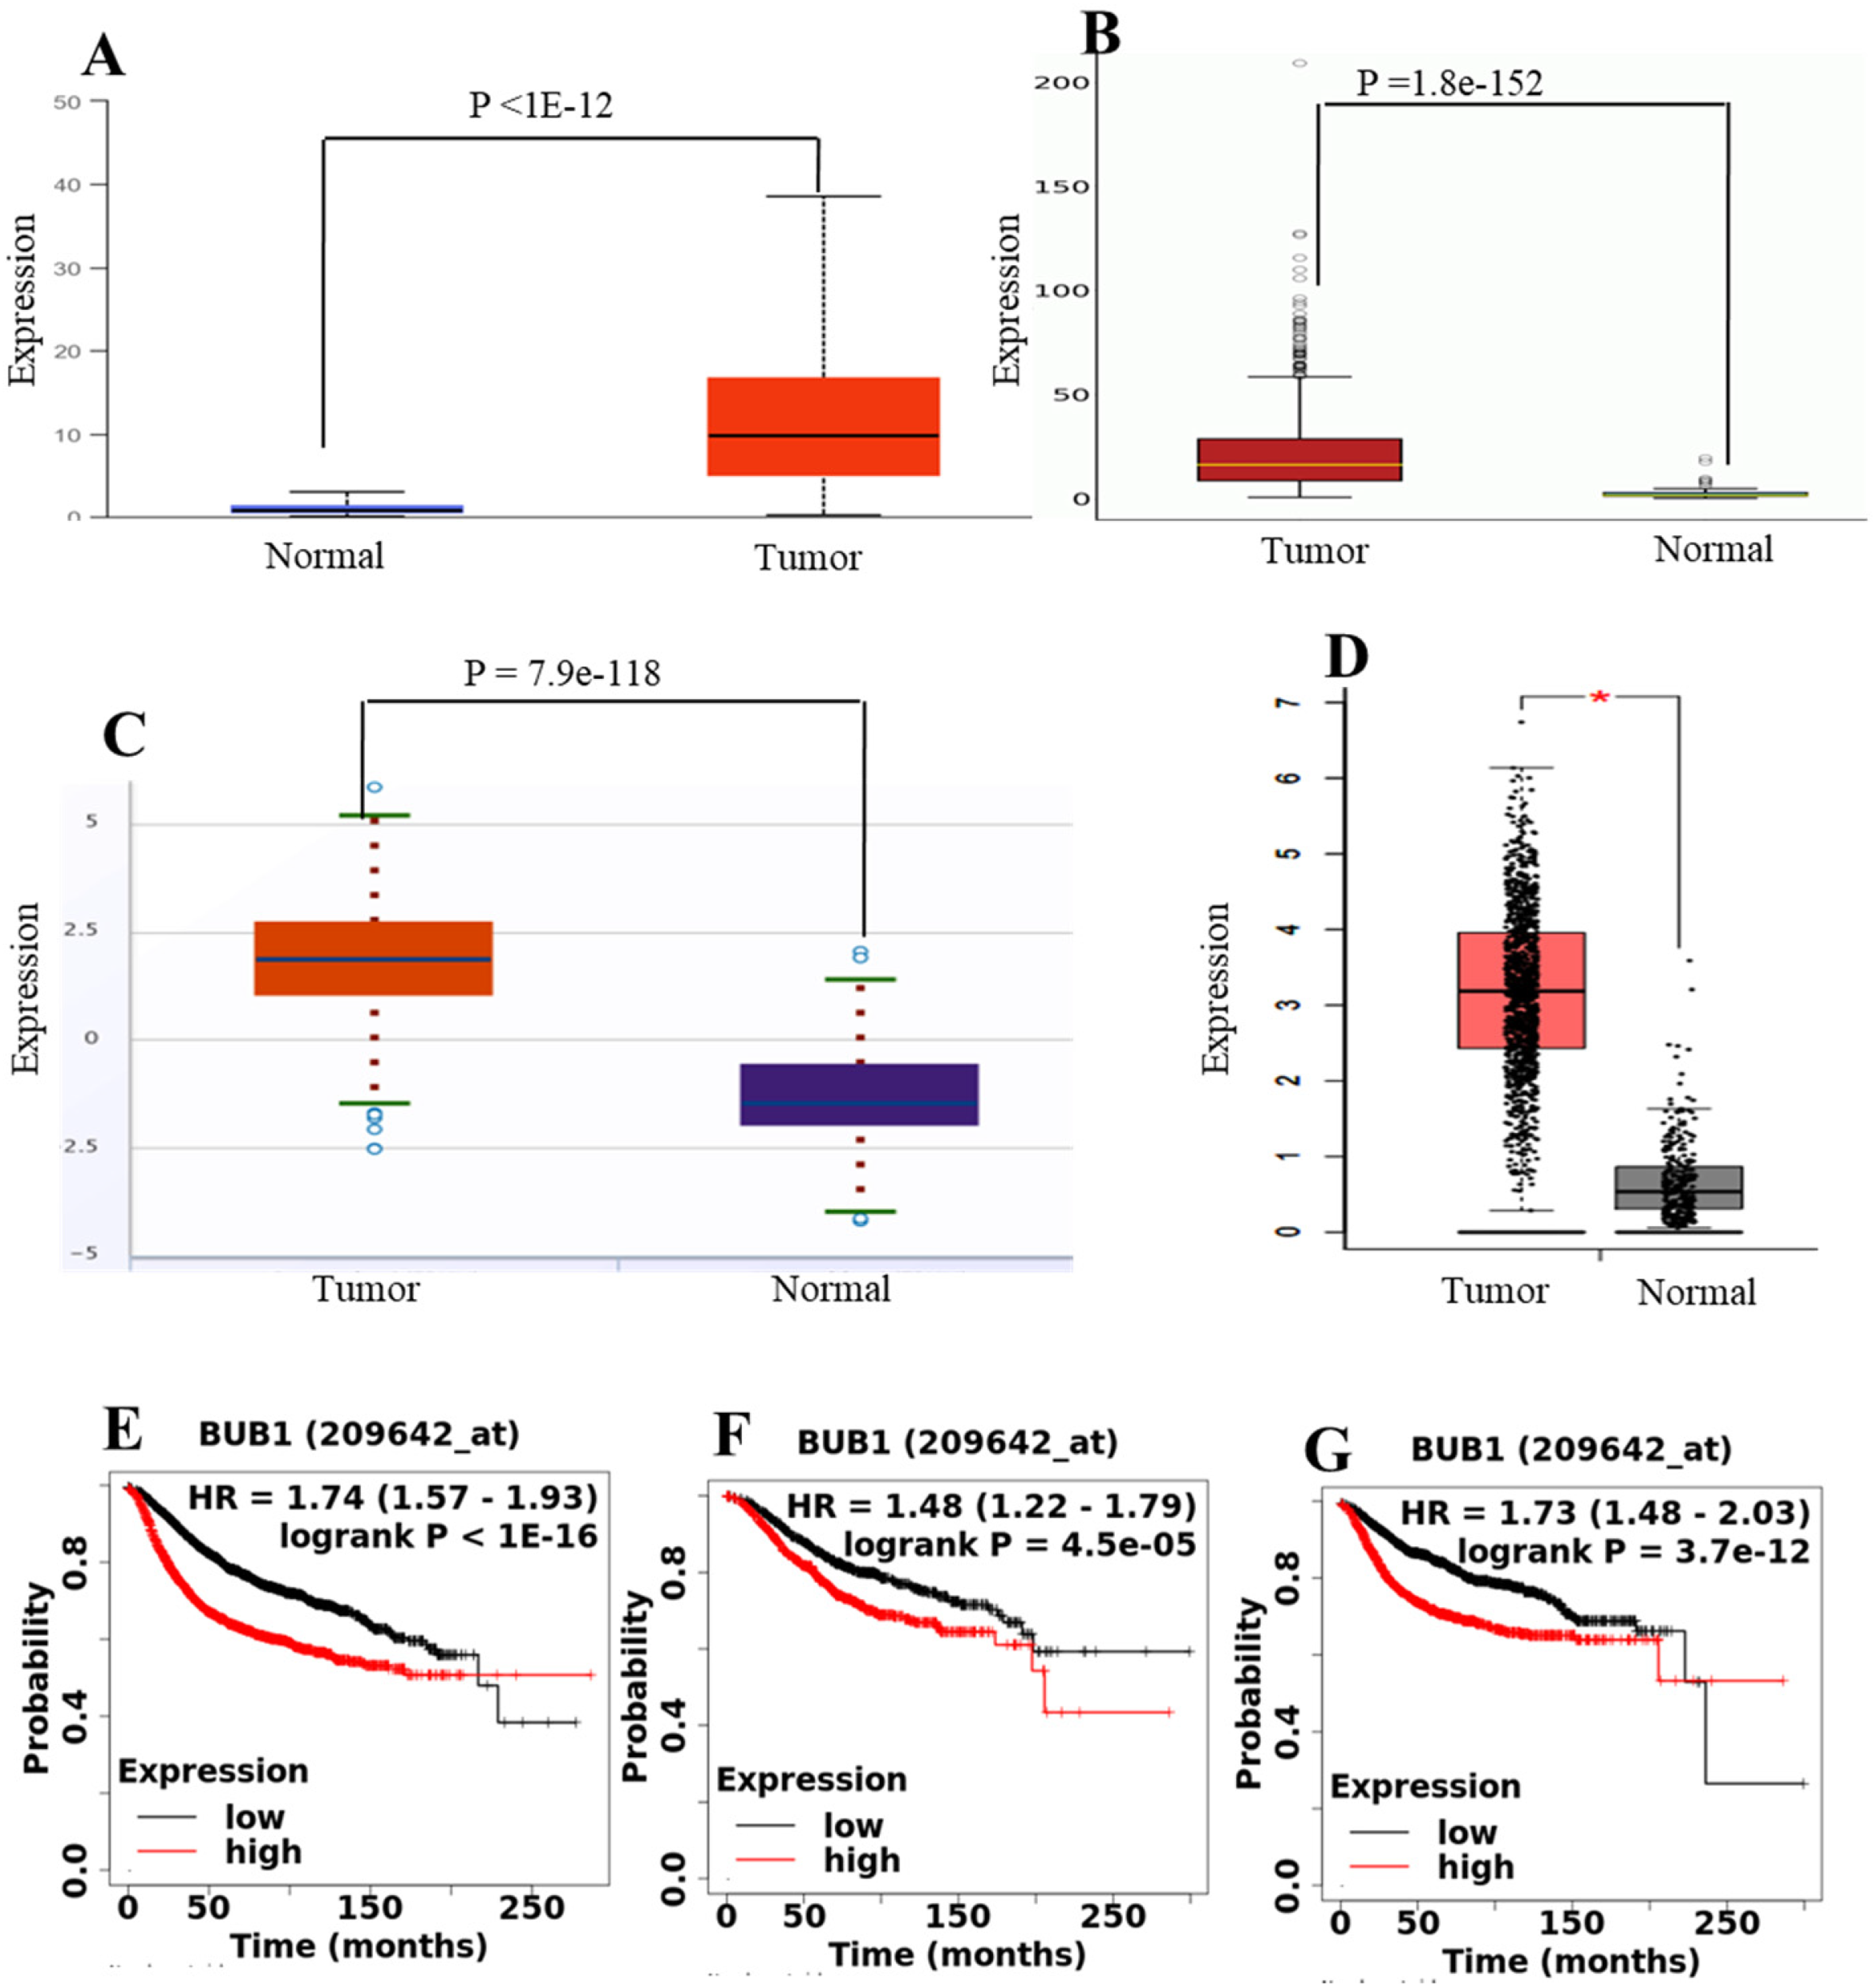
Expression of BUB1 in Breast Cancer
BUB1 expression in major subclasses of breast cancer
Then, we asked whether the BUB1 expression was associated with specific histological subtypes of breast cancer. The BUB1 expression was analyzed in the different histological subtypes, as well as its impact on metastasis, using the bc-GenExMiner 5.0 database. As shown in Figure 3A-D, hormone receptor-negative tumor subtypes showed significantly elevated expression of BUB1 compared to hormone receptor-positive subtypes. BUB1 expression was significantly different between ER + versus ER- (p = 0.0001), PR + versus PR- (p = 0.0001), ER-/PR-versus ER+/PR+, ER+/PR- and ER-/PR + (p = 0.0001), and HER2 + versus HER2- (p = 0.0001). Furthermore, we compared the BUB1 expression between non-basal-like versus basal-like and non-TNBC versus TNBC. As shown in Figure 3E-F, BUB1 expression was significantly high (p = 0.0001) in basal-like and TNBC subtypes compared to their corresponding non-basal-like and non-TNBC subtypes. Further, we validated bc-GenExMiner data with UALCAN, and we found that higher BUB1 expression was significantly correlated with aggressive types of breast cancer, Normal versus Luminal (P < 1E-12), Normal versus HER2+ (P = 1.9e-12), Normal versus TNBC (P < 1E-12), Luminal versus HER2+ (P = 1.0e-03), Luminal versus TNBC (P = 1.6e-12), and HER2 + versus TNBC (P = 2.9e-06) (Figure 3G-H). To further understand the role of BUB1 in breast cancer, the patients were stratified according to major subtypes, status of mutation in TP53 gene, age groups and race. As shown in Supplementary Figure S2, BUB1 expression varied among the subclasses of breast cancer, TNBC showed the highest expression, compared to the luminal and HER2 + subtypes (Supplementary Figure S2A). Importantly, the patients with mutation in TP53 gene showed the high expression of BUB1 gene, compared to the patients with TP53 wild type (Supplementary Figure S2B), suggesting that BUB1 expression may be regulated through p53-dependent pathway. Furthermore, among breast cancer patients, younger patients (21–40 Yrs age group) had the highest expression of BUB1 and its expression decreased with age of the patients. However, even the tumors from older patients had significantly higher expression of BUB1, compared to normal breast (Supplementary Figure S2C), suggesting that BUB1 plays a crucial role in tumorigenesis. Moreover, the expression of BUB1 varied according to the race of the patients, the Asian had significantly high BUB1 expression, compared to Caucasian (Supplementary Figure S2D). Finally, RNA-Seq data analysis performed with Gene Chip showed that tumor tissues from breast cancer patients with metastasis also showed significantly high expression of BUB1 (P = 4.4e-100 for Gene Chip and P = 4.3e-57 for DriverDBv4) compared to normal breast tissue (Figure 4A-D). Furthermore, tumor tissue that metastasized to a secondary location also exhibited significantly higher levels of BUB1 expression (P = 0.00038) than normal tissue. Importantly, as shown in Figure 4D, BUB1 gene expression was also found to be considerably elevated in circulating tumor cells (CTC).
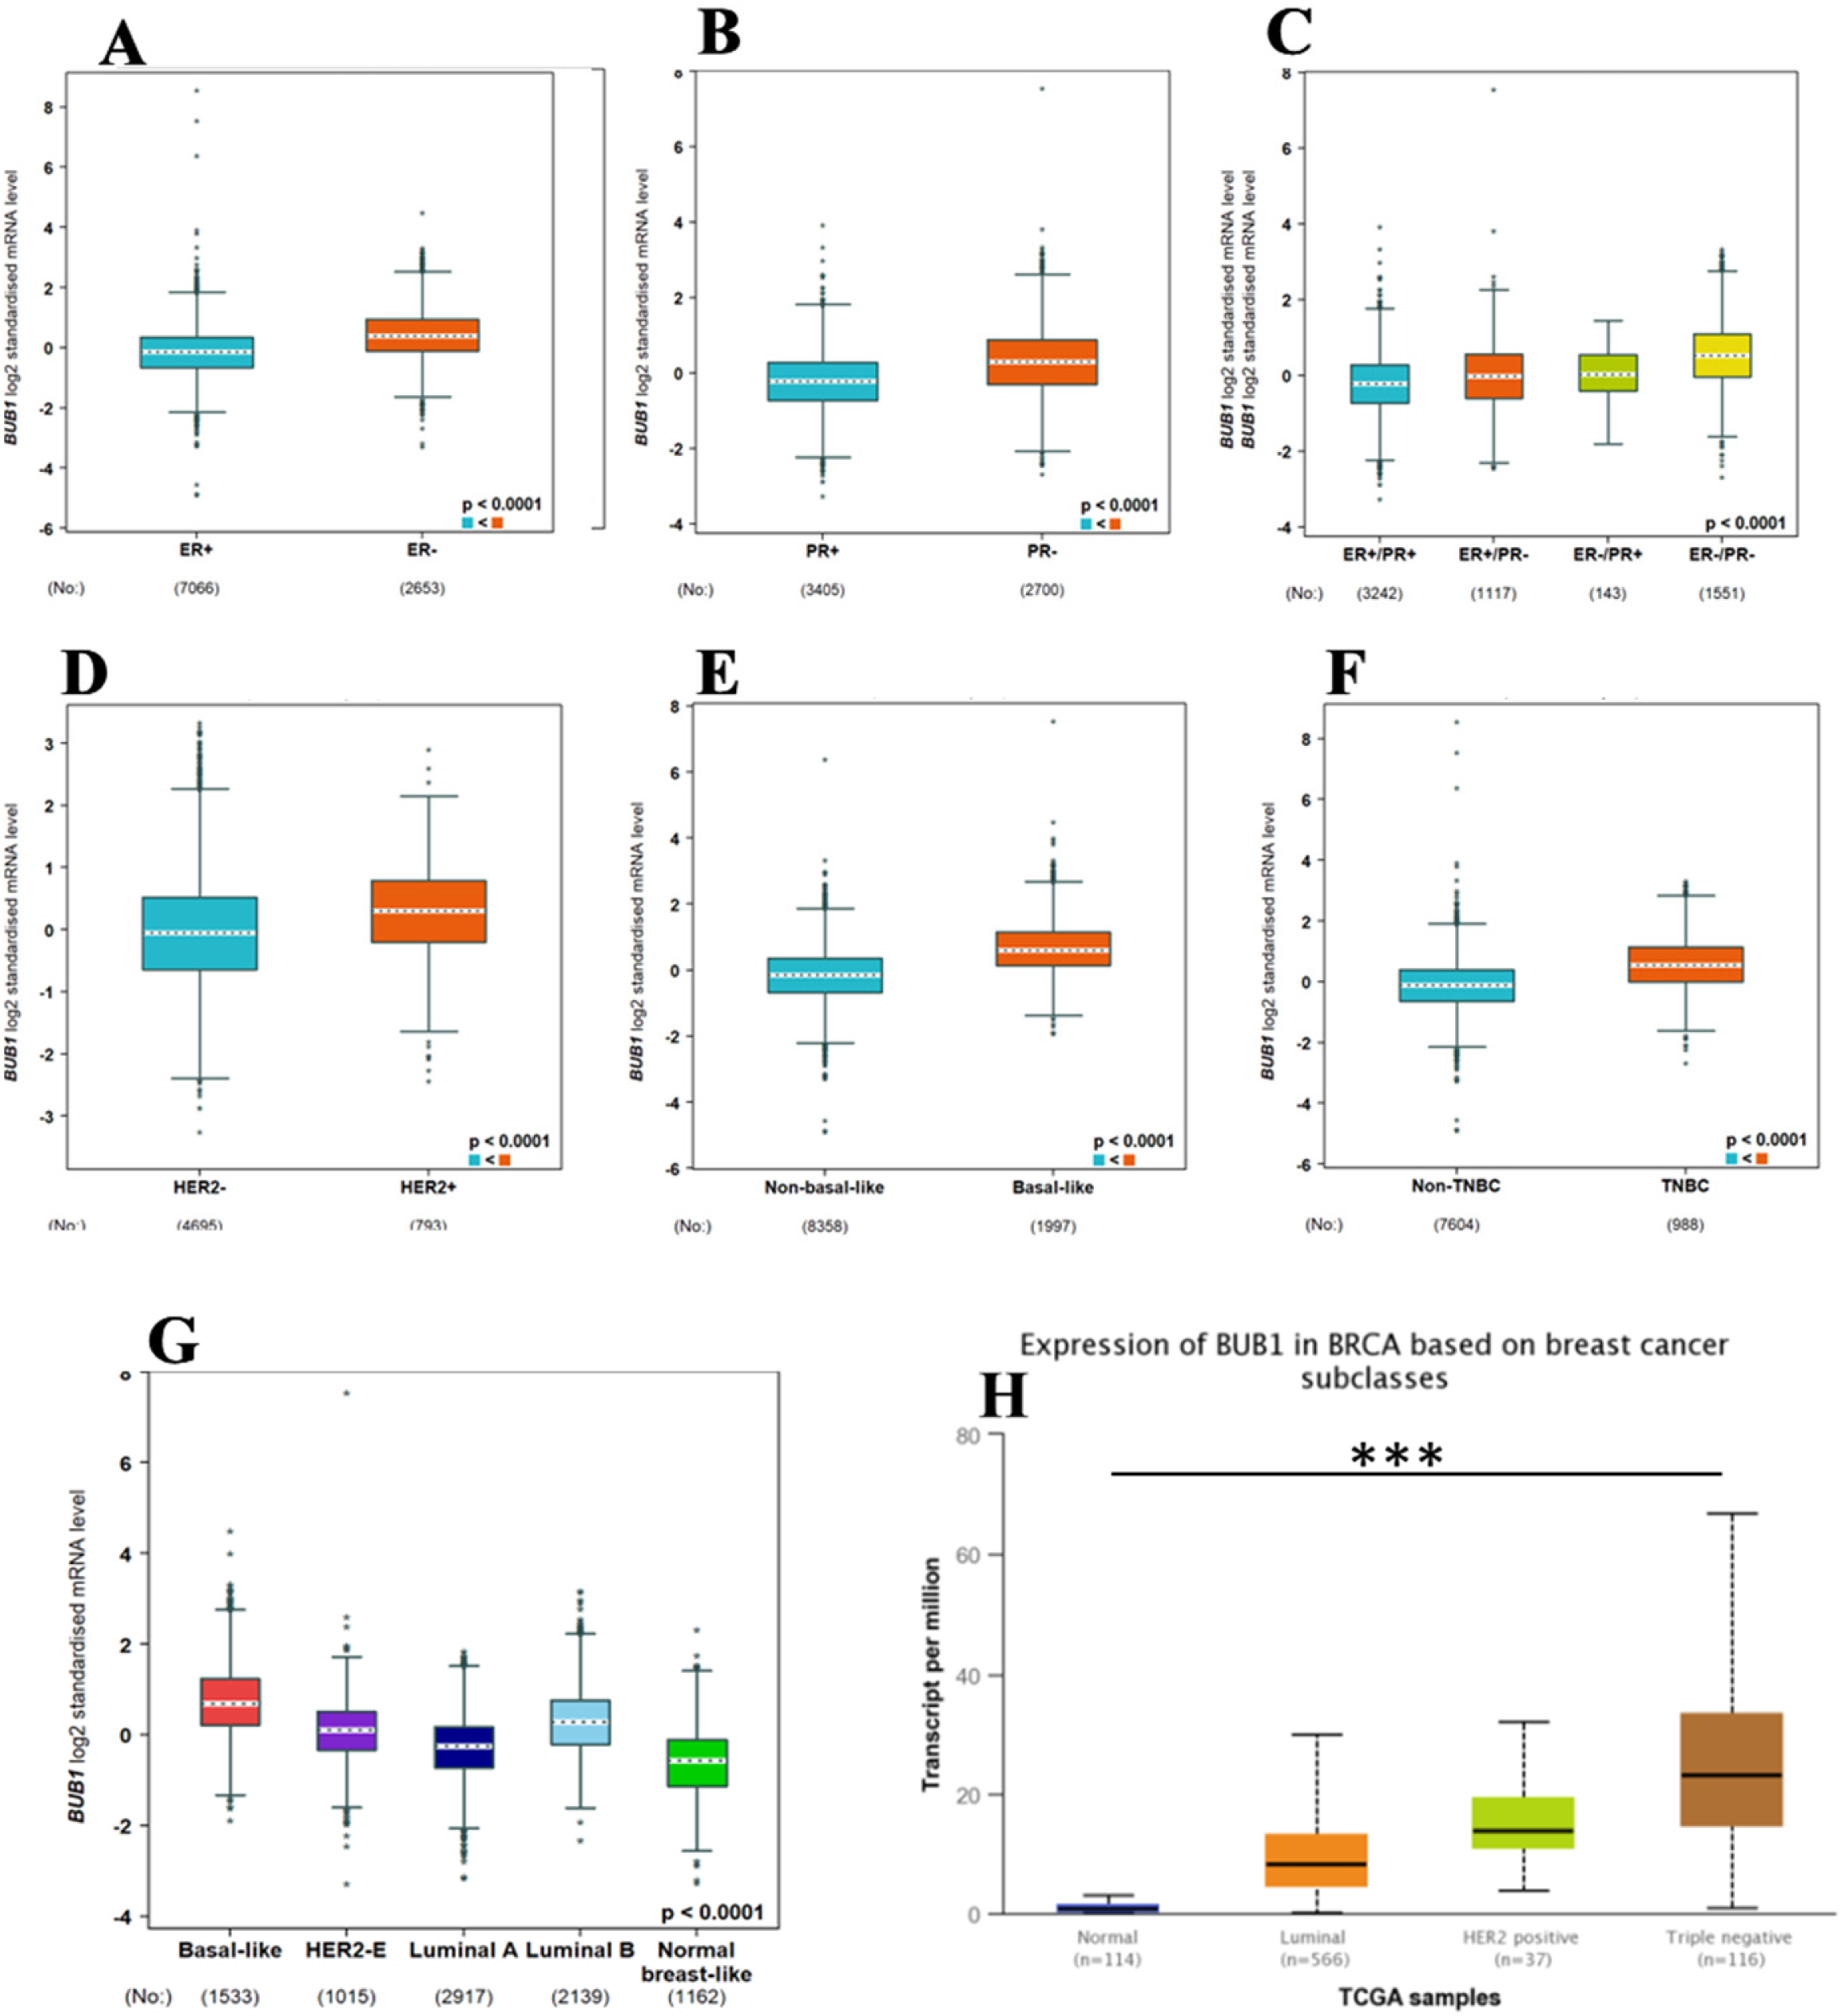
BUB1 expression in tumor tissues from breast cancer patients with various clinicopathological features determined by the bc-GenExMiner database. Boxplot of BUB1 expression in tumor tissues from breast cancer patients with PR positivity status
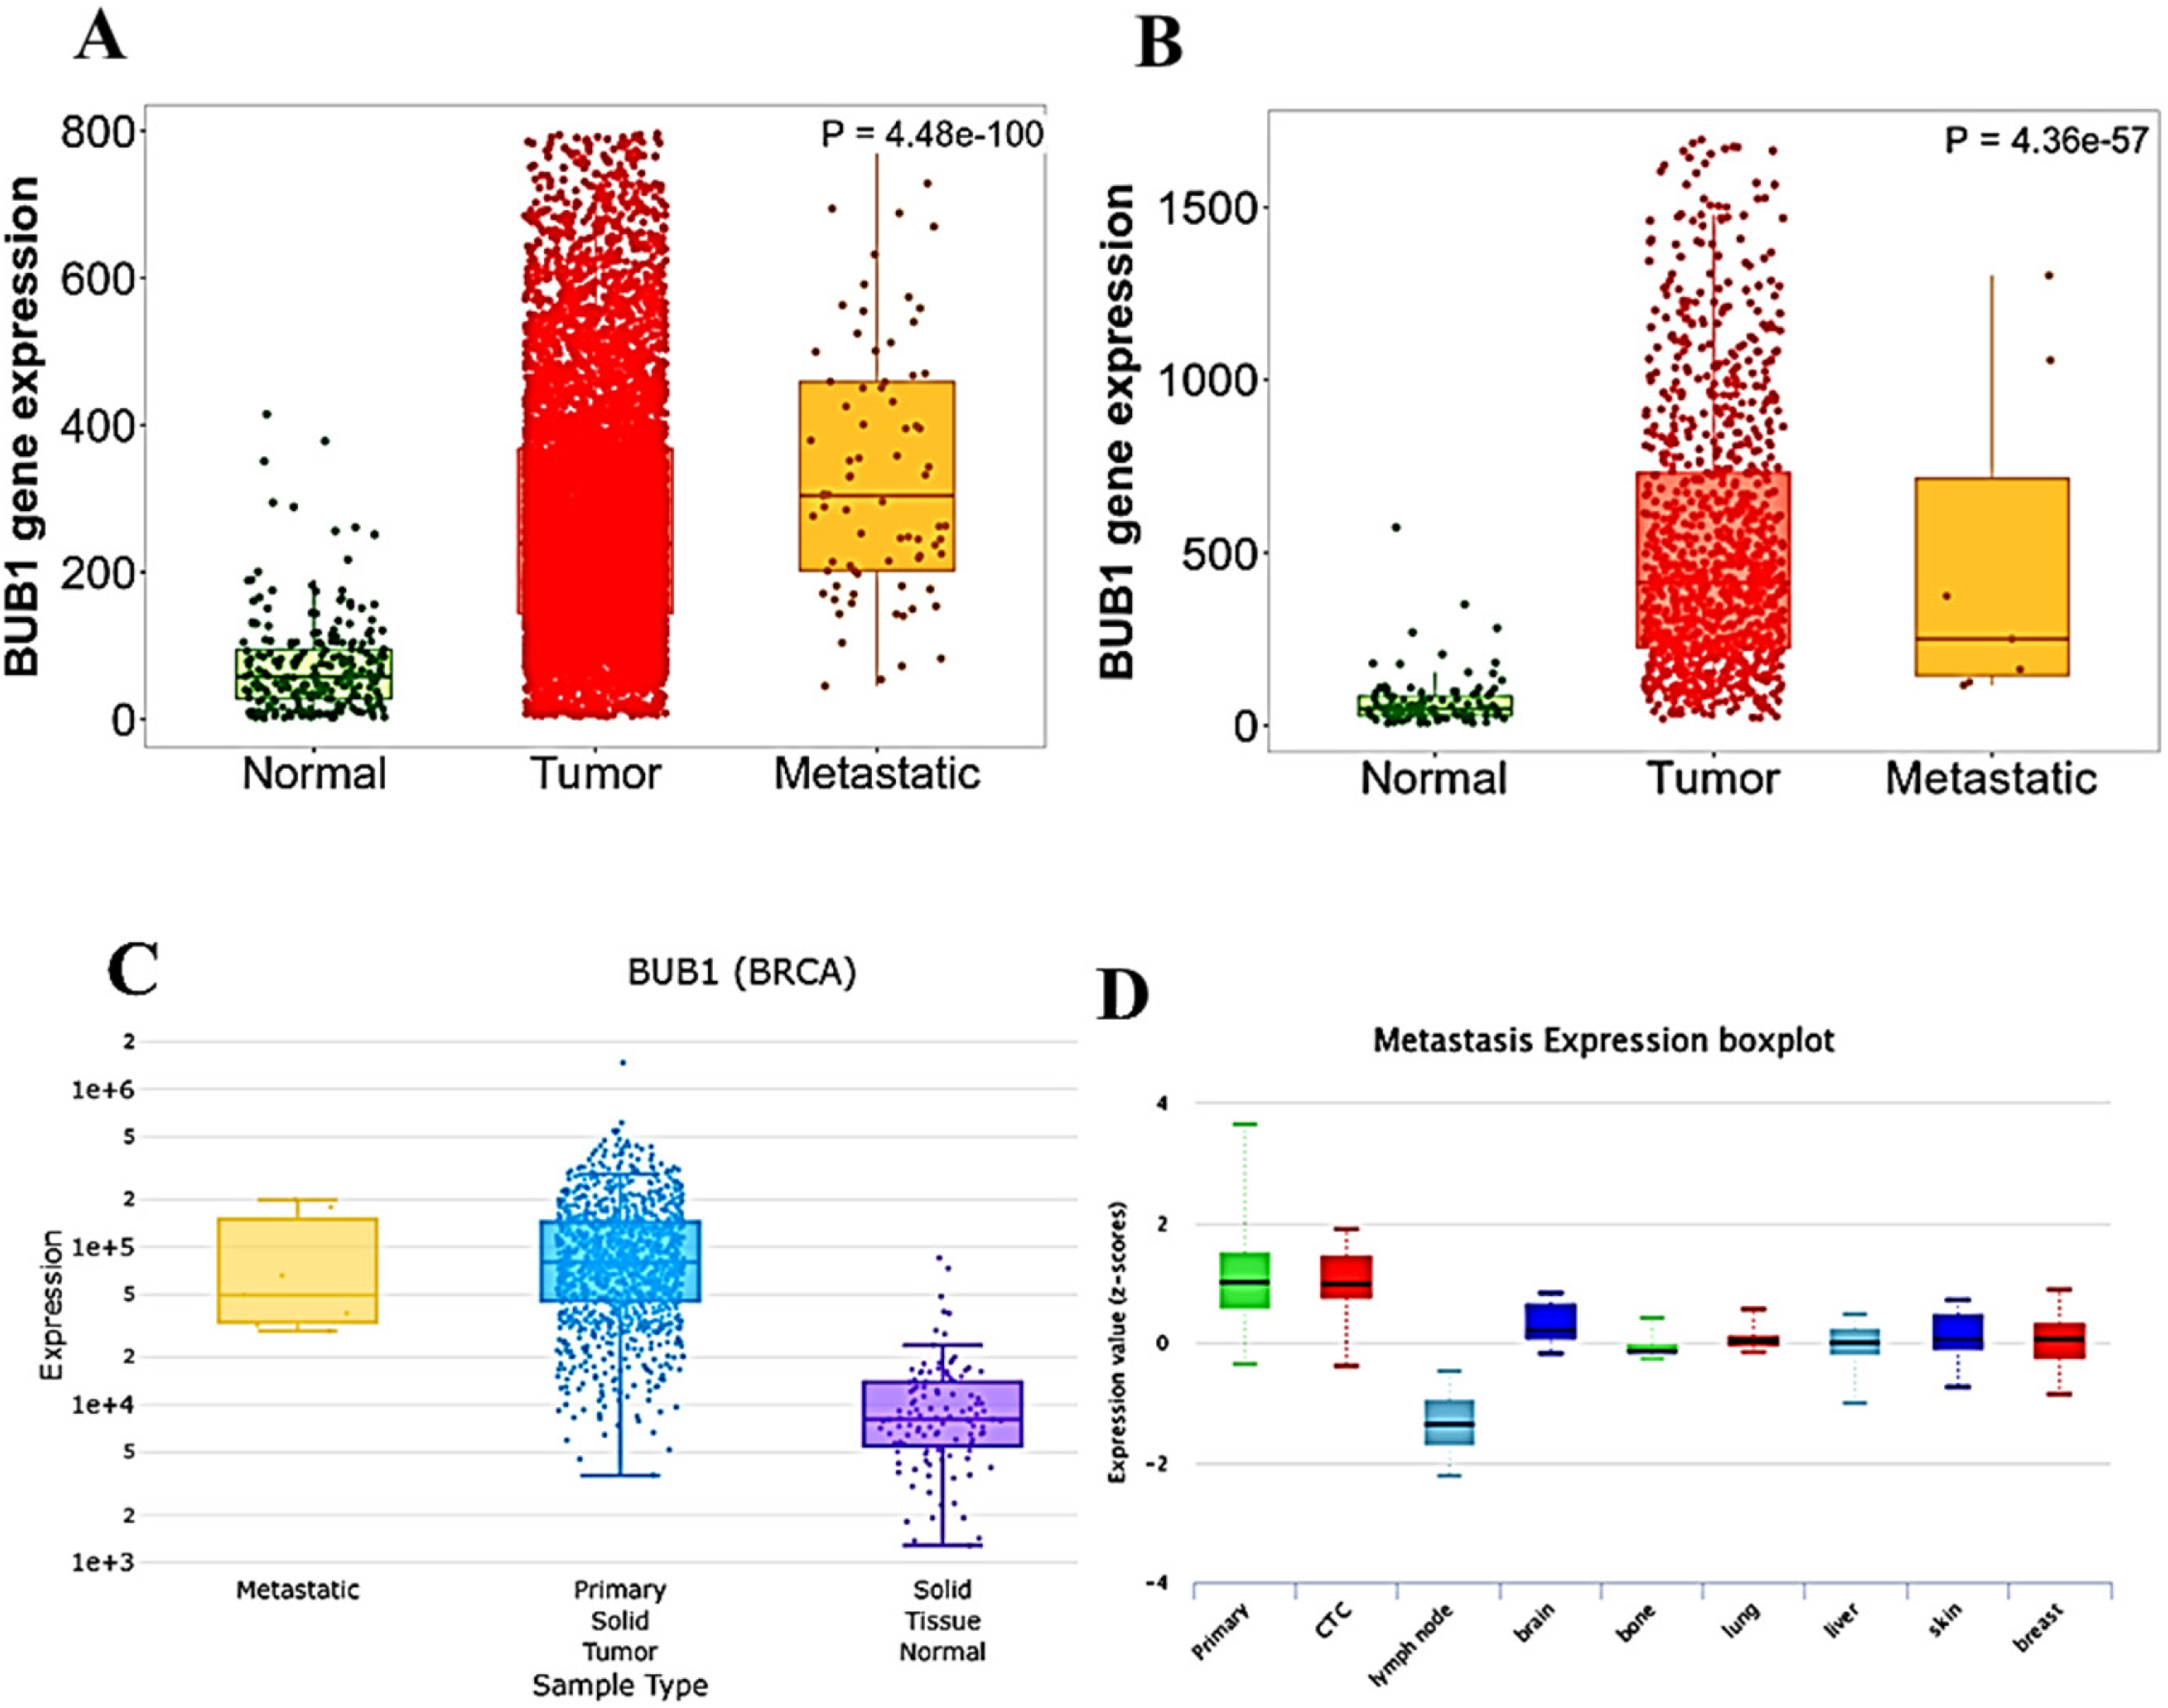
BUB1 expression in tumors from breast cancer patients with metastasis
Co-expressed genes of BUB1 and functional enrichment analysis
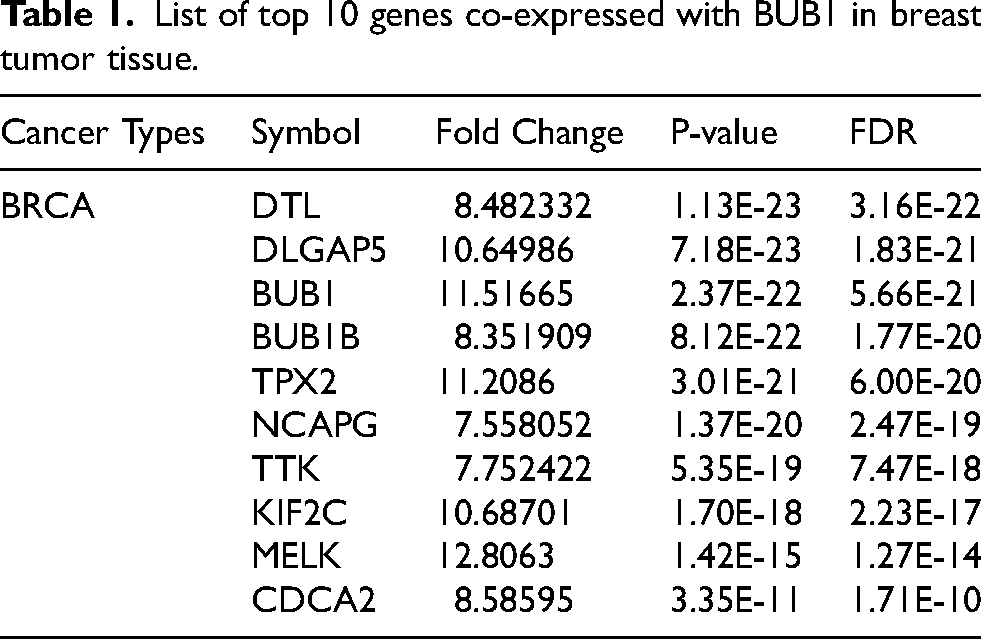
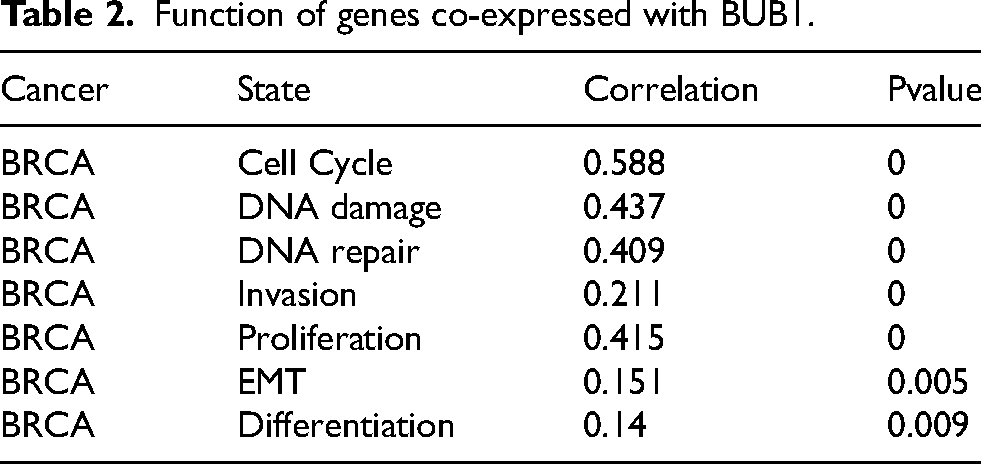
To understand the role of BUB1 in different cellular pathways and its association with other genes in breast cancer, functional enrichment analysis was performed. The Enrichr database identified ten positively co-expressed genes, including BUB1B, CDCA2, DTL, DLGAP5, KIF2C, MELK, NCAPG, TOP2A, TPX2, and TTK. GSCALite, another webserver, was used to examine gene expression in breast cancer patients, revealing that each co-expressed gene had several fold-increased expressions in the tumors (Table 1). Following the above-mentioned results, we determined co-expressed genes with BUB1. Analysis using the TIMER 2.0 database showed a strong correlation between BUB1 and the top ten co-expressed genes (Supplementary Figures S3A–J). All these co-expressed genes were mainly involved in cell cycle regulation and cell proliferation, such as stabilization of spindle formation, mitosis, etc. (Table 2). Interestingly, a co-expressed gene, denticleless (DTL), is an E3 ubiquitin ligase that has been identified as a downstream target of the E2F1 transcription factor 34 and promotes cell migration and cancer. Furthermore, TNMplot RNA-Seq-based data and Gene Chip-based data corroborated these findings, as the expression of co-expressed genes was higher in primary tumors as well as metastatic tumors compared to normal breast tissue (Supplementary Figures S4A–B). Furthermore, the CancerSEA database indicated that the BUB1 gene is associated with four important molecular functional states, i.e., cell cycle, proliferation, DNA damage, and DNA repair (Figure 5A–E). Additionally, as demonstrated in Table 2, functional significance analyses revealed a link between the BUB1 gene and invasion, EMT, and differentiation. In addition, the TISIDB database was used for gene ontology analysis, and as expected, BUB1 was mainly involved in cellular components, KEGG, and Reactome pathways related to mitosis (Supplementary Table 2).
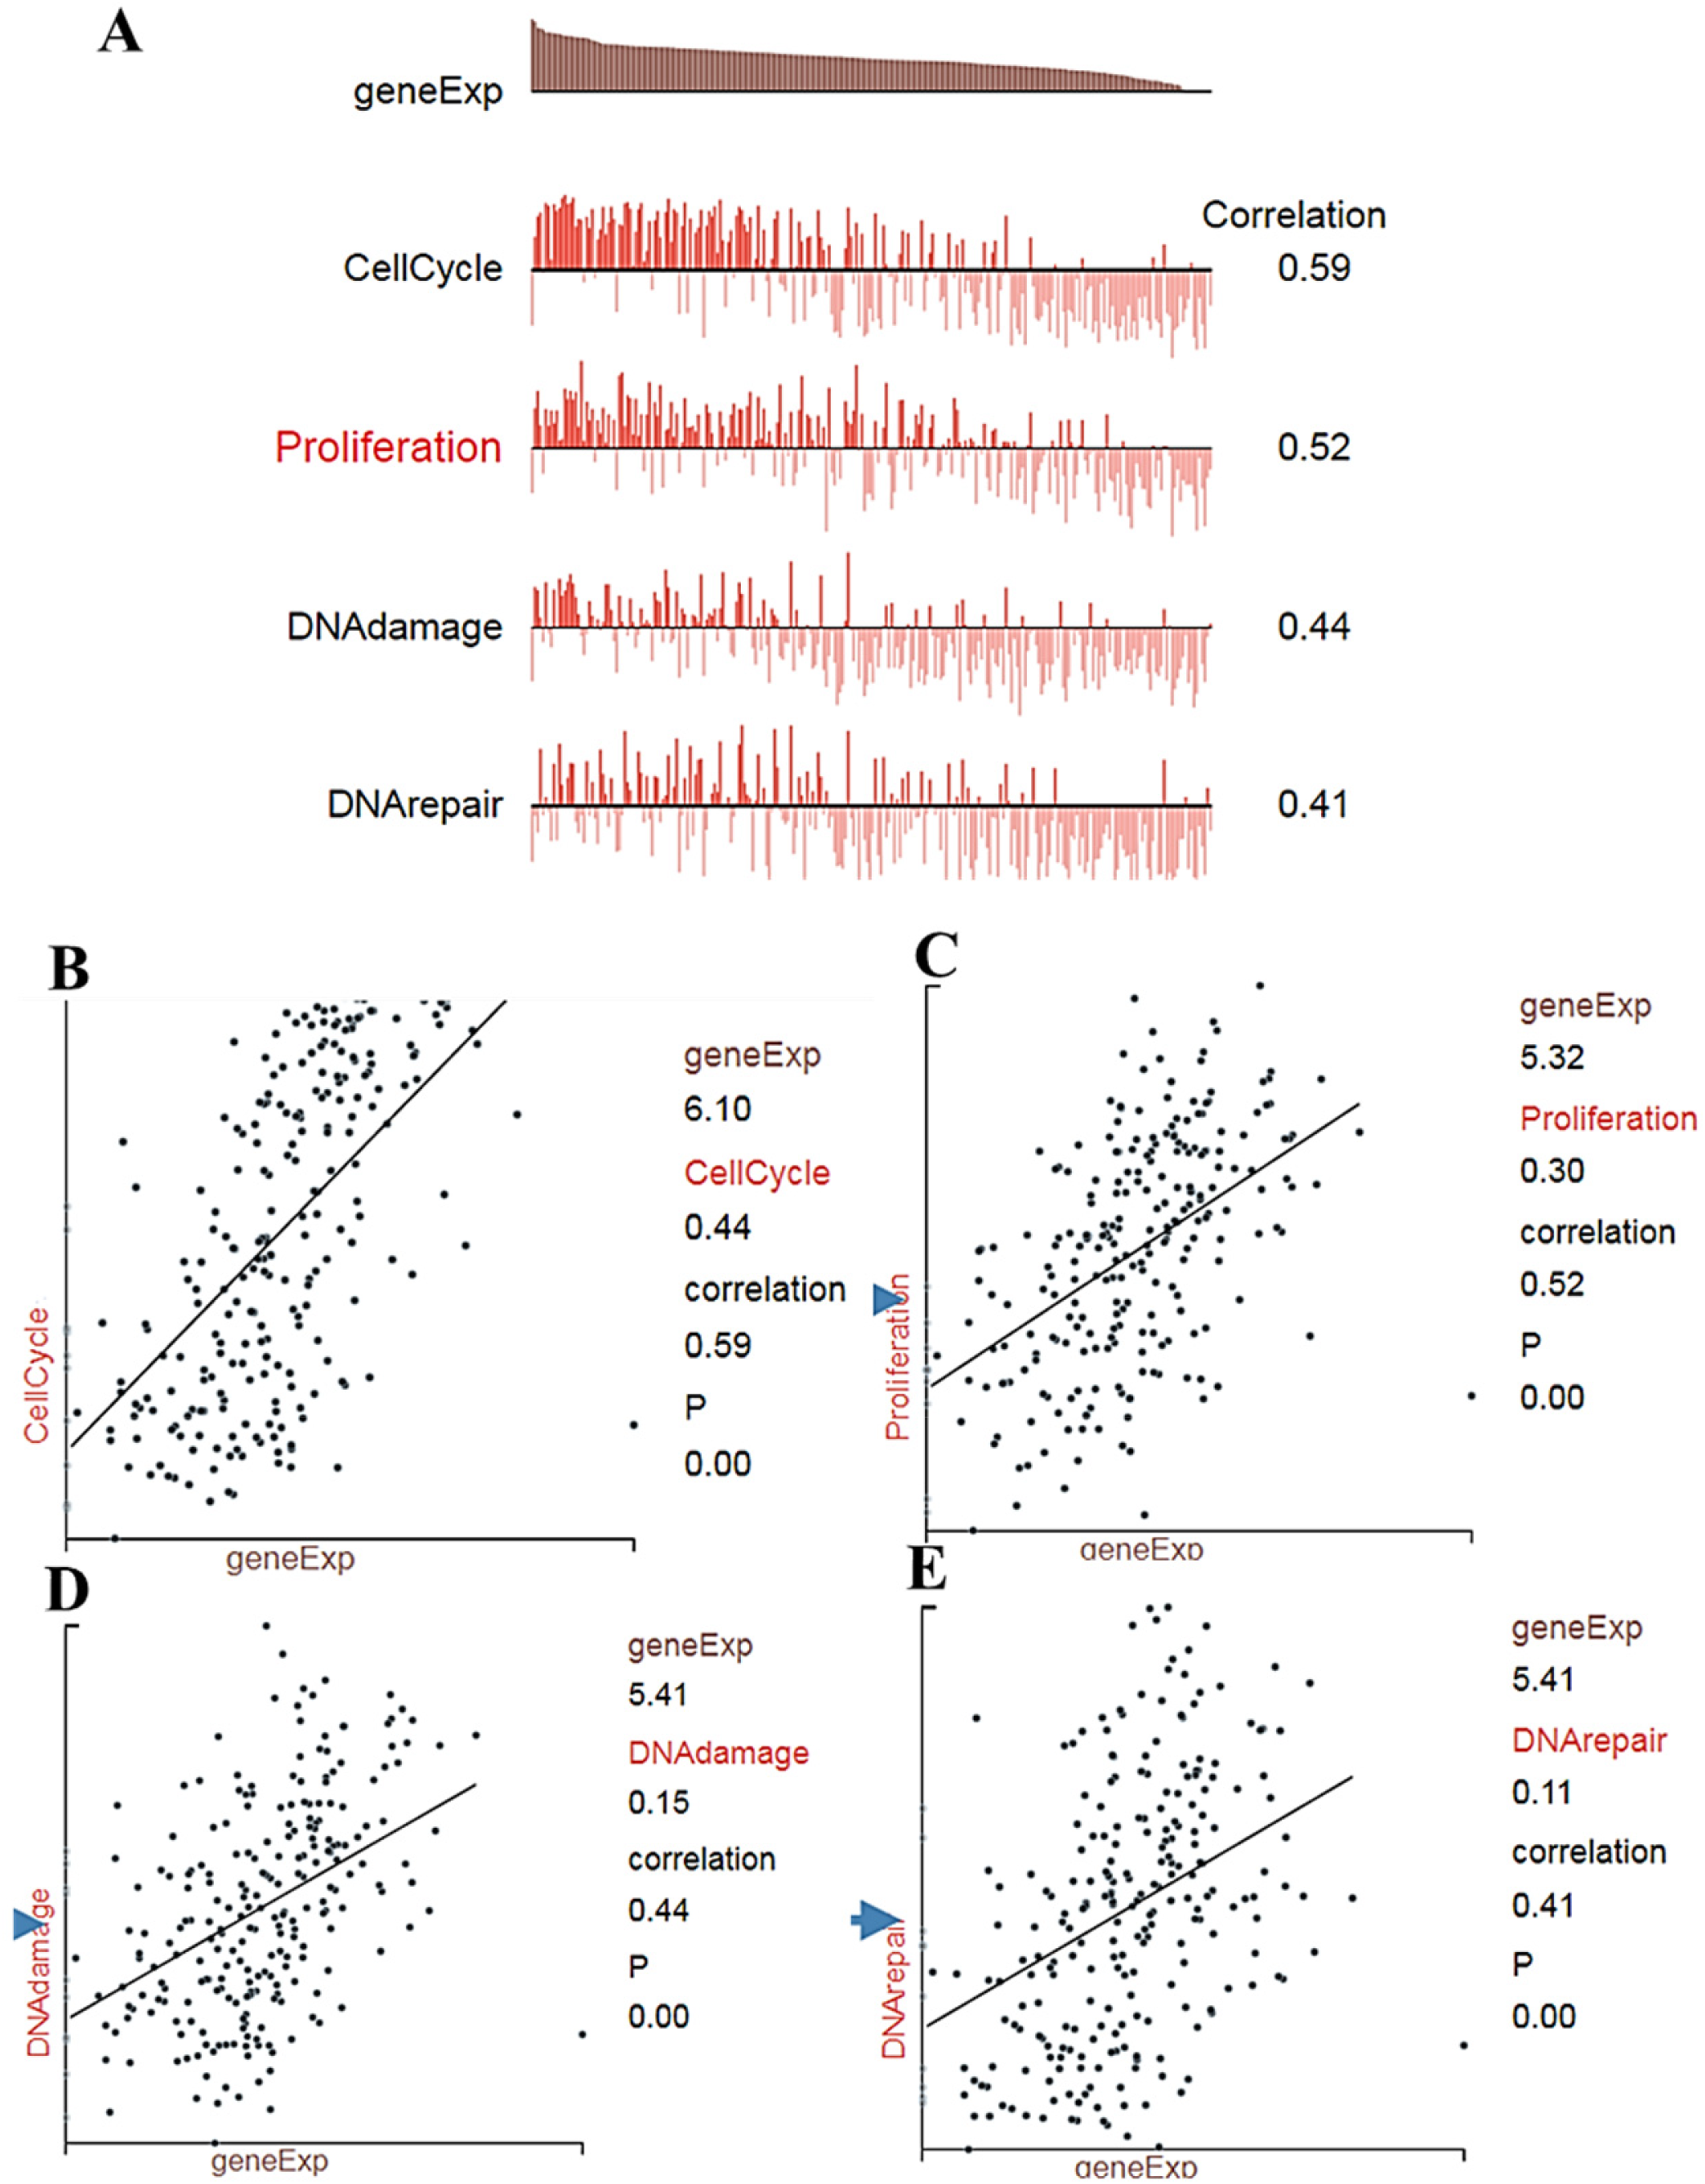
BUB1 expression and molecular functional states and correlation (
List of top 10 genes co-expressed with BUB1 in breast tumor tissue.
Function of genes co-expressed with BUB1.
miR-495-3p controls BUB1 gene expression
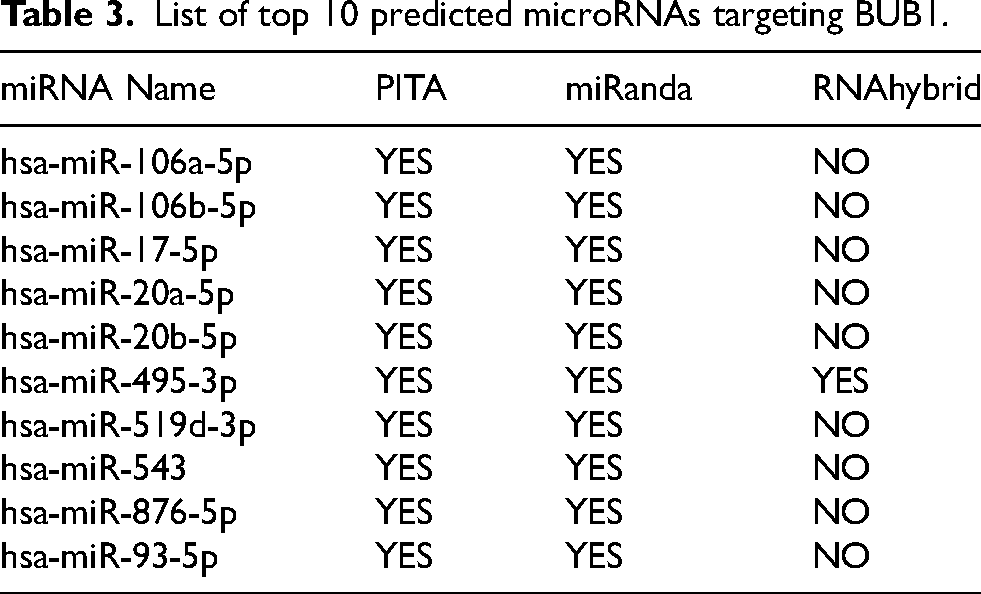
Previous studies and our data clearly show that BUB1 is overexpressed in breast cancer, and it is a poor prognostic marker. However, the mechanism of BUB1 dysregulation in breast cancer is unknown. Dysregulation of microRNAs regulates the expression of target genes, thereby controlling cancer pathogenesis. Therefore, we explored the microRNAs that could be responsible for the upregulation of BUB1 in breast cancer. Using the ctcRbase database, we identified the top 10 miRNAs, including hsa-miR-106a-5p, hsa-miR-106b-5p, hsa-miR-17-5p, hsa-miR-20a-5p, hsa-miR-20b-5p, hsa-miR-495-3p, hsa-miR-519d-3p, hsa-miR-543, hsa-miR-876-5p, and hsa-miR-93-5p that could target the BUB1 gene (Table 3 and Supplementary Figure S4). We then validated our findings with three different databases: PITA, miRanda, and RNAhybrid. Interestingly, only miRNA miR-495-3p was strongly associated with the BUB1 gene in all three distinct databases. Following this, we used the UALCAN database to conduct further analysis. As depicted in Figure 6A, miR-495-3p expression showed a negative expression (p = 2.3e-10) in breast cancer patients as compared with normal. After that, using the UALCAN database, we compared miR-495-3p expression in patients with different cancer stages, node metastasis, and histological subtypes. As shown in Figure 6B-D, miR-495-3p expression was lower in tumor tissue from stage 4 patients compared to normal or early-stage tumors. Then, we performed the analysis with the mirTV database and found that both 495-5p and 495-3p were significantly downregulated in breast cancer, and their downregulation was significantly associated with poor prognosis in breast cancer patients (p = 0.002 and p < 0.001), respectively (Figure 6 E–F).
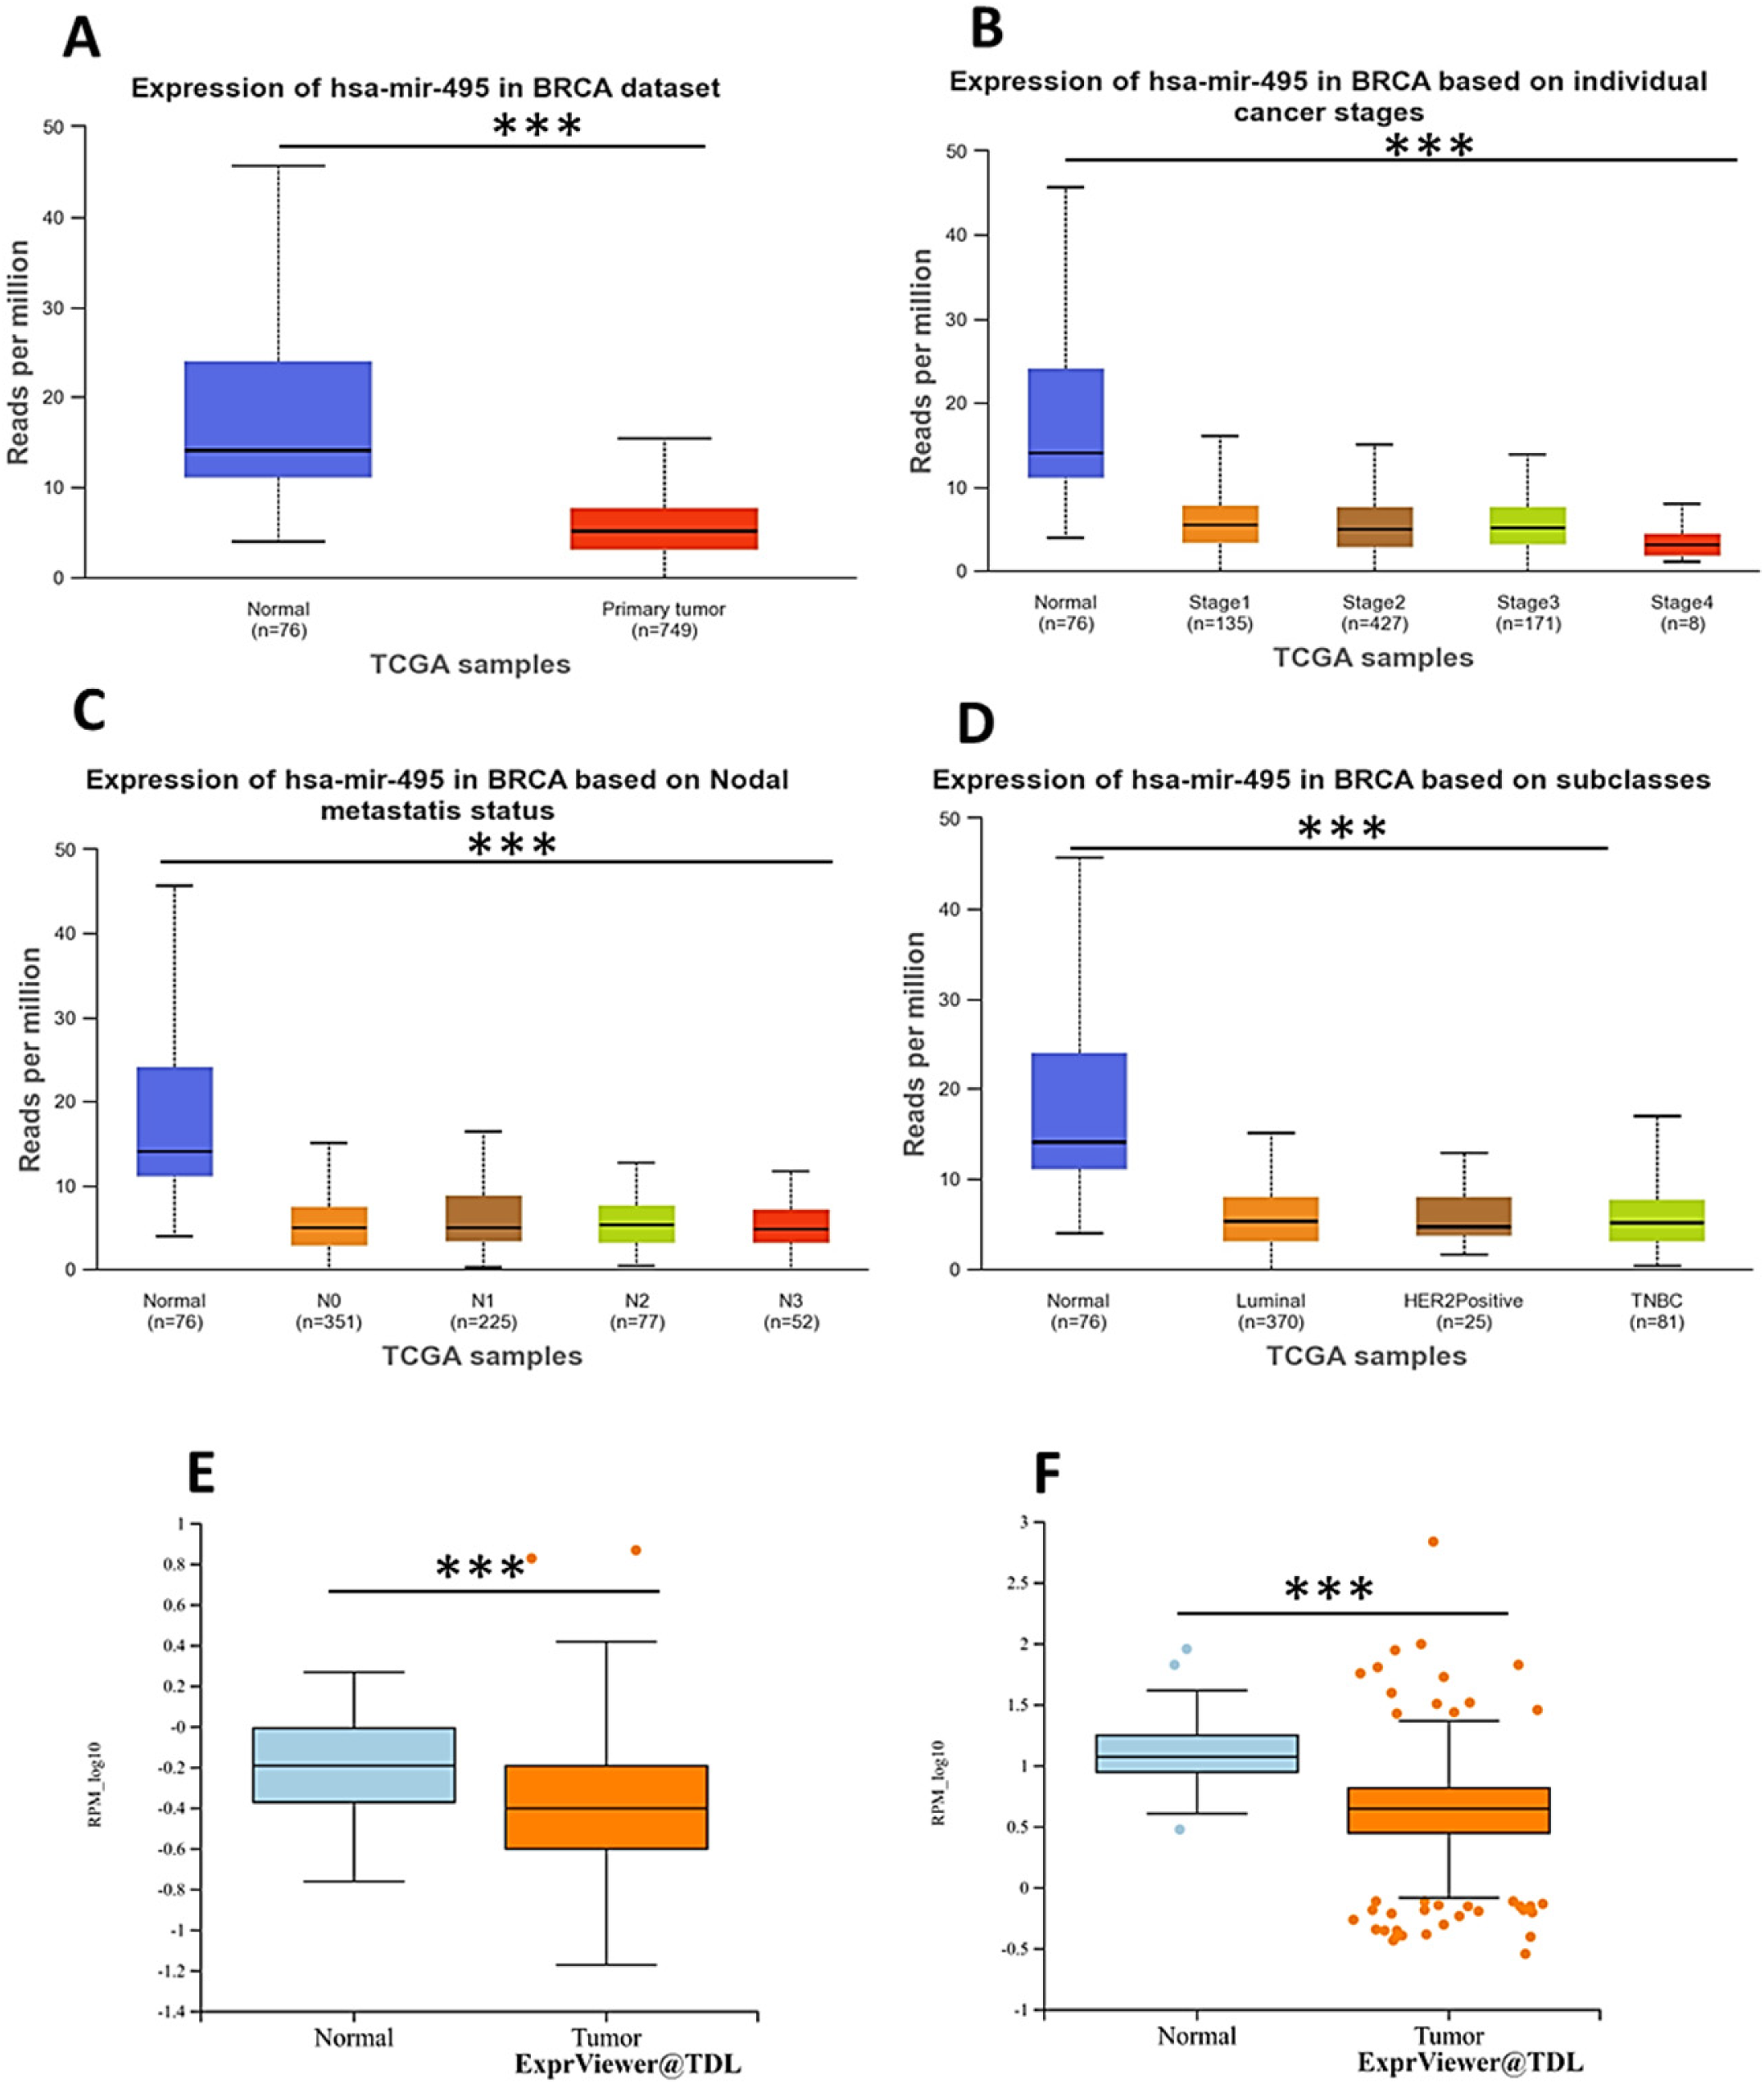
miRNA expression in tumor tissues from breast cancer patients with various clinicopathological features determined by the UALCAN and miR-TV databases
List of top 10 predicted microRNAs targeting BUB1.
E2F transcription factor-mediated BUB1 gene regulation
The E2F family of transcription factors (E2F TFs) regulate stemness, tumor progression, metastasis, and anticancer drug resistance. 35 While E2Fs have been shown to be involved in breast cancer development and metastasis, their expression and prognostic value in breast cancer remain unclear. A study has shown that E2F TFs regulate the expression of BUB1. 36 Thus, the prognostic role of all eight E2F family members was analyzed using the KM Plotter database with Jetset probe Affymetrix ID selection for three different survival outcomes. We found that only E2F1 and E2F8 were significantly associated with all three survival outcomes, where overexpression of both genes was associated with poor survival among breast cancer patients (Figure 7). The hazard ratio and p values for E2F1 were as follows:RFS (HR = 1.45, 95% CI: 1.31–1.6, P = 6.70e-13), OS (HR = 1.53, 95% CI: 1.26–1.85, P = 1.10e-05), and DMFS (HR = 1.47, 95% CI: 1.25–1.71, P = 1.30e-16), and for E2F8 RFS were as follows: HR = 1.74, 95% CI: 1.57–1.93, P = <1E-16), OS (HR = 1.45, 95% CI: 1.2–1.75, P = 0.00011), and DMFS (HR = 1.7, 95% CI: 1.46–1.99, P = 1.60E-11). Following this, we found that E2F1 and E2F8 were significantly associated with BUB1 gene expression levels in breast cancer patients. We further investigated the relationship between E2F1, E2F8, and BUB1 using TIMER 2.0, GEPIA2, ENCORI, and bc-GenExMiner v5.0, and we noticed a strong positive association between E2F1 and E2F8 and the BUB1 gene in breast cancer (Supplementary Figure S5 A-H).
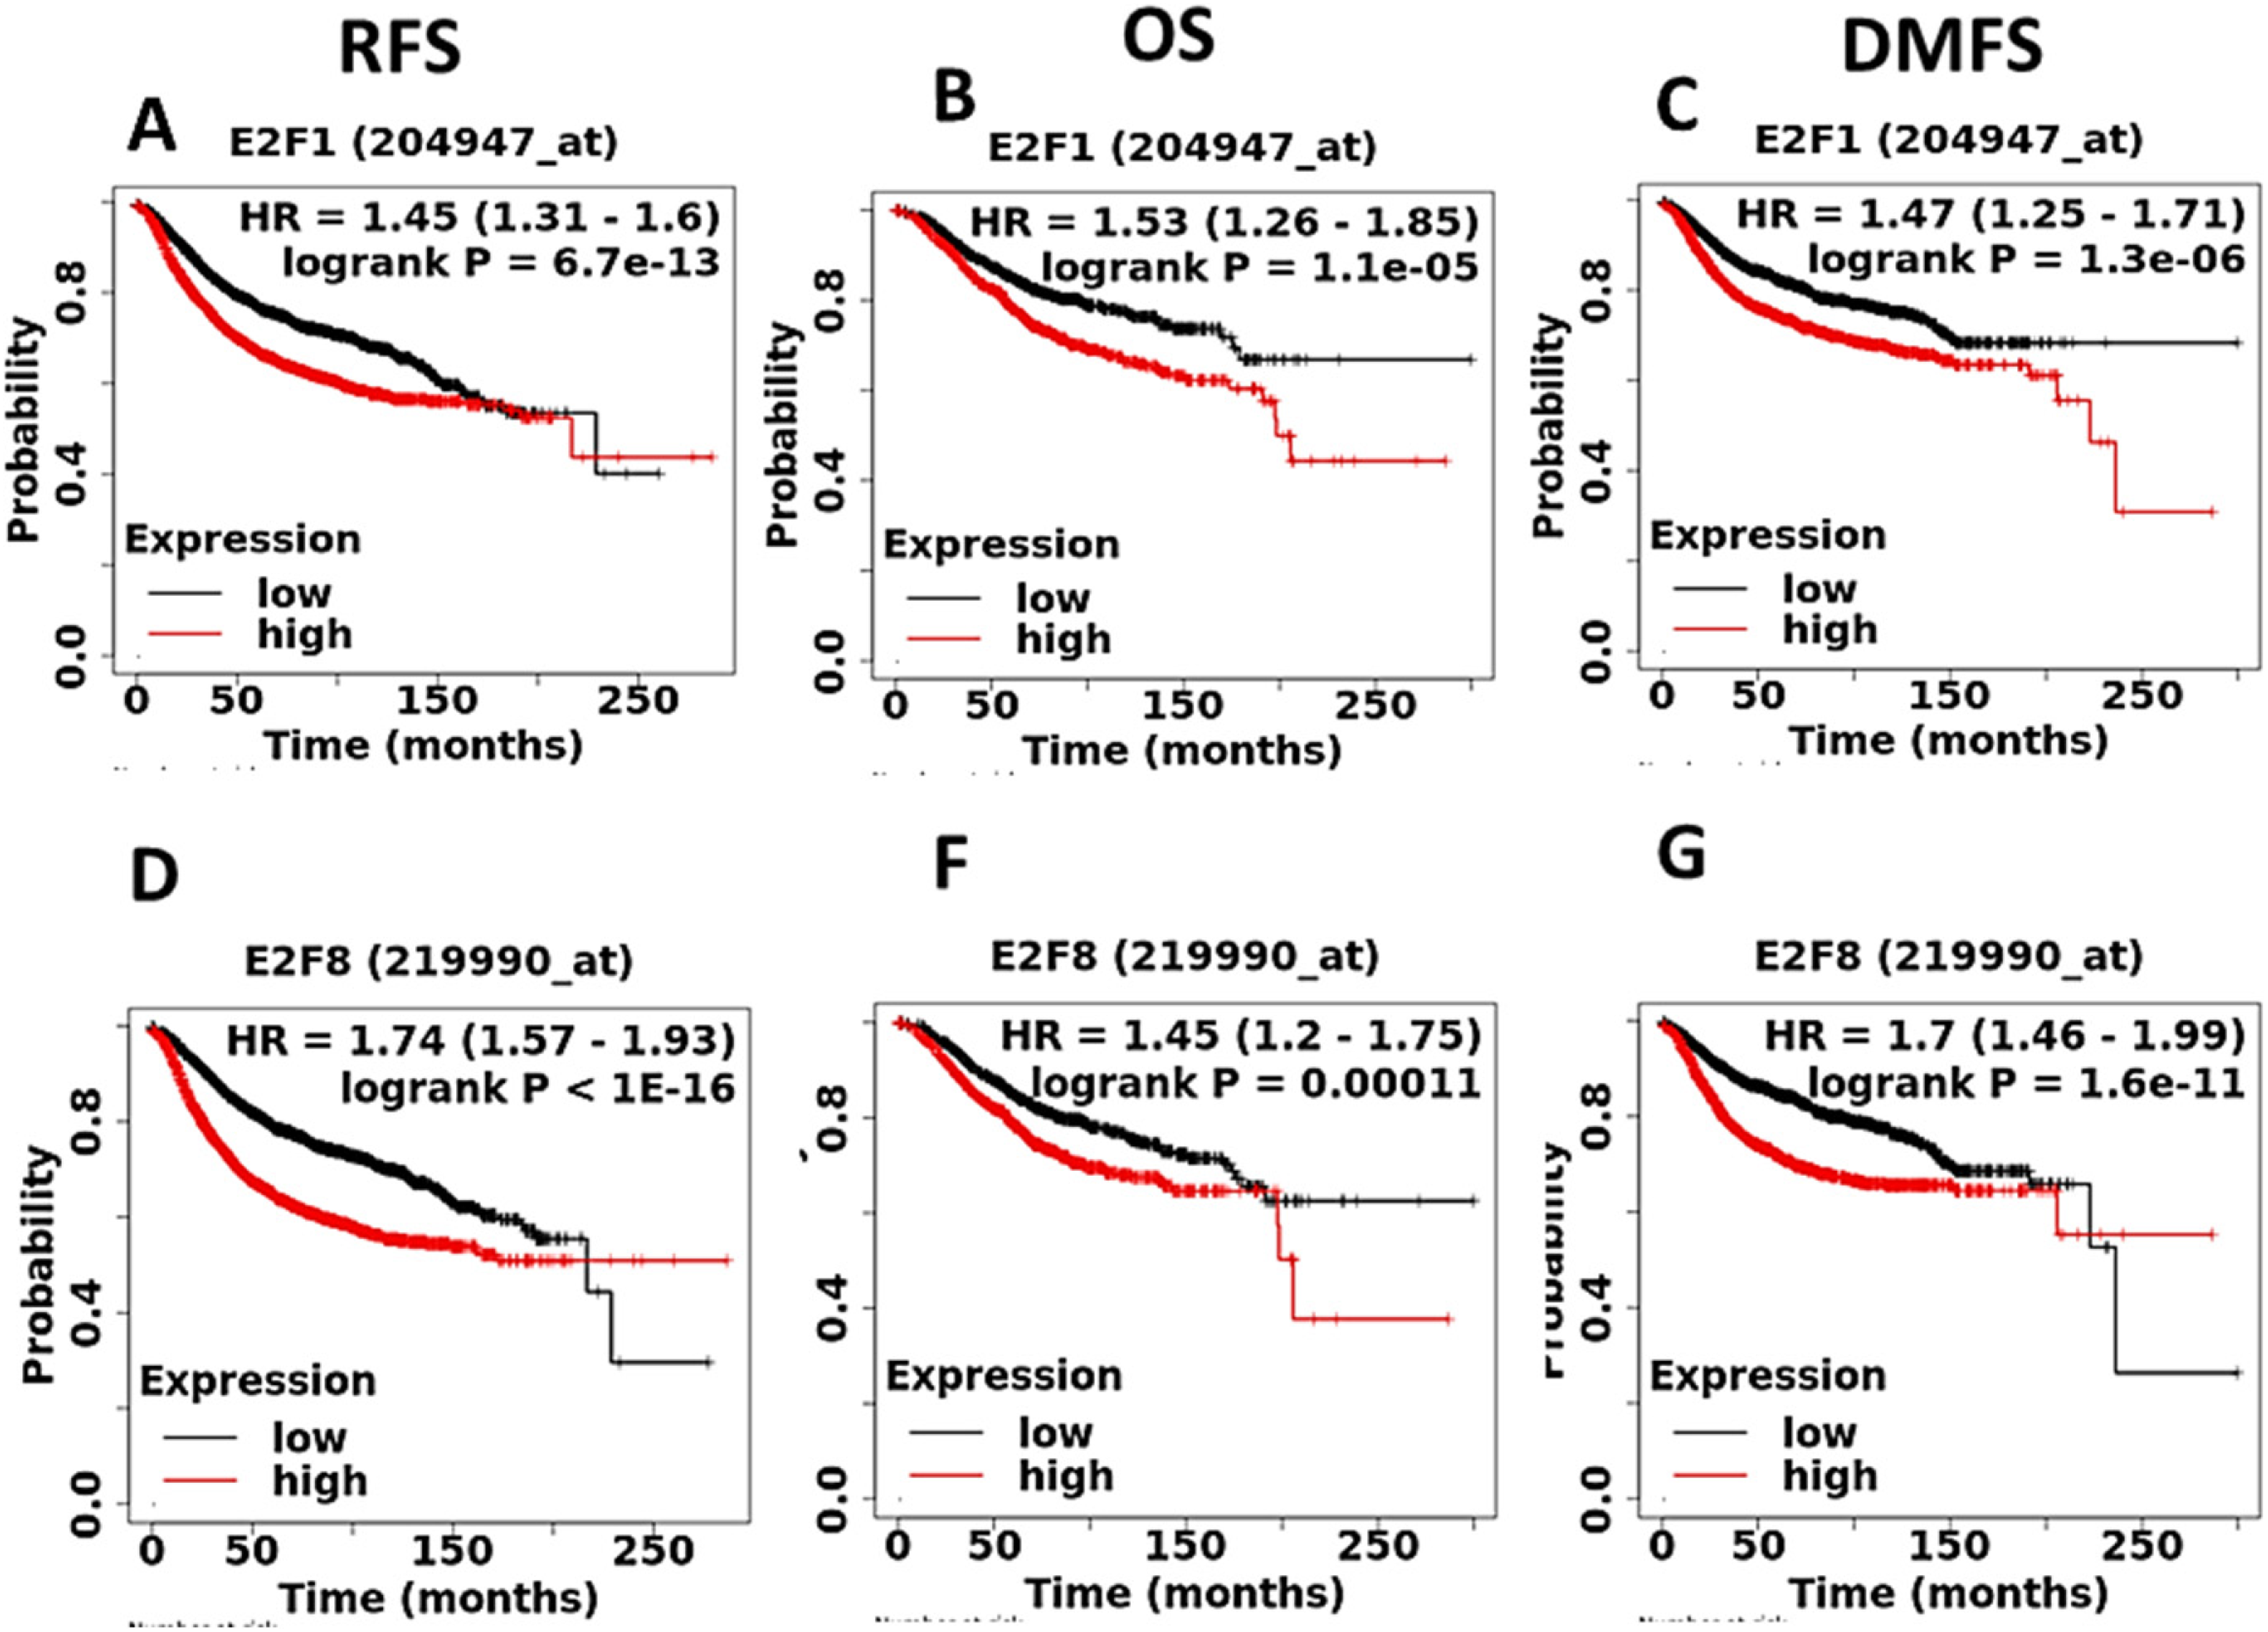
Kaplan-Meier plots for gene expression-based overall survival and relapse-free survival analysis. Survival plots of ovarian cancer patients were generated using the Kaplan-Meier plotter (KM plotter). For E2F1 (A), relapse-free survival (RFS): (
BUB1 correlates with Tumor Infiltration of Immune Cells (TIICs) in breast cancer
TIICs play a vital role in determining cancer treatment efficacy and patient prognosis.
37
Thus, we analyzed the association between BUB1 expression and TIICs using TIMER2.0 and the TISDB database. Firstly, we performed analysis on the TISDB database and created a complete heatmap with all the TIICs, including naive CD4 T cells, activated memory CD4 T cells, resting memory CD4 T cells, T follicular helper cells, γδ T cells, CD8 T cells, regulatory T cells, activated NK cells, resting mast cells, M1 macrophages, M2 macrophages, M0 macrophages, resting NK cells, activated mast cells, memory B cells, resting dendritic cells, activated dendritic cells, naive B cells, monocytes, neutrophils, eosinophils, and plasma cells. As shown in Supplementary Figure S6A, the heatmap showed that the BUB1 gene was strongly associated with infiltrating activated CD4+, especially CD4 + helper T cell 2 (Th2) cells, not only in breast cancer but also in other cancer types. To further confirm the association of the BUB1 gene with infiltration of Th2 cells, we performed analysis on the TIMER 2.0 database, and we found a strong positive correlation between BUB1 expression and the infiltration of Th2 subtypes in the breast tumor (
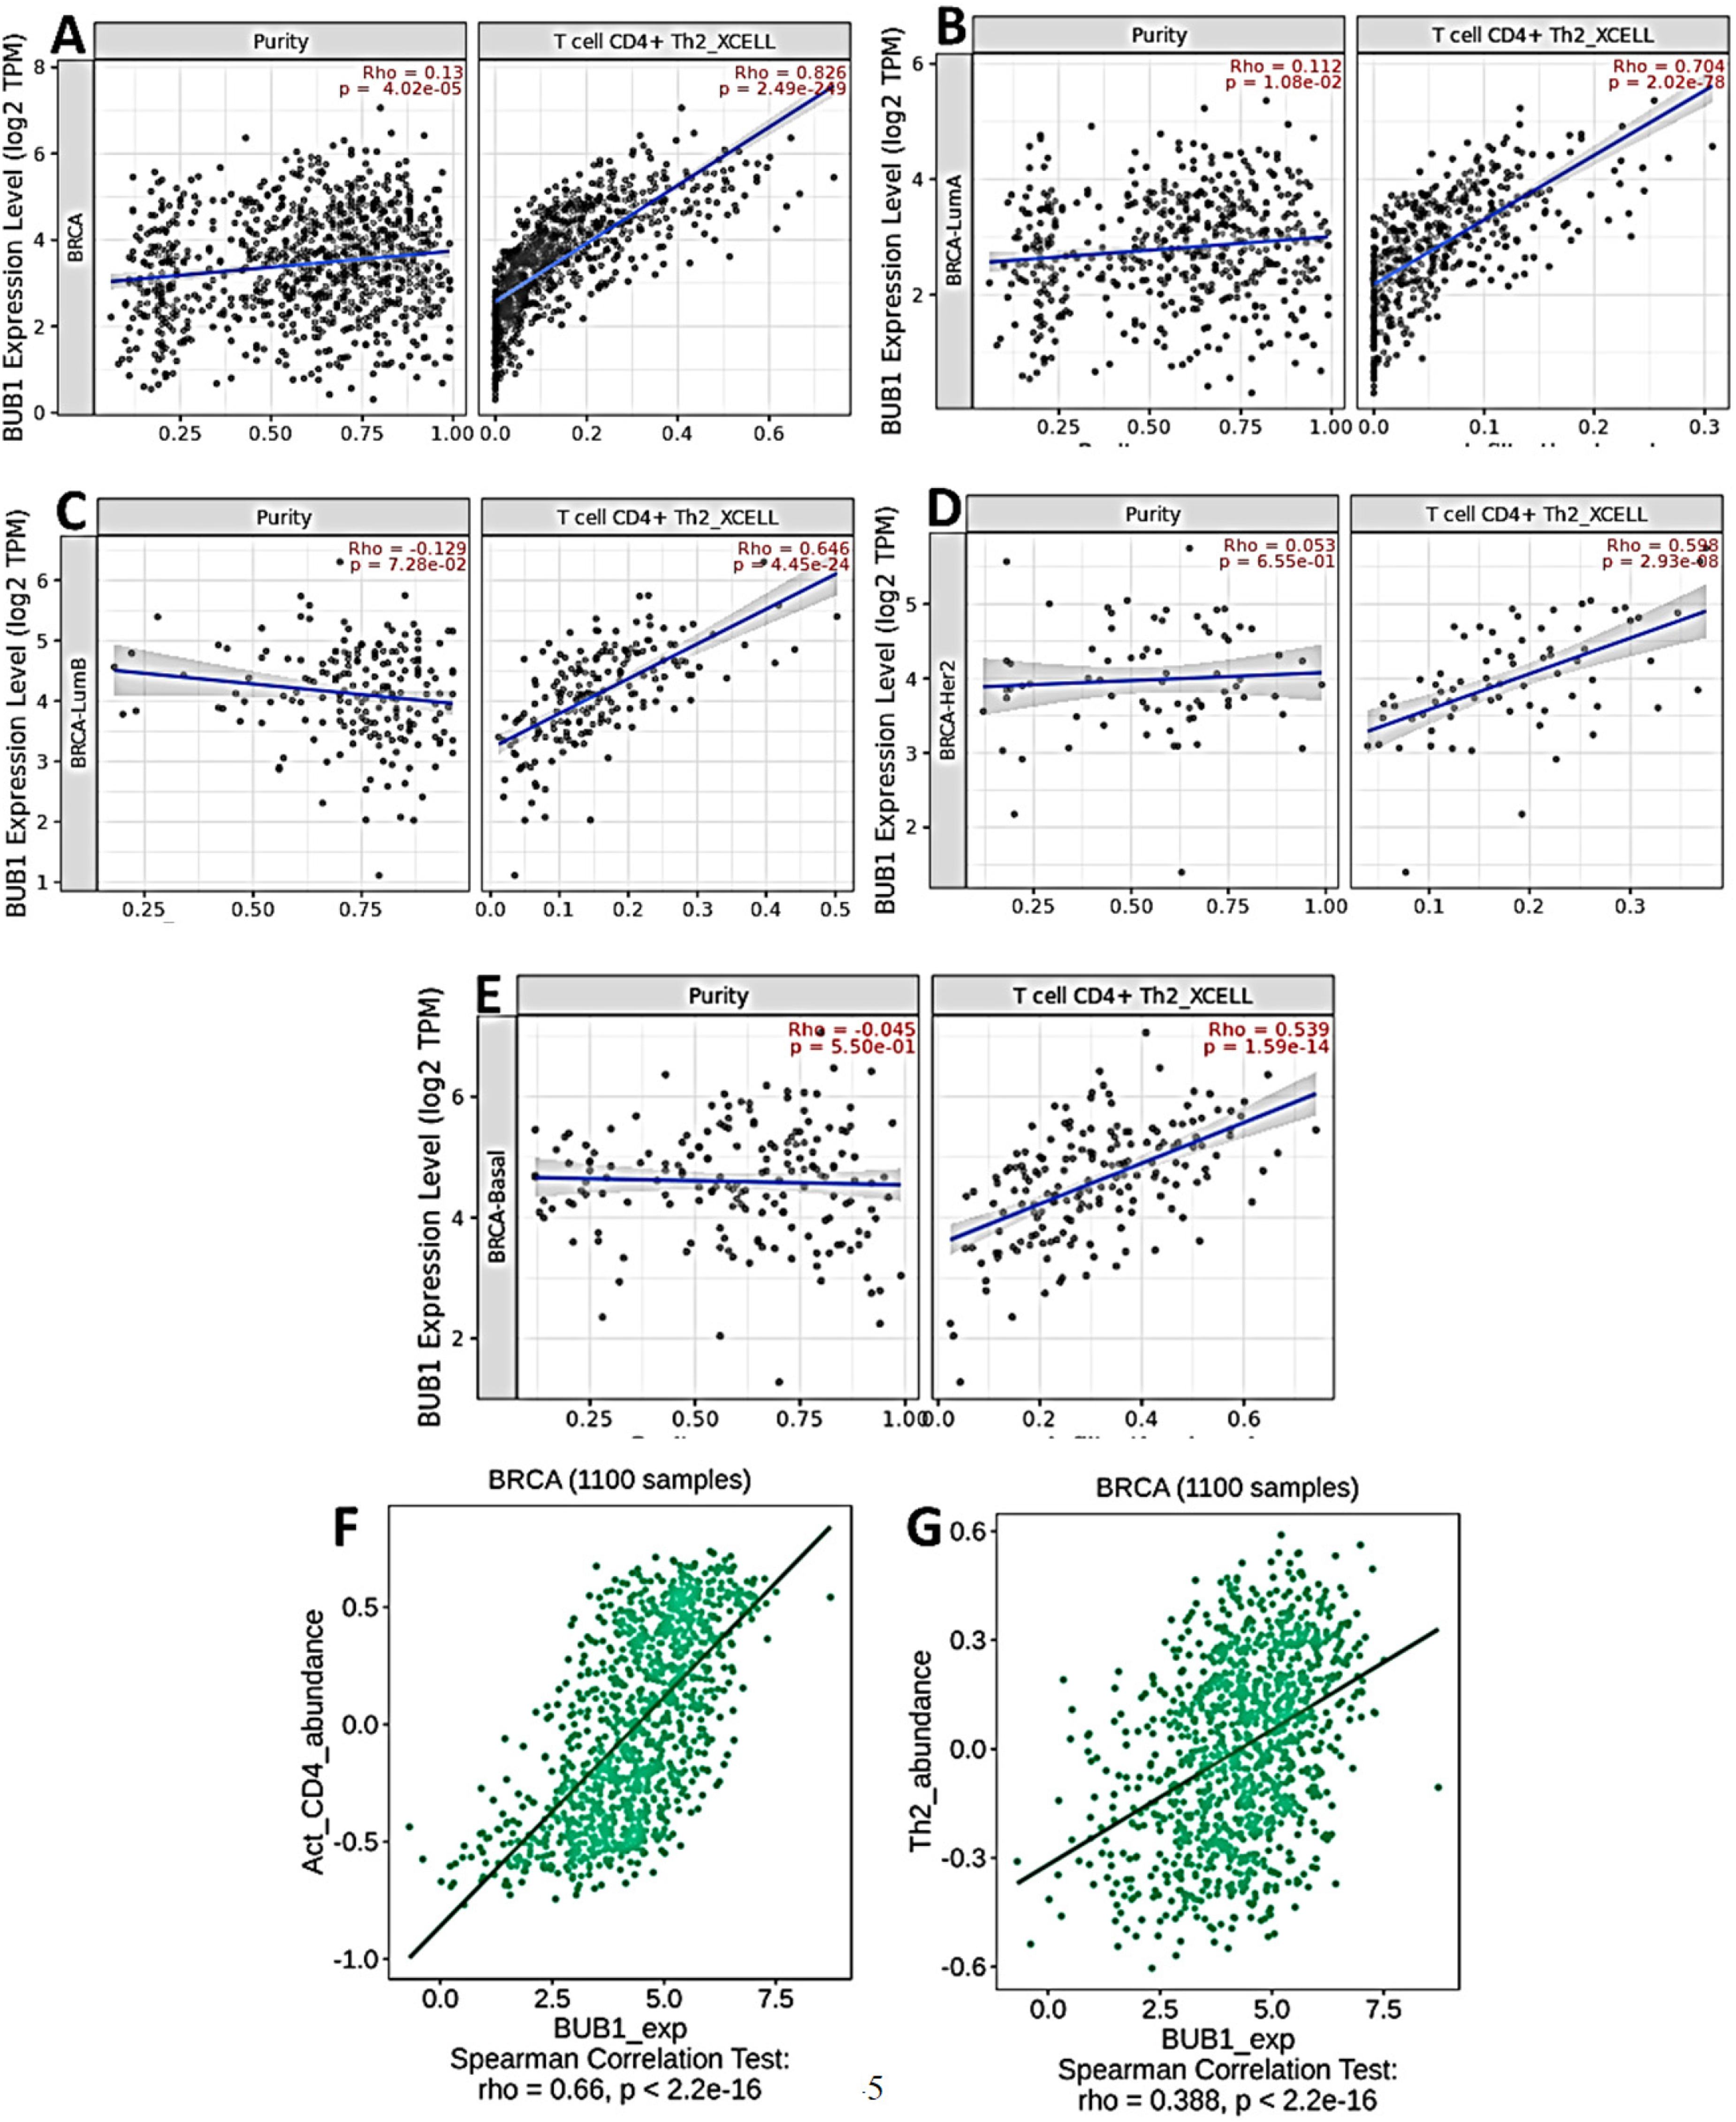
The BUB1 gene is associated with invasive breast carcinoma, basal, luminal A, luminal B, and HER2+, and BUB1 is significantly associated with T cell CD4+, Th2_Xcell, and basal-like tumor-infiltrating immune cells, according to correlation via the TIMER and (
Discussion
Breast cancer is a complex disease with heterogeneous cytogenetic and molecular abnormalities that impact the clinical presentation, treatment decisions, and prognosis of patients.38–41 The landscape of curative treatment for breast cancer is undergoing continuous evolution, where systemic treatment serves as a vital adjunct. Despite progress in treatment modalities, patients face several challenges, including poor prognosis and disease progression. Immunotherapy emerged as a promising avenue to tackle these challenges, although it was hindered by the lack of robust predictive biomarkers and substantial individual variations among patients. Studies are underway to pinpoint biomarkers that could guide adjunct chemo- and immunotherapeutic strategies. Cell cycle dysregulation is a fundamental hallmark of cancer progression. This study was aimed at determining the role of BUB1 in the prognosis and elucidating the mechanism of its dysregulation in breast cancer. BUB1, a serine/threonine kinase, contributes to mitotic checkpoint alignment and chromosome partitioning during cell cleavage.42,43 Several cancers were found to overexpress BUB1, including breast, pancreatic ductal adenocarcinoma, prostate, and gastric cancers, 44 but its molecular and biological functions in breast cancer are still unknown. Our study demonstrates that BUB1 is upregulated in the tumors of breast cancer patients. Upregulation of BUB1 is not only limited to breast cancer; rather, it is overexpressed in several other cancer types, including cholangiocarcinoma, esophageal carcinoma, head and neck cancer, liver cancer, lung cancer, and prostate cancer. Our data is in accordance with previous studies, as BUB1 has been shown to be upregulated in bladder cancer, 8 prostate cancer, 45 endometrial cancer, 46 papillary thyroid cancer, 47 lung adenocarcinoma, 48 basal-like breast cancer, 49 and neuroblastoma. 9 Overexpression of the BUB1 protein has been shown to be associated with early tumor recurrence due to an elevated cell proliferation rate. 50 Among histological subtypes, TNBC shows a maximal increase in BUB1 expression, followed by HER2 + and luminal expression. This indicates that BUB1 expression increases with the aggressiveness of breast cancer. Importantly, elevated expression of BUB1 was also noted in metastatic tissues (CTC). Patients with high expression of BUB1 exhibited poor survival outcomes. Consistently, BUB1 expression has been associated with the prognosis of other cancer types, such as prostate cancer, 45 neuroblastoma, 9 and breast cancer.11,51 A previous study identified eight hub genes (BUB1, CCNA2, CCNB1, CDK1, MKI67, PLK1, TOP2A, and TTK) in TNBC. The gene expression of the above candidates was negatively correlated with the survival outcomes of patients. 52 Thus, BUB1 expression and co-expressed genes can be used to stratify breast cancer patients into high-risk and low-risk groups.
The E2F transcription factors (E2Fs), named E2F1-E2F8, play an important role in cell proliferation, differentiation, and apoptosis 53 by regulating the transcription of several downstream target genes. A previous study has shown that E2Fs may control the transcription of BUB1. 36 Consistently, we found a strong correlation between the expression of BUB1, E2F1, and E2F8 in the tumor tissue. Furthermore, high expression of E2F1 and E2F8 was associated with worse prognosis (RFS, OS, and DMFS) in breast cancer patients, which is in accordance with a previous study. 54 Tumor suppressor micro-RNAs can also regulate the expression of oncogenic genes. Using various bioinformatic tools, we found that BUB1 could be a putative target of miR-495-3p. Indeed, BUB1 expression was inversely correlated with miR-495-3p, possibly due to its reduced expression in poorly differentiated breast carcinomas. Consistently, overexpression of miR-495-3p in colorectal cancer cells results in the downregulation of BUB1, SMAD4, and TGF-beta receptors, TGFβR1, and TGFβR2. 55 Furthermore, luciferase assay supports the direct interaction of miR-495 with 3′UTR sequences of BUB1 gene. miR-495-3p has been shown to be downregulated in breast cancer, and it inhibits the transition of cells from the G1-S phase. 56 Circular RNA has also been shown to regulate the expression of BUB1. A study has shown that in prostate cancer cells, a circular RNA, circ_0004087, binds with SND1, a transcriptional coactivator, and stimulates the transactivation of BUB1. 45 miR-524-5p has been shown to decrease the expression of BUB1 in endometrial cancer cells. 46 Thus, the increased expression of BUB1 in the tumors, especially in TNBC patients, could be due to the downregulation of miR-495-3p. Mechanistically, BUB1 has been shown to interact with STAT3 and mediate its phosphorylation, thereby driving the progression of bladder cancer. 8 BUB1 has also been shown to interact with the epidermal growth factor receptor (EGFR) and reduce the latter's endocytosis, thereby regulating EGFR signaling. 57 In addition, BUB1 has been linked with drug resistance. A few studies have shown that BUB1 induces taxane resistance in prostate cancer cells.45,58 A study identified BAY1816032 as a specific and sensitive inhibitor of BUB1. 59 BAY1816032 sensitizes TNBC cells to paclitaxel or olaparib (a PARP inhibitor), and combination therapy reduces tumor size in xenograft studies compared with the respective monotherapies. 59 Thus, targeting BUB1 could also help in overcoming the drug resistance in TNBC. Another study has shown that docetaxel resistance is mediated via the circ_0004087/SND1/MYB/BUB1 axis, and inhibition of BUB1 restores taxane sensitivity in the taxane-resistant cells.45,58 As miR-495-3p can regulate the levels of BuB1 and E2F1, thus the restoration of the levels of miR-495-3p using ago-miRs can attenuate BuB1 and E2F1/E2F8 expression and thereby suppress tumor growth. Furthermore, the knockdown of BUB1 decreases cancer stem cell potential in the MDA-MB-231 cell line, resulting in smaller tumor formation in the immunocompromised mice. 42 The CD4 + subpopulation of T cells includes, among others, Th1, Th2, Th17, follicular helper (Tfh) T cells, and Tregs. 60 Various Th subtypes exert different and often opposite effects on breast cancer. Classically, Th1 is considered an anti-tumor phenotype, while Th2 promotes tumor growth. In our study, a positive correlation was found between BUB1 expression and CD4+ Th2 subtypes. Thus, high expression of BUB1 may lead to the enrichment of Th2 subtypes of cells in the tumor. However, the mechanism by which BUB1 enriches Th2 cells in tumors is not known.
Conclusion
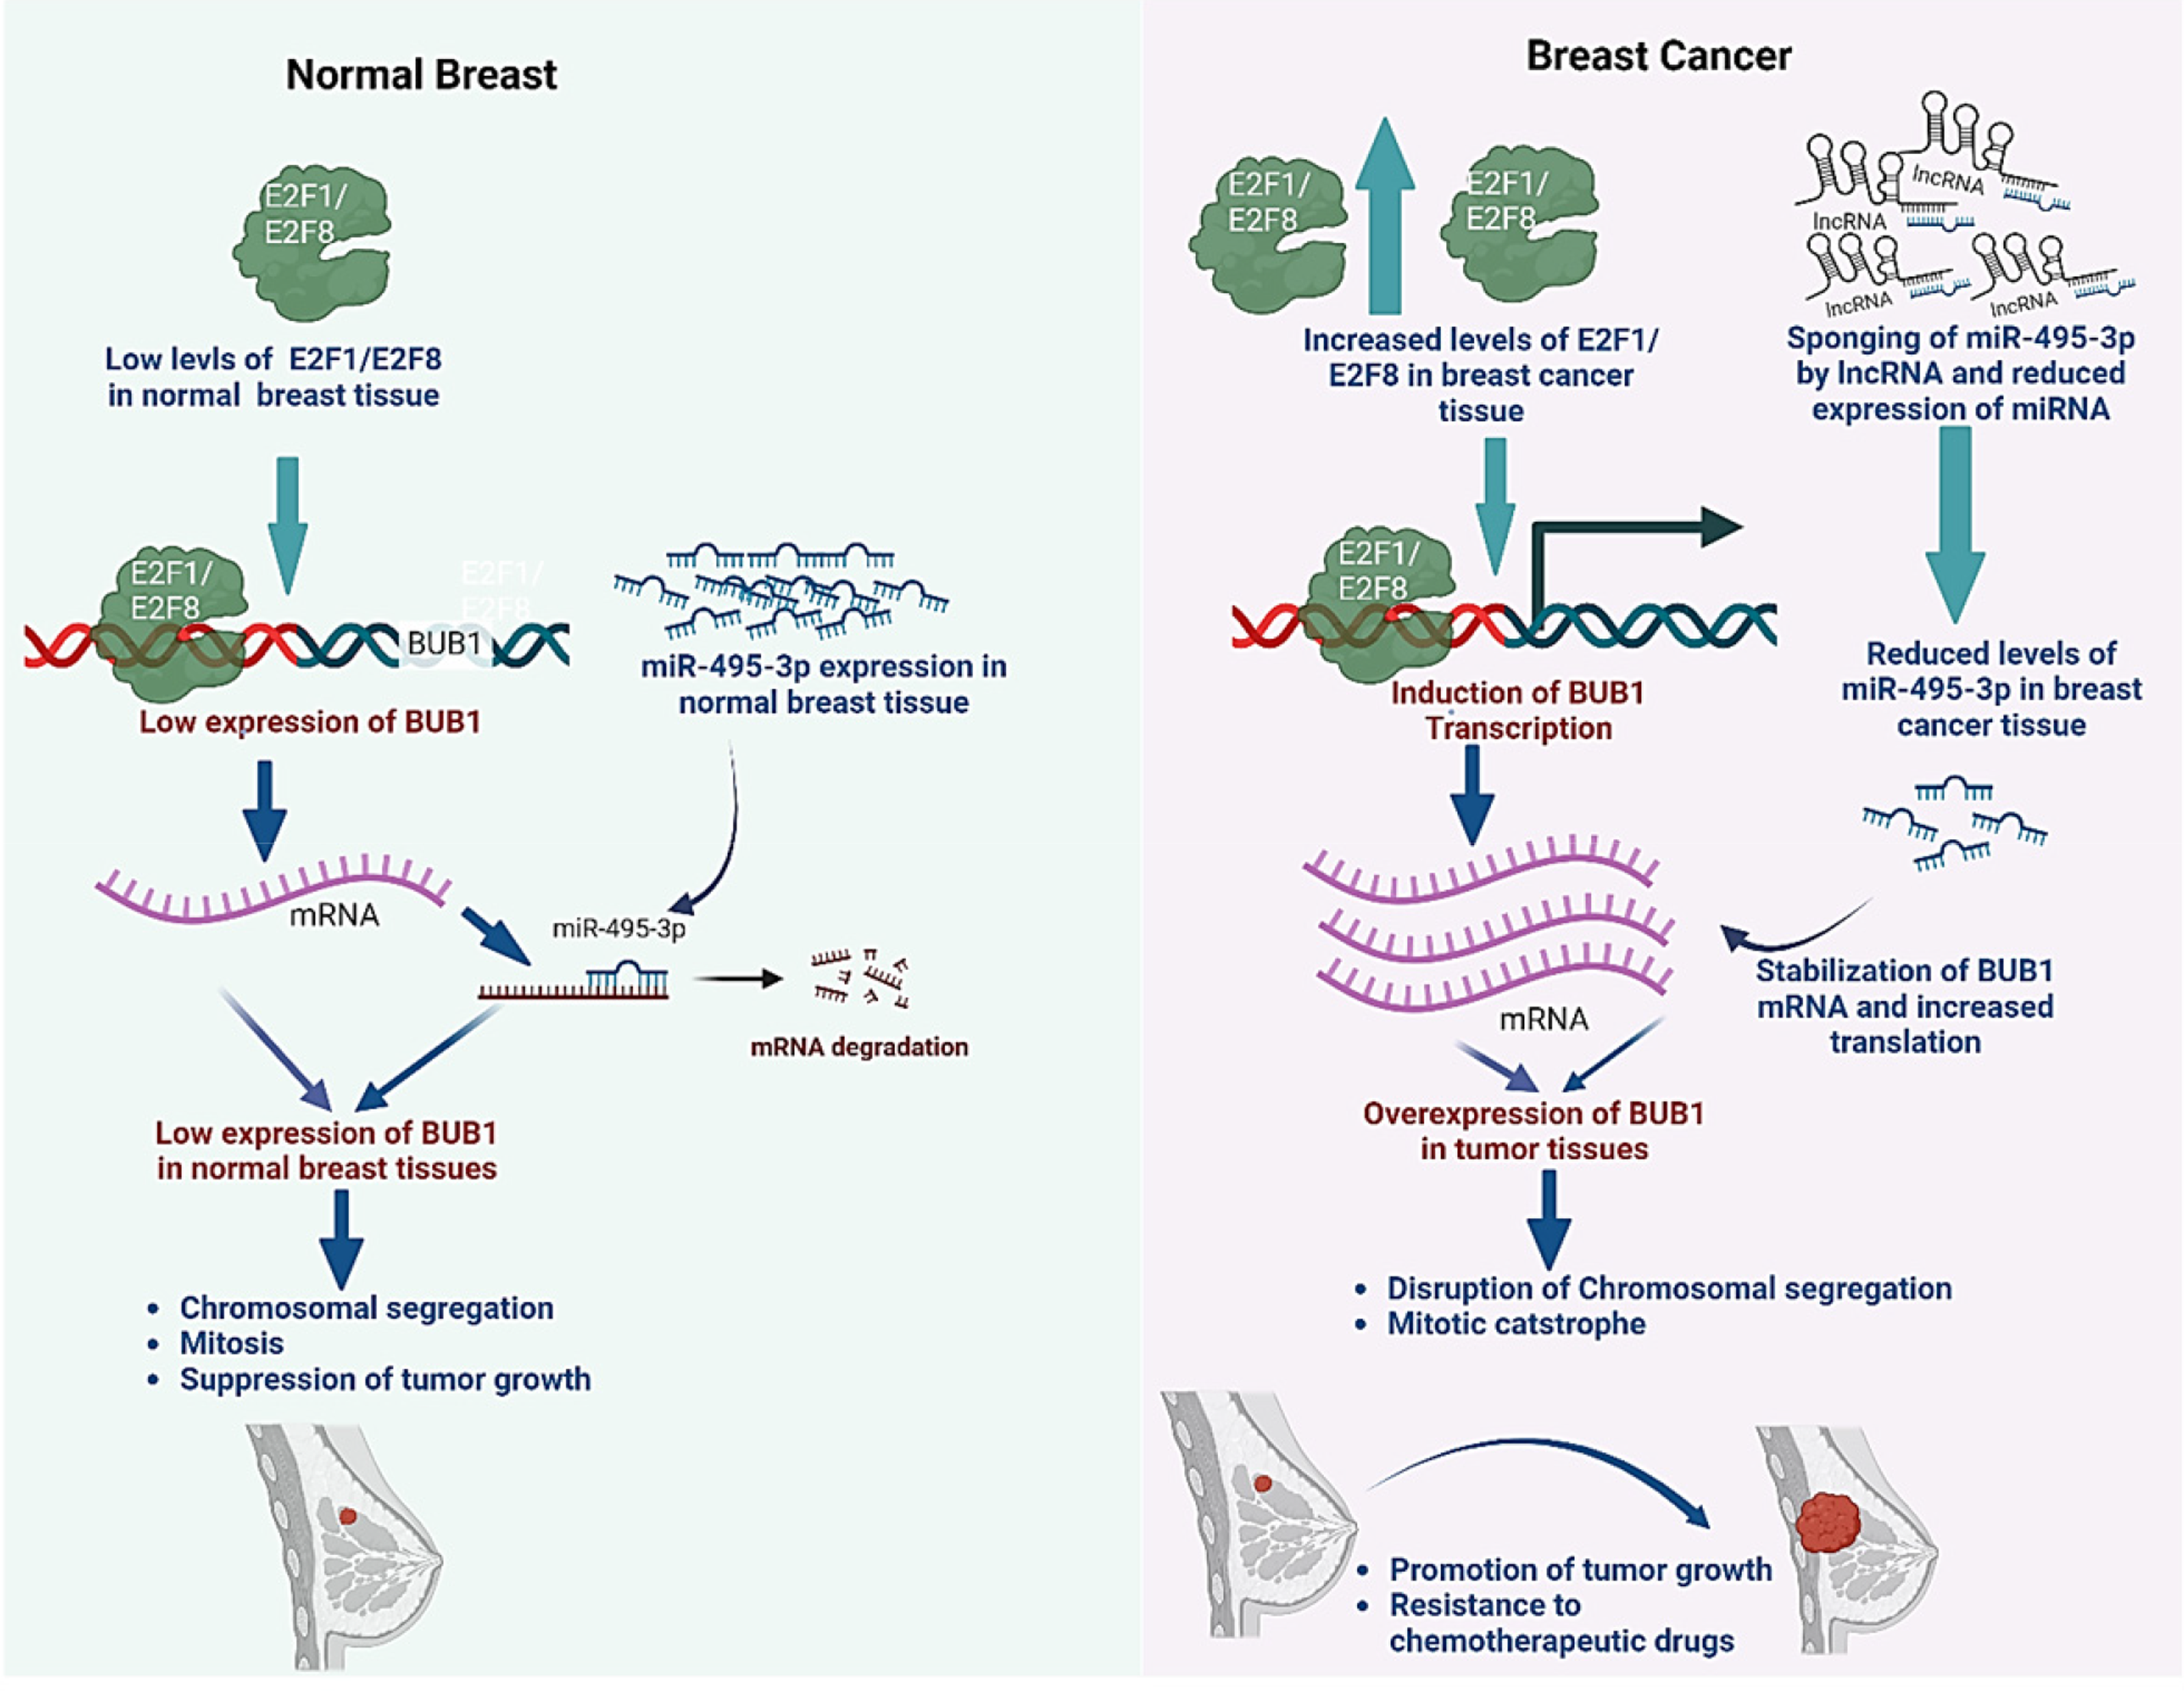
In conclusion, we show that BUB1 and E2F1/E2F8 are overexpressed in primary tumors from breast cancer patients. Elevated expression of BUB1 and E2F1/E2F8 and decreased levels of miR-495-3p are associated with poor survival outcomes in breast cancer patients. However, BUB1 expression was inversely associated with miR-495-3p, possibly due to its reduced expression in poorly differentiated breast carcinoma. The regulation of BUB1 gene expression is influenced by the E2F transcription factors, particularly E2F1 and E2F8, thereby potentially promoting breast cancer progression. BUB1 gene expression has a strong association with E2F1 and E2F8, while it is negatively associated with has-mir-495-3p gene expression. BUB1 could be a putative target of miR-495-3p. We also show that the BUB1-E2F1/E2F8-miR-495-3p network may also contribute to the infiltration of Th2 into the tumor microenvironment. As our findings are based on in silico analysis, further experimental verification is needed to better understand and establish the relationship between miR-495-3p, E2F1, E2F8, and BUB1 and their effect on breast cancer.
Supplemental Material
sj-docx-1-cbm-10.1177_18758592241310109 - Supplemental material for BUB1, miR-495-3p, and E2F1/E2F8 axis is associated with poor prognosis of breast cancer patients and infiltration of Th2 cells in the tumor microenvironment
Supplemental material, sj-docx-1-cbm-10.1177_18758592241310109 for BUB1, miR-495-3p, and E2F1/E2F8 axis is associated with poor prognosis of breast cancer patients and infiltration of Th2 cells in the tumor microenvironment by Rajeev Nema and Ashok Kumar in Cancer Biomarkers
Footnotes
Author contribution
Funding
AK would like to thank the funding support from the Indian Council of Medical Research (ICMR 5/13/93/2020/NCD-III).
Declaration of conflicting interests
The authors declared no potential conflicts of interest with respect to the research, authorship, and/or publication of this article.
Supplemental Material
All supplemental material mentioned in the text is available in the online version of the journal.
References
Supplementary Material
Please find the following supplemental material available below.
For Open Access articles published under a Creative Commons License, all supplemental material carries the same license as the article it is associated with.
For non-Open Access articles published, all supplemental material carries a non-exclusive license, and permission requests for re-use of supplemental material or any part of supplemental material shall be sent directly to the copyright owner as specified in the copyright notice associated with the article.