
Abstract
Background
Breast cancer is a malignant tumor with high morbidity and mortality, which seriously endangers the health of women around the world. Biomarker-based exploration will be effective for better diagnosis, prediction and targeted therapy.
Objective
To construct biomarker models related to glycolysis and gluconeogenesis in breast cancer.
Methods
The gene expression of 932 breast cancer patients in the Cancer Genome Atlas (TCGA) database was analyzed by Gene Set Variation Analysis (GSVA) using glycolysis and gluconeogenesis-related pathways. Differential expression genes were searched for by the T-test. Univariate Cox proportional hazards model (COX) regression, Least Absolute Shrinkage and Selection Operator (LASSO) regression, and Multivariate COX regression were used to find clinically significant genes for prognostic survival. After that, the constructed gene signature was externally validated through the Gene Expression Omnibus (GEO). Finally, a nomogram was constructed to predict the survival of patients. In addition, analyzing the role of biomarkers in pan-cancer.
Results
A risk scoring model associated with glycolysis and gluconeogenesis was developed and validated. A nomogram was created to predict 2-, 3-, and 5- survival.
Conclusions
The predictive model accurately predicted the prognosis of breast cancer patients.
Introduction
Cancer is the second leading cause of death in human beings and seriously threatens human life. 1 Breast cancer is the most common malignant tumor, which seriously threatens the health of women around the world, 2 and the incidence and mortality rate are increasing year by year. 3 The pathogenesis of breast cancer is complex and unclear, but the recognized risk factors are genetic factors and genetic mutations, both of which are at higher risk of breast cancer. 3 The treatment of breast cancer is generally divided into three ways: surgical resection treatment, drug treatment and radiation therapy. 4 Early breast cancer patients can be healthy with radical surgery, which can basically be cured. However, patients with middle and advanced breast cancer can only undergo reasonable comprehensive treatment to obtain a better survival period. 4 However, it is inevitable that due to the complex body environment, it will cause recurrence and lose survival. Moreover, most breast cancer patients have obvious symptoms in the early stage, and it is easy to be ignored and do not seek medical attention in time, resulting in the phenomenon of difficult treatment and late treatment in the later stage. 5 So early screening becomes particularly important. Through the rapid development of science and technology, we have learned that the occurrence and development of cancer is a dynamic process, which involves a variety of molecular changes. Immunotherapy has shown extraordinary potential in the treatment of cancer.6,7 At the same time, biomarkers are slowly approaching people's vision, and there are many interacting molecules and cellular pathways that play an indispensable role in the process of cancer. Therefore, analyzing biomarkers can yield more prophets about the myriad molecular pathways involved in cancer. 8 Omics approaches also show inhuman promise in the selection of early cancer detection and late-stage cancer treatment modalities. 9
In recent years, there has been a gradual increase in research on breast cancer, and cancer cells are more dependent on obtaining energy from glucose metabolism than are normal cells. but it has not been studied from the perspective of glycose metabolism. Several previous studies have shown that glucose metabolism is inextricably linked to the development of cancer. 10 Tumor glycolysis has been studied as a target for cancer treatment. The occurrence of cancer is accompanied by a change in energy, 11 and the energy required for this transformation to occur depends first and foremost on the energy released by glycolysis. 12 Studies have confirmed that glycolysis has an extraordinary relationship with clear cell renal cell carcinoma, 13 hepatocellular carcinoma,11,14,15 breast cancer,16,17 ovarian cancer, 18 lung adenocarcinoma,19,20 endometrial adenocarcinoma,21,22 low-grade gliomas 23 and colorectal cancer 24 etc. Glycolysis is the main way for organisms to obtain energy, and the oxidative decomposition of sugars in organisms is mainly divided into anaerobic oxidation, aerobic oxidation and pentose phosphate pathways. And glycolysis is also a preparatory way for aerobic oxidation in most organisms. 25 Glycolysis refers to the catalysis of glucose through a variety of enzymes to eventually produce pyruvate and release energy to meet the body's various life activities. 26 Gluconeogenesis is the process by which non-glucose substances such as lactic acid and pyruvate are converted into glucose or glycogen in organs such as the liver and kidneys under the catalysis of certain enzymes. Therefore, gluconeogenesis can be approximately described as an inverse reaction of glycolysis. At present, the prognosis of breast cancer patients has not been studied from the perspective of glycolysis and gluconeogenesis-related pathways.
Therefore, in this paper, we investigate the relationship between glycolysis, gluconeogenesis-related genes, and prognosis in breast cancer patients. It is hoped that a new gene signature related to glycolysis and gluconeogenesis will be established to predict the prognosis of breast cancer patients. In addition, we have developed a nomogram that can predict the survival rate of breast cancer patients.
Materials and methods
Data collection and pre-processing
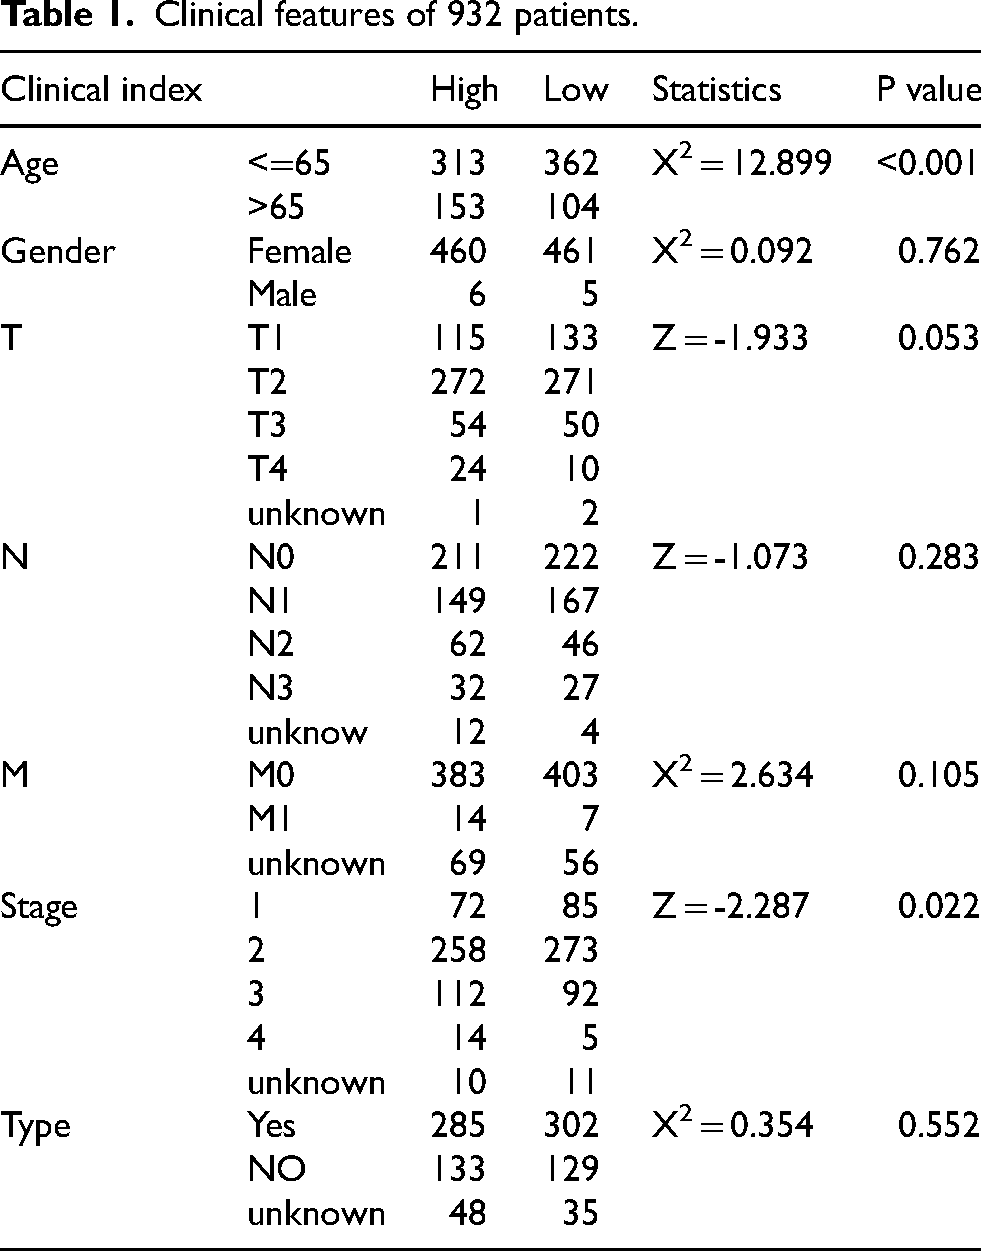
First, we downloaded RNA-seq data from the TCGA database (https://portal.gdc.cancer.gov/) for 1,226 breast cancer patients (removing duplicate and pan cancer samples, leaving 1,091 samples), single nucleotide variant data for 992 patients, and clinical information for 1,095 patients. Ultimately, 932 samples with both transcriptomic information, single nucleotide variants and clinical information were selected. Clinical information for 932 patients was shown in Table 1. Gene expression profiles and clinical information for GSE42568 (104 breast cancer samples) were downloaded from the GEO as an independent validation cohort for gene signature validation.
Clinical features of 932 patients.
GSVA analysis of glycolysis and gluconeogenesis-related pathways
Download glycolysis and gluconeogenesis-related pathways from MSigDB (https://www.gsea-msigdb.org/gsea/msigdb/index.jsp). A total of 932 patients were scored by the software package “GSVA” (version 4.3.0). The median for each pathway was calculated as WP_GLYCOLYSIS_AND_GLUCONEOGENESIS: −0.202, KEGG_GLYCOLYSIS_GLUCONEOGENESIS: −0.168, HALLMARK_GLYCOLYSIS: −0.181 and REACTOME_GLYCOLYSIS: −0.182.
Extraction of differential expression genes
With the median obtained by GSVA analysis, we divided 932 patients into high and low expression groups and looked for differential expression genes in the high and low expression groups by the T-test. The differential expression genes of the 4 pathways were demonstrated by volcano plots (Figure 1).
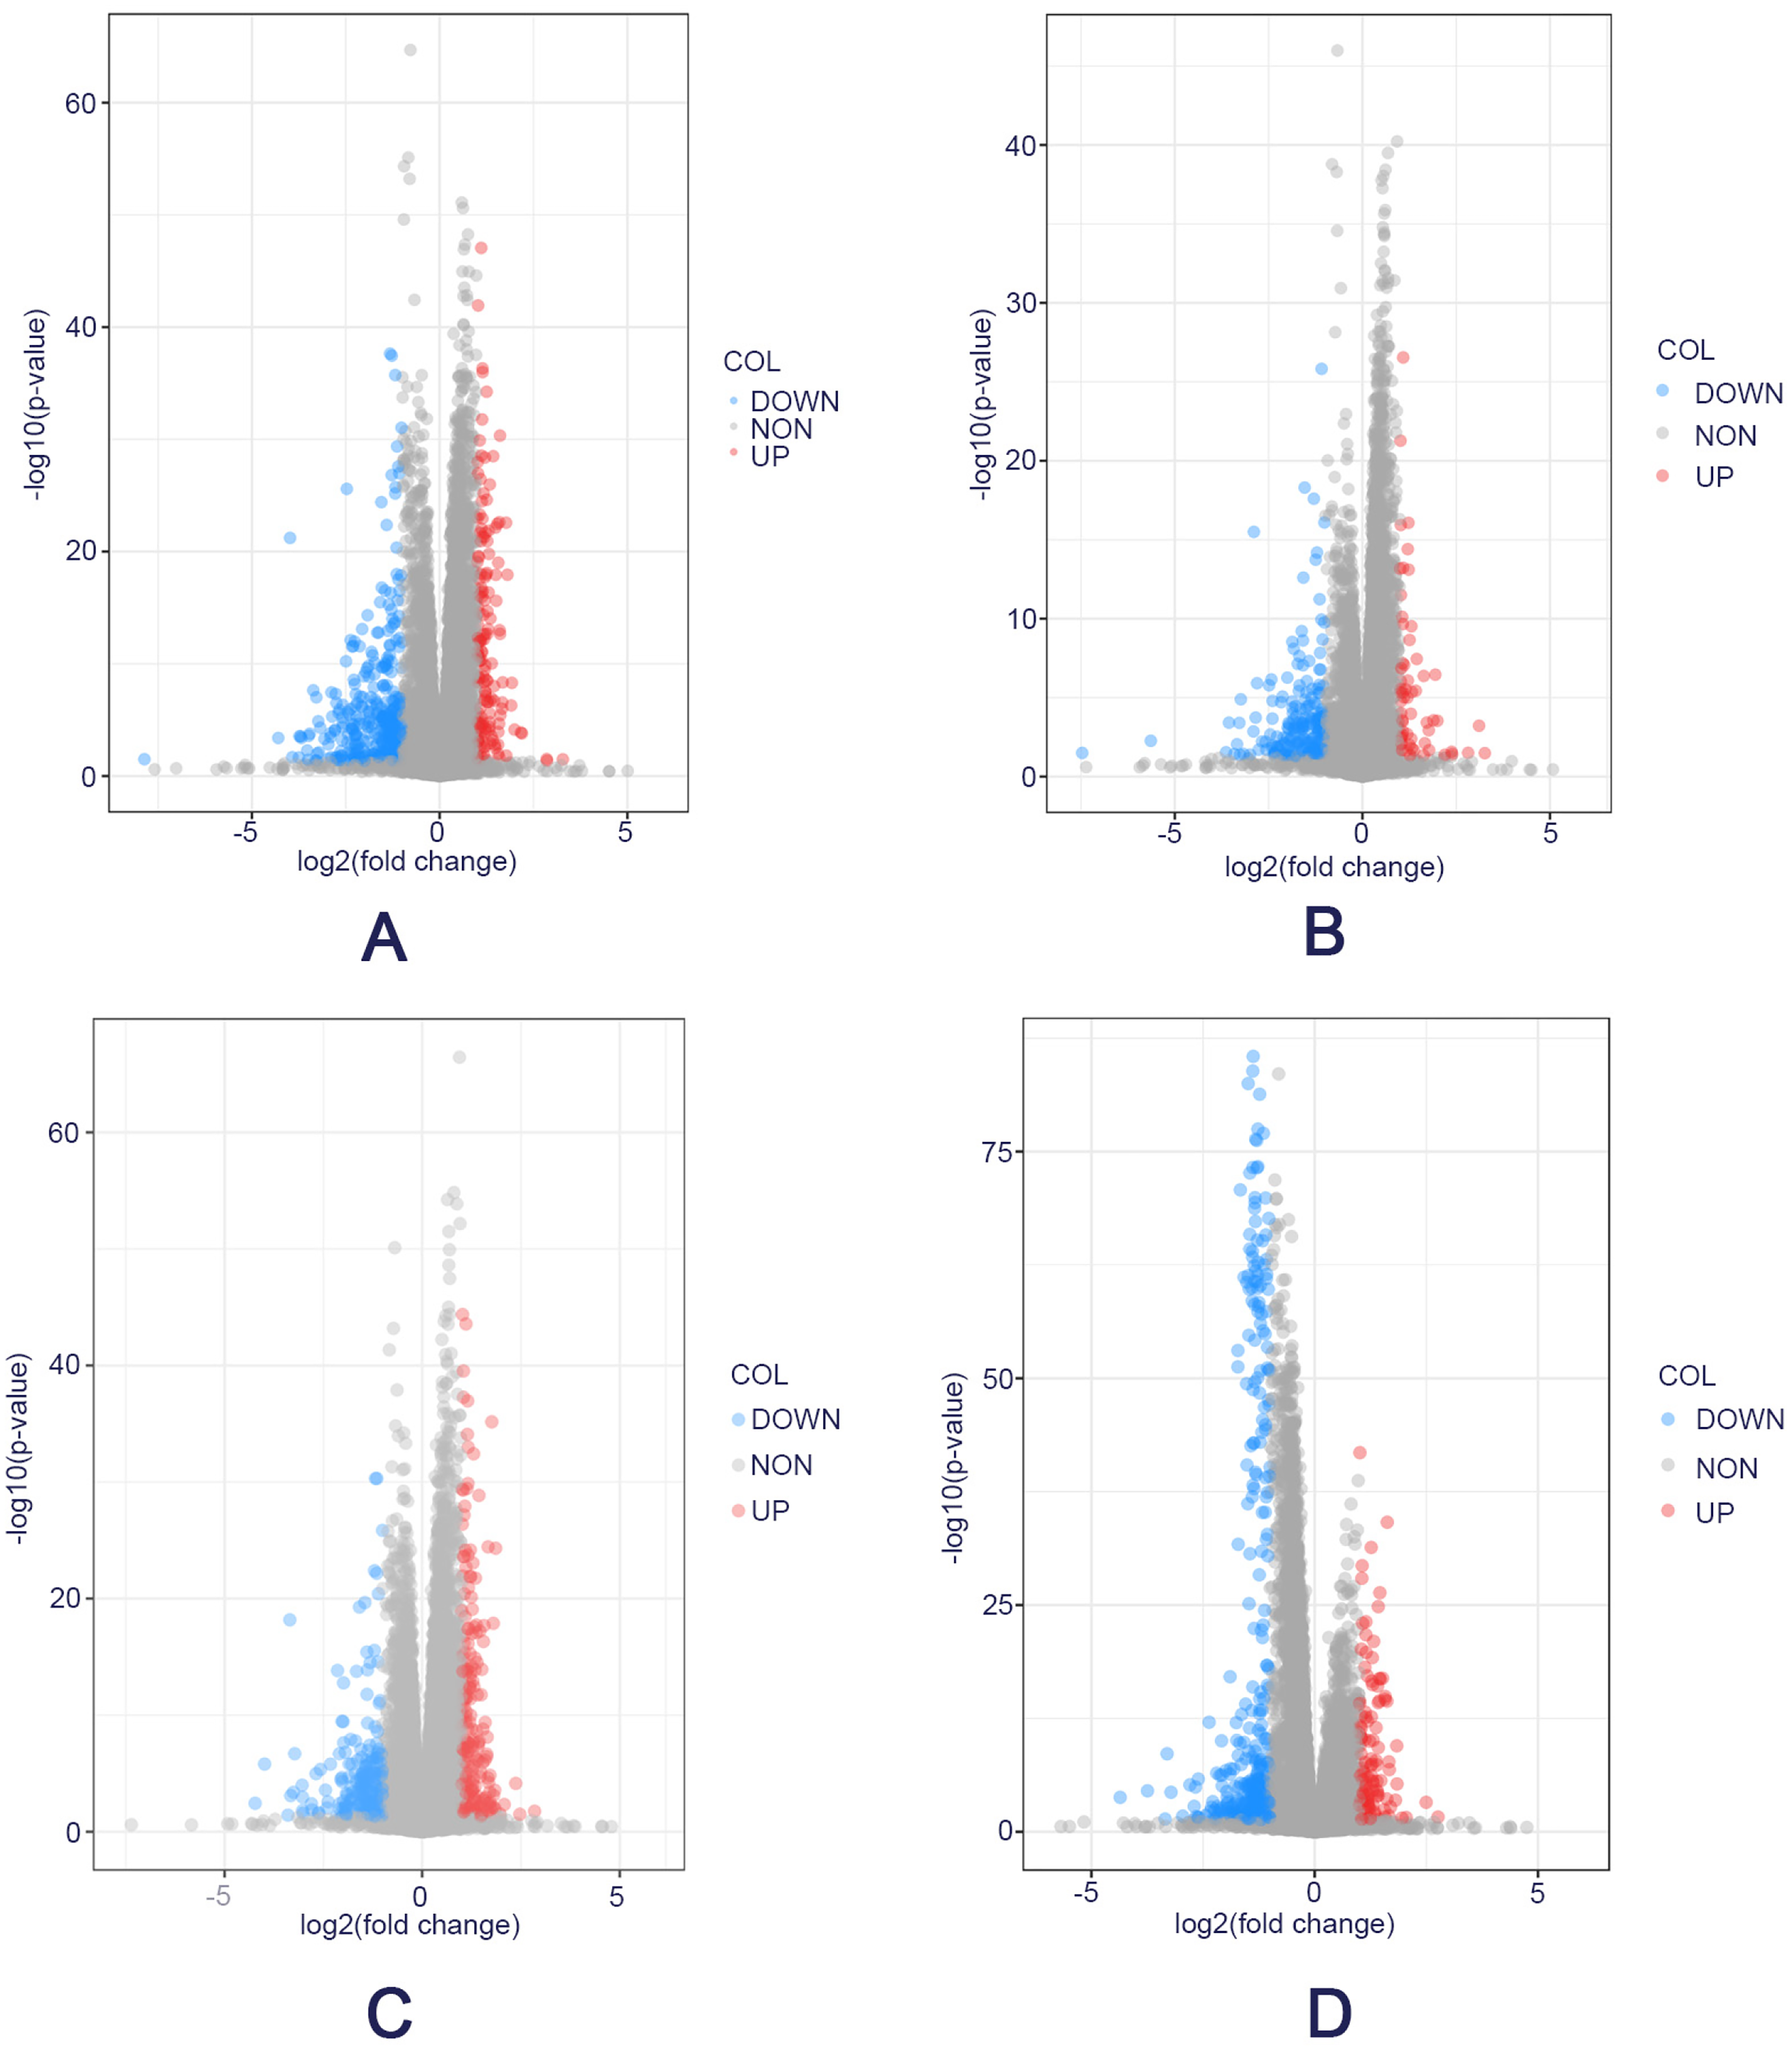
Differential expression genes of four glycolytic and gluconeogenic pathways. A. Differential expression gene map of the WP_GLYCOLYSIS_AND_GLUCONEOGENESIS pathway. B. Differential expression gene map of the KEGG_GLYCOLYSIS_GLUCONEOGENESIS pathway. C. Differential expression gene map of the HALLMARK_GLYCOLYSIS pathway. D. Differential expression gene map of the REACTOME_GLYCOLYSIS pathway.
Next, we took the intersection of the up-regulated and down-regulated genes in each pathway and ended up with 85 genes. Among the four pathways, there were 13 up-regulated gene intersections and 72 down-regulated gene intersections. A Venn diagram was used to demonstrate intersecting genes (Figure 2).

Intersection of differential genes shown in Venn diagrams. A. Up-regulation of the intersection of differential expression genes, resulting in 13 genes. B. Down-regulation of the intersection of differential expression genes, resulting in 72 genes.
Functional annotations for DEGs
To explore the functions of the intersecting genes, we performed GO enrichment and KEGG enrichment pathway analysis.
Modeling prognostic risk
To further understand the effects of glycolysis and gluconeogenesis genes on the prognostic survival of breast cancer patients, we used breast cancer patients obtained from the TCGA database as a training cohort and breast cancer patients obtained from the Gene Ontology Database as a validation cohort to further confirm our findings. First, we performed the Univariate COX regression analysis on the above differential expression genes, compared single genes with overall survival (P < 0.05) as a consideration. The selected genes with clinical significance for prognosis survival were further filtered by the LASSO algorithm to obtain specific genes. Finally, the specific genes were analyzed by the Multivariate COX regression analysis (P < 0.05), and the specific genes were analyzed as the overall factor and the overall survival rate, and the influence on the overall survival rate was evaluated as a whole. The last selected genes were combined with the corresponding regression coefficients to establish a prognostic risk model. The prognostic model was established as follows: β1*mRNA gene level gene1+β2*mRNA gene level gene2+ + …+βn*mRNA level genen, where β corresponds to the correlation coefficient. The risk score (RS) for each patient was calculated according to the prognostic model to assess whether it can be used as an independent prognostic factor. In addition, the constructed risk model was externally verified through the Gene Ontology Database to ensure the accuracy of the model.
Creating a nomogram
Use the R package “rms” for nomogram drawing. The graph is divided into two parts, the upper half is the scoring of each factor, and the second half is the prediction system of patient survival. With this graph, researchers and doctors can accurately predict the 1-, 2-, 3-, 5- and 10-year survival rates of breast cancer patients from the overall score in the model, both calibration curves and C-Index values were used to show the accuracy of survival prediction.
MRNA biomarkers pan-cancer analysis
MRNA biomarkers constructing prognostic survival models were selected for pan-cancer analysis to explore the role of these mRNA biomarkers in 33 cancers. The transcriptome data of 33 cancers were downloaded from the TCGA database, and the expression levels of these mRNA biomarkers in 33 cancers were extracted using Perl software. The “limma” package of R software was used to identify the differential expression of mRNA biomarkers in normal and tumor samples, and the clinical prognostic significance of mRNA biomarkers was analyzed using Kaplan-Meier in combination with the clinical information of TCGA. The “estimate” package was used to explore the relationship between mRNA biomarkers and the immune subtypes and stem cell indices of the tumor immune infiltration microenvironment. By using the “CellMiner” database, this study analyzed the potential correlation between gene expression levels of mRNA biomarkers in different human cancer cell lines and drug sensitivity.
Statistical analysis
Statistical analysis was performed using R (version 4.3.0). P < 0.05 was considered as statistically significant difference. Patients’ clinical factors were analyzed by the Wilcoxon-Mann-Whitney U test or the Pearson X2 test. Differences in survival time were assessed using the Kaplan-Meier method, and differences between survival curves were tested using the log-rank test. The specificity and sensitivity of the risk score model was measured by calculating the area under the curve (AUC) of the time-dependent subject operating characteristic (ROC) curves. The R package “rms” was used to construct a nomogram. The package “corrplot” was used to explore interactions among biomarkers, and the Spearman correlation test was used to assess the correlation between the expression of mRNA biomarkers and matrix scores, dryness scores, and drug sensitivity.
Results
Determination of required sample information
Finally, we identified 932 samples with complete transcriptome information, single nucleotide variant data and clinical data for subsequent analysis. Relevant patient information was shown in Table 1.
GSVA scores were performed on 4 glycolytic and gluconeogenic pathways
Glycolysis and gluconeogenesis-related pathways were obtained by MSigDB, and 932 patients were scored by “GSVA”. The sample was divided into high-group and low-group by the median value of the “GSVA” score. The differential expression genes between the high and low groups were analyzed by the T-test, and the results were represented by a volcano plot (Figure 1). After obtaining the differential expression genes, the intersection of up-regulated genes and down-regulated genes in the four pathways was taken, and the results were represented by Venn plots (Figure 2). The results of enrichment analysis of differential genes were shown in Figure 3.
Establishment and validation of prognostic models
We used the TCGA database as the training set to build the prognostic model, and the Gene Ontology Database as the validation set to verify the reliability of the model. The obtained differential expression genes were further screened by Univariate COX regression, and the genes with clinical significance in the patient's survival prognosis were incorporated into the LASSO algorithm to establish an optimal prediction model. It was found that 10 genes were protective of prognosis, namely FLT3, ARHGAP, GREB1L, LRRC4C, CLIC6, BTG2, HACD1, EGR3, CLEC6A, and KCNE1B. While CP, DNAH11, LCT, DSG3, MLIP, ADM, AKR1E2, FUT3, CALML5, HEPHL1, HPDL, KRT16, ARL9, MMP1, KRT6A, CSAG2 and EEF1AKMT4 were risk factors for prognosis (Figure 4(A)). After that, we performed Multivariate COX regression analysis again for the 9 genes obtained, and the genes that affected the overall survival rate were included in the establishment of the risk model. Therefore, the final risk score model formula was established by the Multivariate Cox regression results: risk score = 0.043328455 * mRNA level of AKR1E2 + 0.017502106 * mRNA level of ARL9 – 0.438689777 * mRNA level of CLEC6A −0.000689601 * mRNA level of CLIC6 + 0.001265205 * mRNA level of CP + 0.1817638 * mRNA level of CSAG2 + 0.087339241 * mRNA level of DNAH11 - 0.094572566 * mRNA level of HACD1 + 0.037844812 * mRNA level of HEPHL1. According to the established risk prediction model, each patient was scored to obtain the corresponding risk score.

Results of GO and KEGG enrichment analysis. A. Results of GO enrichment analysis (Top 6 most significant pathways in the pathway). B. Results of KEGG enrichment analysis.

Screening of characteristic genes. A. Univariate Cox regression analysis. B. lasso regression analysis. C. Cvfit diagram. D. Multivariate Cox regression analysis.
Patients from the TCGA dataset and GEO dataset were divided into high-risk and low-risk groups, according to the median risk score. Through the KM curve, it was explored whether this group could be used as an independent factor for prognosis for subsequent analysis. In the training dataset, patients in the high-risk group were observed to have lower survival rates than those in the low-risk group (Figure 5(A)). To ensure the accuracy of the results, we also conducted external verification. In the validation dataset GSE42568, only 6 candidate genes matched except CLEC6A, HACD1, and HEPHL1. The results were consistent with the training results, patients with low glucose metabolism had a good prognosis (Figure 5(C)). In addition, to test the predictive effect of the prognostic model, we also performed ROC curve analysis (Figure 5(B)). The AUC results for 2-, 3-, and 5-year overall survival predictions in the TCGA dataset were 0.801, 0.776, and 0.758. In GSE42568, the AUC outcomes for 2-, 3-, and 5-year overall survival predictions were 0.685, 0.650, and 0.688.(Figure 5(D)). The results showed that the prognostic effects were good and available, proving that the model could effectively and accurately predict the survival of breast cancer patients.

Construction and validation of prognostic models. A. KM survival analysis results of OS in a training dataset. B. Time-dependent ROC curve of OS for the training dataset. C. KM survival analysis of OS on external datasets. D. Time-dependent ROC curves of OS for the external datasets.
Application of Nomogram
In order to make the results applicable to clinicians, based on the risk prediction model we established combined with clinical factors, we constructed a specific nomogram chart to provide a reference for clinical healthcare workers. After analysis, we built a personalized prediction map based on independent predictors: risk score, age, type of treatment, stage, etc. Figure 6(A) could independently predict the survival rate of breast cancer patients at 1-,2-, 3-, 5-, and 10-years by scoring. In Figure 6(B), through the calibration curve, it could be seen that the training set and the validation set had a high degree of coincidence, showing the accuracy of the prediction accuracy. Figure 6(C) further verifies the accuracy of our prediction model through the C index, which predicts that the C index of the model is 0.811, the C index of RiskScore is 0.735, the C index of Stage is 0.682, the C index of Age is 0.633, and the C index of Type is 0.517. It is clear from the results that the accuracy of our predictive model is higher than that of any predictive model, which once again verifies the accuracy of our model.
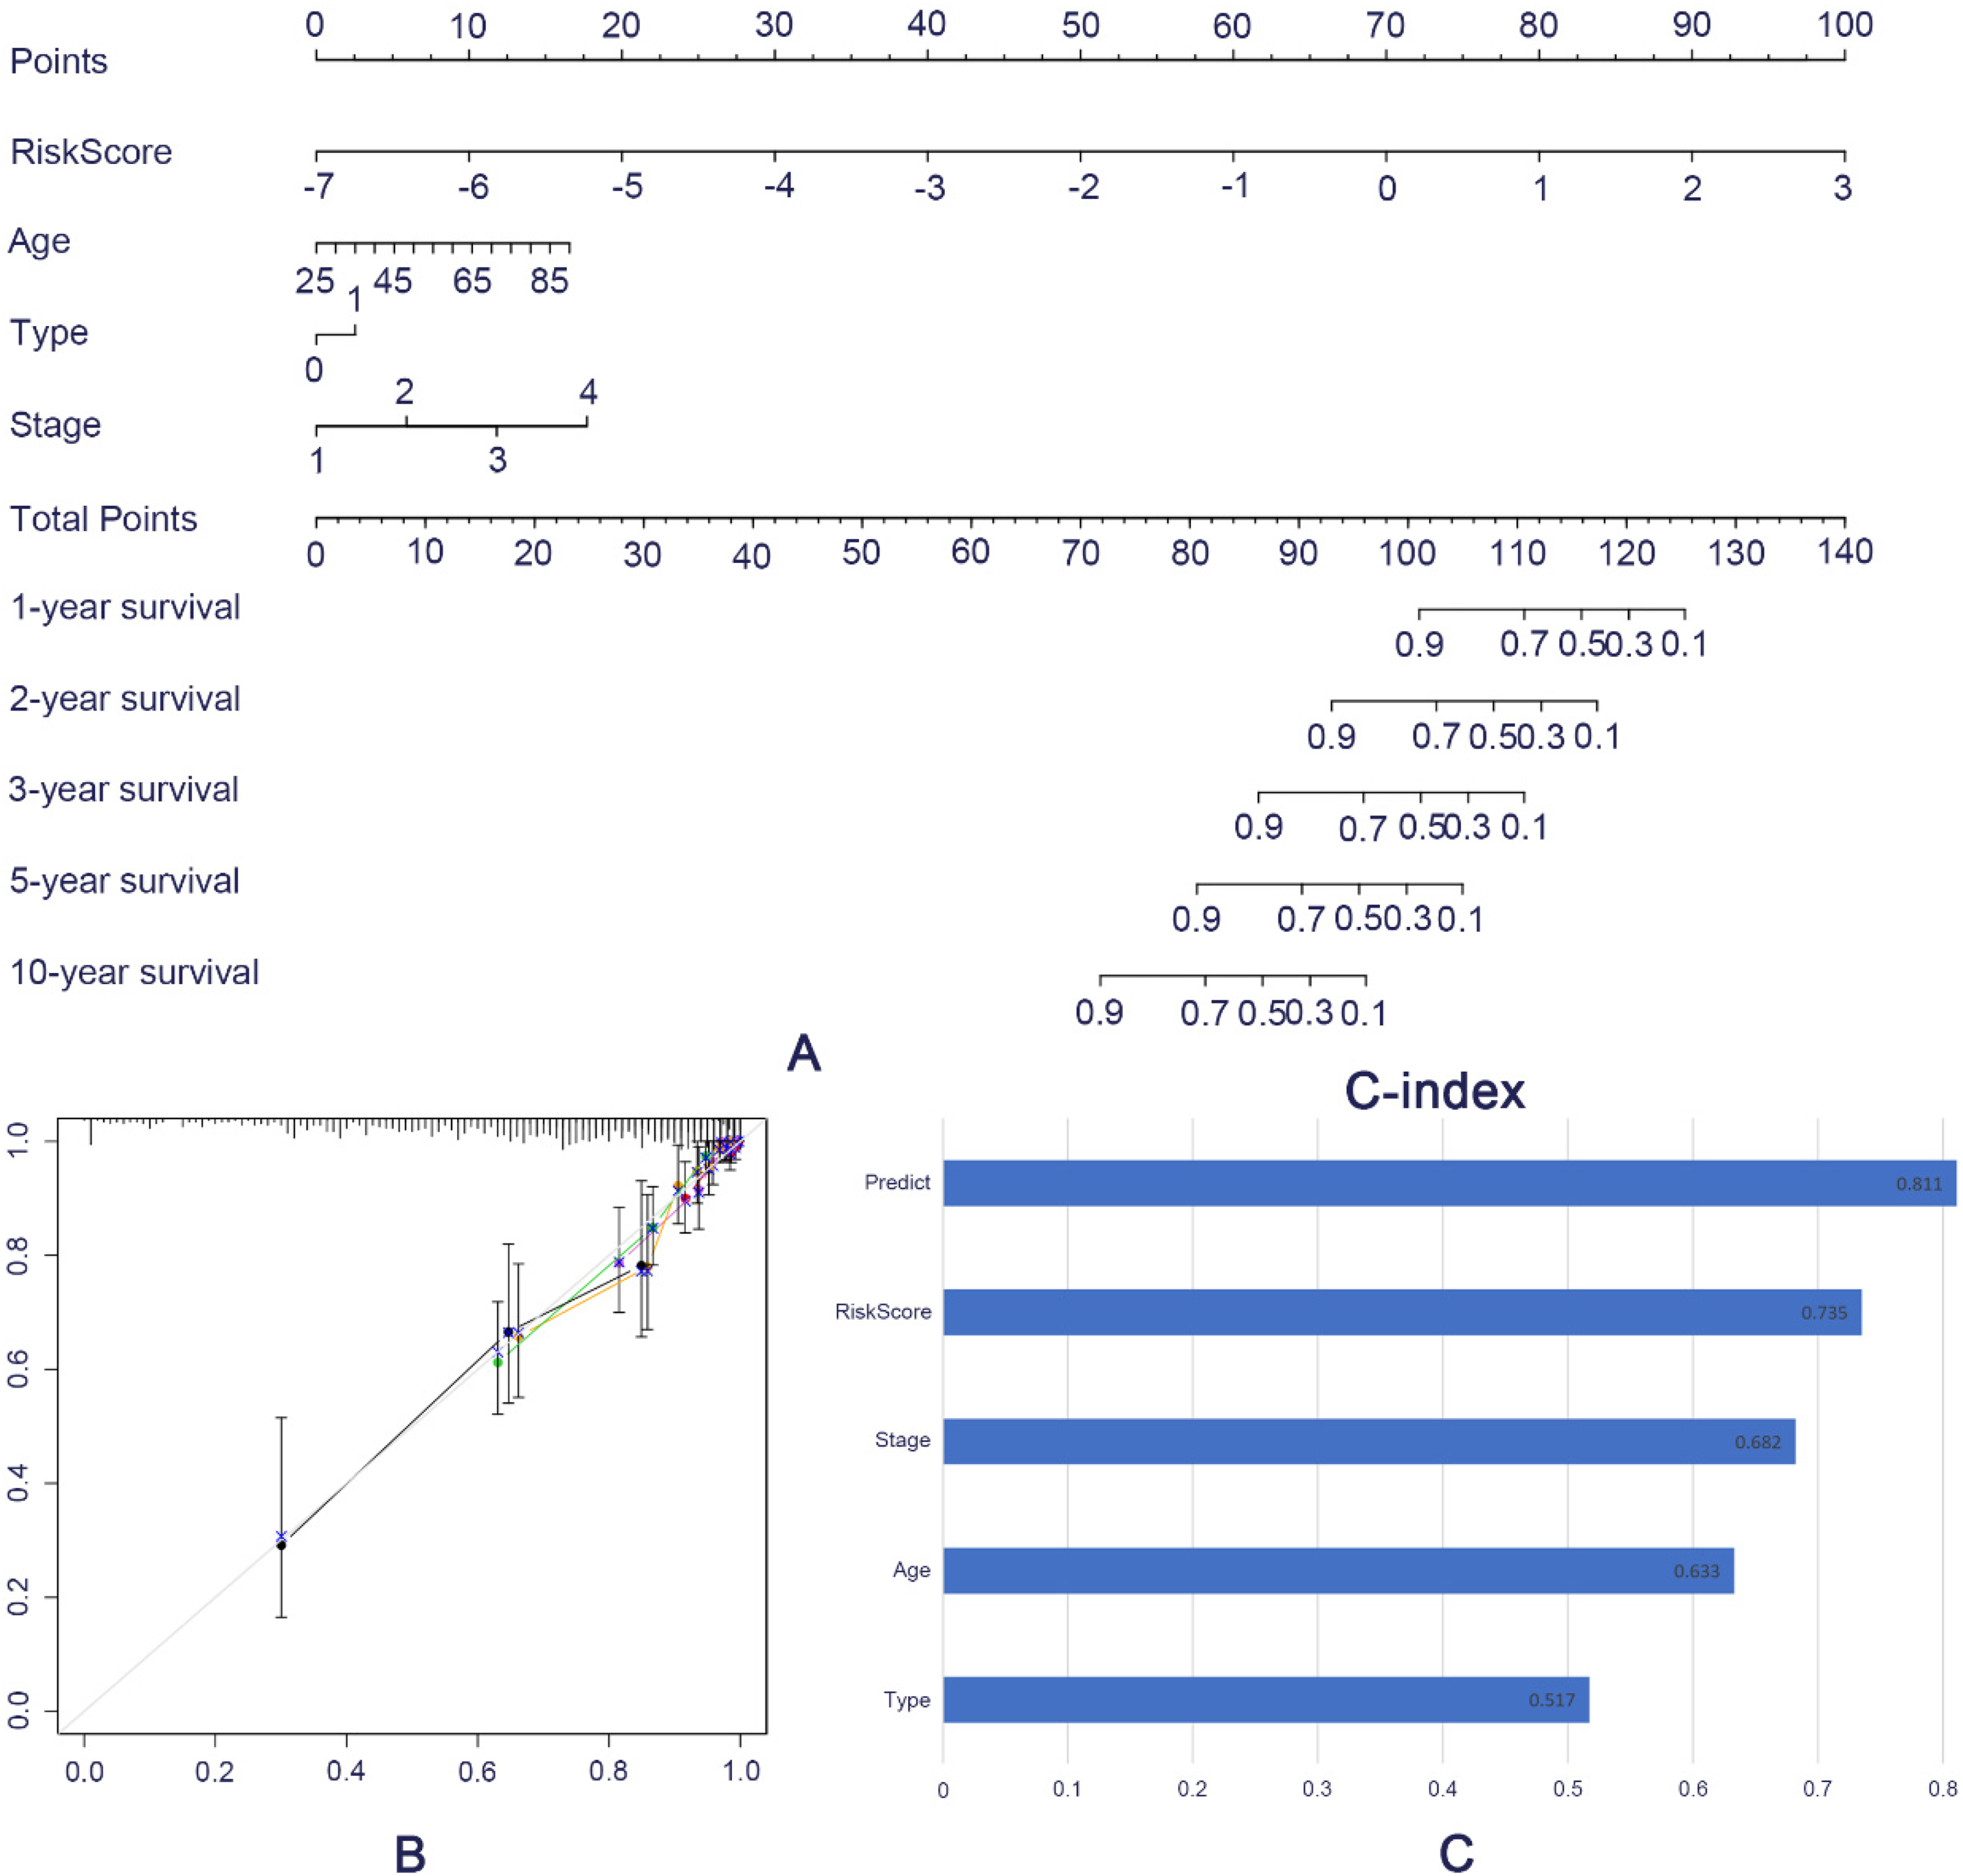
Establishment of Nomogram. A. Nomogram chart predicts the prognostic survival of patients. B. The calibration chart compares the difference between predicted and actual values. C. The C-index assesses the prognostic model and the predictive performance of various clinical factors (Type refers to whether or not you have received chemoradiotherapy)
Differential expression analysis of mRNA biomarkers in pan-cancer
Expression levels of mRNA biomarkers in 33 cancers are shown in Figure 7 (The full names and abbreviations of the 33 cancers are in Supplemental Table 1). The results show that the overall expression levels of CP and CLIC6 in the 33 cancer types exhibited high expression relative to other subtypes, as shown in Figure 7(A). The expression patterns of the mRNA biomarkers in breast cancer are shown in Figure 7(B), where CP and CLIC6 showed high expression levels in breast cancer relative to other mRNA biomarkers, consistent with the above expression in pan-cancer. The expression of the mRNA biomarkers in other cancers was further showed in the Supplemental Figure 1.

Expression of mRNA biomarkers in cancers. A. Overall expression levels of mRNA biomarkers in 33 cancers. B. Expression levels of mRNA biomarkers in breast cancer
Differential analysis of mRNA biomarkers in normal and tumor samples in a variety of cancers showed that AKR1E2 was highly expressed in BLCA, CESC, CHOL, COAD, ESCA, HNSC, KIRC, KIRP, LUAD, LUSC, PAAD, PCPG, READ, SARC and STAD, and was lowly expressed in BRCA, GBM, KICH, LIHC, PRAD, THCA and THYM; ARL9 was highly expressed in BLCA, CHOL, COAD, ESCA, HNSC, KICH, LIHC, LUAD, LUSC, PCPG, SARC, STAD, THCA and UCEC, and was lowly expressed in CESC, GBM, KIRC, KIRP, PAAD, PRAD, READ, and UCEC; CLEC6A was highly expressed in BLCA, BRCA, CHOL, COAD, ESCA, HNSC, STAD, THCA and UCEC, and was lowly expressed in KICH, KIRC, KIRP, LUAD, LUSC and PRAD; CLIC6 was highly expressed in CESC, CHOL, GBM, KIRP, LUAD and PCPG, and was lowly expressed in BLCA, BRCA, COAD, ESCA, HNSC, KICH, KIRC, LIHC, LUSC, PAAD, PRAD, READ, SARC, STAD, THCA and UCEC; CP was highly expressed in ESCA, GBM, KIRC, LUAD, LUSC, STAD and UCEC, and was lowly expressed in BLCA, BRCA, CESC, CHOL, COAD, HNSC, KICH, KIRP, LIHC, PAAD, PCPG, PRAD, READ, SARC, SKCM, THCA and THYM; CSAG2 was highly expressed in BLCA, BRCA, CESC, CHOL, COAD, ESCA, GBM, HNSC, KICH, KIRC, LIHC, LUAD, LUSC, PAAD, PCPG, READ, SARC and STAD, and was lowly expressed in THCA and THYM; DNAH11 was highly expressed in CESC, CHOL, ESCA, GBM, KIRC, LIHC, LUAD, SARC, STAD, SKCM and UCEC, and was lowly expressed in BRCA, COAD, HNSC, KICH, KIRP, LUSC, PAAD, PCPG, PRAD, READ, THCA and THYM; HACD1 was highly expressed in CHOL, HNSC, KIRP, PCPG and THCA, and was lowly expressed in BLCA, BRCA, CESC, COAD, ESCA, GBM, KICH, KIRC, LIHC, LUAD, LUSC, PAAD, PRAD, READ, SARC, STAD, THYM and UCEC; HEPHL1 was highly expressed in BLCA, CESC, CHOL, COAD, ESCA and GBM, and was lowly expressed in KICH, KIRC, PCPG, SKCM, THCA and THYM, see Supplemental Figure 2. The interactions among mRNA biomarkers were clarified by correlation analysis, see Figure 8, in which CP was negatively correlated with HACD1, HEPHL1 and ARL9, CLIC6 was negatively correlated with CSAG2, and the rest of the mRNA biomarkers were positively correlated with each other.

Correlation analysis between HEPHL1, AKR1E2, HACD1, CLIC6, CP, CLEC6A, CSAG2, ARL9, DNAH11.
Survival analysis of mRNA biomarkers in pan-cancer
Survival analysis of HEPHL1, AKR1E2, HACD1, CLIC6, CP, CLEC6A, CSAG2, ARL9, and DNAH11 in pan-cancer was investigated by Kaplan-Meier analysis, and is shown in Supplemental Figure 3. The results showed that HEPHL1 high-expression was significantly correlated with the poor prognosis of OS in patients with BLCA, LGG, and LIHC (P = 0.017,P = 0.050,P = 0.023), HEPHL1 low expression was significantly correlated with poor OS prognosis in LAML patients (P = 0.034); AKR1E2 high expression was significantly correlated with poor OS prognosis in BRCA, ESCA, and OV patients (P = 0.029,P = 0.034, P = 0.045); and HACD1 high expression was correlated with CESC, HNSC patients with poor OS prognosis (P = 0.025, P = 0.049), HACD1 low expression was significantly associated with poor OS prognosis in OV patients (P = 0.011); CLIC6 high expression was significantly associated with poor OS prognosis in CHOL, LAML, LGG patients (P = 0.005, P = 0.044, P = 0.040), CLIC6 low expression was significantly associated with poor OS prognosis in KIRP, LUAD and PAAD patients (P = 0.004,P = 0.020,P = 0.029); high expression of CP was significantly associated with poor prognosis of CHOL, LGG and PCPG patients (P = 0.002,P = 0.004, P = 0.041), and low expression of CP was significantly associated with poor prognosis of LAML and MESO patients (P = 0.004,P = 0.017); and low expression of CLEC6A was significantly correlated with poor prognosis of HNSC patients (P = 0.008), high expression of CLEC6A was significantly correlated with poor prognosis of LGG patients (P = 0.040); high expression of CSAG2 was significantly correlated with poor prognosis of KIRP patients (P = 0.005); high expression of ARL9 was significantly associated with poor prognosis in LGG patients (P < 0.001); high expression of DNAH11 was significantly associated with poor prognosis in LGG and MESO patients (P < 0.001, P = 0.025).
Relationship between mRNA biomarkers and immune subtypes and stem cell index of tumor immune infiltration microenvironment
Tumor microenvironment was assessed using the “estimate” package, and it was found that in breast cancer, ARL9, CSAG2 were negatively correlated with stromal scores, the more the genes were expressed, the lower the content of stromal cells, and CLEC6A, CLIC6, and CP were positively correlated with stromal scores, the more the genes were expressed, the higher the stromal cells were, as shown in Figure 9. HEPHL1, AKR1E2, HACD1, CLIC6, CP, CLEC6A, CSAG2, ARL9, and DNAH11 correlated with stromal cells in other cancers are shown in Supplemental Figure 4.
Tumor stem cells are cell subtypes that possess the potential for self-renewal and differentiation, and are capable of driving tumor growth and metastasis Figure 9. In ACC, BLCA, CESC, CHOL, COAD, DLBC, ESCA, GBM, KIRC, LIHC, LUSC, MESO, PCPG, READ, SARC, TGCT, and UCS, most of the genes were negatively correlated with DNAsi, the more genes were expressed, the lower the DNAsi index was, and the weaker the stem cell characteristics, the higher the differentiation degree was higher; while in HNSC, KIRP, LAML, LGG, LUAD, PRAD, SKCM, STAD, THYM, UCEC, UVM, most gene isoforms were positively correlated with DNAsi, the more the genes were expressed, the higher the DNAsi index was, the stronger the stem cell characteristics were, and the lower the degree of differentiation was (Figure 10(A)). In BLCA, CESC, COAD, DLBC, GBM, KICH, KIRC, KIRP, LGG, LIHC, LUSC, PAAD, PRAD, READ, SARC, SKCM, TGCT, THCA, THYM, UCEC, UCS, and UVM, most of the genes were negatively correlated with RNAsi, the more the genes expressed, the lower the RNAsi index, the weaker the stem cell characteristics and the higher the degree of differentiation; in BRCA, LAML, LUAD, PCPG, most of the genes subtypes were positively correlated with RNAsi, the more the genes were expressed, the higher the RNAsi index, the stronger the stem cell characteristics, and the lower the degree of differentiation (Figure 10(B)).

Correlation of ARL9, CLEC6A, CLIC6, CP and CSAG2 with stromal cells in breast cancer. A. Correlation of ARL9 with stromal cells. B. Correlation of CLEC6A with stromal cells. C. Correlation of CLIC6 with stromal cells. D. Correlation of CP with stromal cells. E. Correlation of CSAG2 with stromal cells.

Correlation between HEPHL1, AKR1E2, HACD1, CLIC6, CP, CLEC6A, CSAG2, ARL9, DNAH11 and DNAss, RNAss. A. Correlation between HEPHL1, AKR1E2, HACD1, CLIC6, CP, CLEC6A, CSAG2, ARL9, DNAH11 and DNAss. B. Correlation between HEPHL1, AKR1E2, HACD1, CLIC6, CP, CLEC6A, CSAG2, ARL9, DNAH11 and RNAss
The correlation of HEPHL1, AKR1E2, HACD1, CLIC6, CP, CLEC6A, CSAG2, ARL9, and DNAH11 with estimate score, stromal score, immune score, and DNAss with RNAss composite is shown below in breast cancer, CP, CLEC6A, CSAG2, ARL9, DNAH11 and estimate score, stromal score, immune score, DNAss and RNAss combined correlation is shown in Figure 11. Stromal Score is used to assess the level of stromal cell infiltration in tumor tissues, and a high stromal score suggests that the tumor has a strong growth and invasion. A high stromal score suggests that the tumor has strong growth and invasion ability, implying that the tumor microenvironment has active angiogenesis, which can provide sufficient blood supply for the tumor, suggesting that the tumor has strong immune escape ability; the Immune Score represents the level of immune cell infiltration in the tumor tissues; the level of the Immunity Score can reflect the degree of activity of the immune cells in the tumor tissues. The Estimate Score is a combination of the Stromal Score and the Stromal Score, which can be further analyzed in terms of tumor purity or the complexity of the overall tumor microenvironment. Tumors with higher estimate scores may have more complex microenvironments involving more stromal and immune cell interactions. Figure 11 shows that HPHL1, AKR1E2, HACD1, CLIC6, CP, CLEC6A, CSAG2, ARL9, and DNAH11 possessed a very strong correlation with the tumor immune-infiltration microenvironment. The correlation of HEPHL1, AKR1E2, HACD1, CLIC6, CP, CLEC6A, CSAG2, ARL9 and DNAH11 in other cancers with estimate score, stromal score, immune score, and DNAss vs. RNAss composite is shown in Supplemental Figure 5.

Correlation between HEPHL1, AKR1E2, HACD1, CLIC6, CP, CLEC6A, CSAG2, ARL9, DNAH11 and estimate, DNAss, RNAss in Breast cancer.
Immunological subtype subtypes C1-C6 are important in oncology and immunology studies and are often used to characterize the immune profile of different diseases or tumor types. In breast cancer, the expression of HEPHL1, AKR1E2, HACD1, CLIC6, CP, CLEC6A, CSAG2, ARL9, and DNAH11 in immune subtypes (C1∼C6) differed significantly (P < 0.05), and CP, CLIC6, AKR1E2, HACD1, HEPHL1, and CLEC6A were low in C4 expression, CP, DNAH11, AKR1E2, HEPHL1, ARL9, CLEC6A, and CSAG2 were highly expressed in C2, and CP, CLIC6, AKR1E2, HACD1, HEPHL1, ARL9, CLEC6A, and CSAG2 were moderately expressed in C1, C3, and C6, as shown in Figure 12. In other cancers, most mRNA biomarkers are also expressed at low levels in C4, high levels in C2, and moderate levels in C1, C3, and C6, see Supplemental Figure 6.
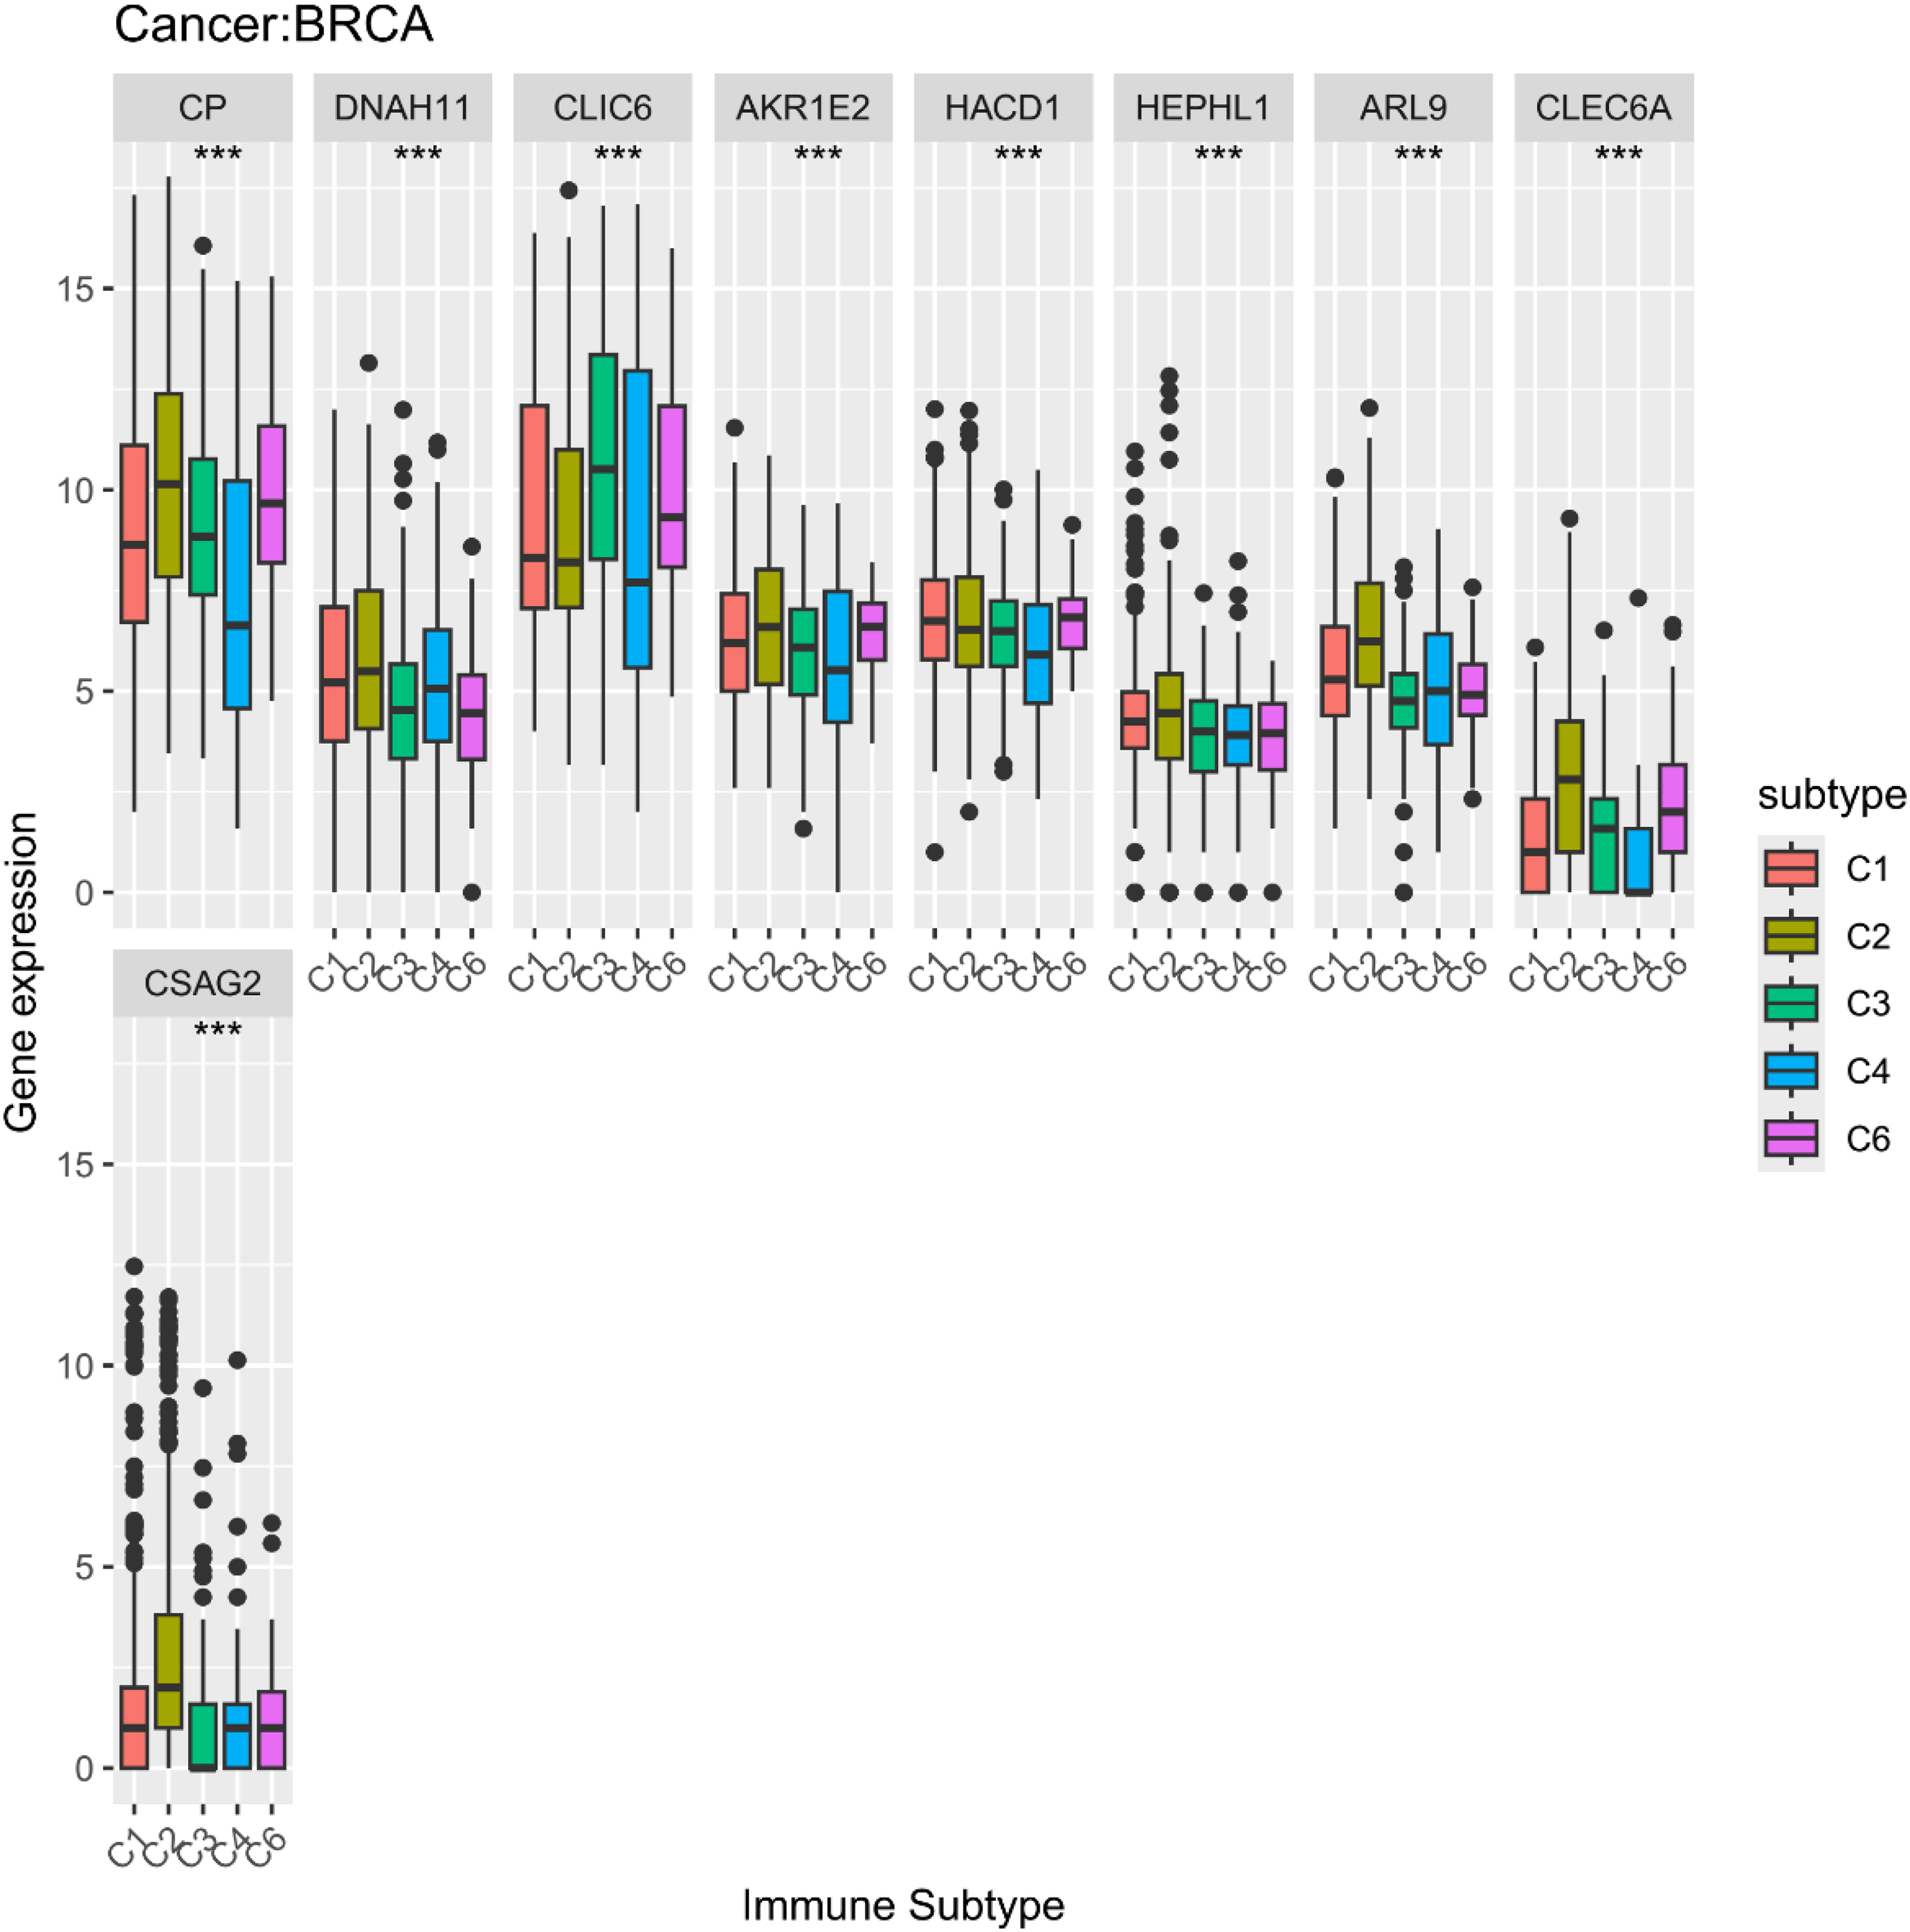
Differential expression between HEPHL1, AKR1E2, HACD1, CLIC6, CP, CLEC6A, CSAG2, ARL9, DNAH11 and Immunological subtypes in Breast cancer
Drug sensitivity analysis of mRNA biomarkers
By using the CellMiner database, this paper analyzed the potential correlation between the gene expression levels of HEPHL1, AKR1E2, HACD1, CLIC6, CP, CLEC6A, CSAG2, ARL9, and DNAH11 with drug sensitivity in different human cancer cell lines, as shown in the Supplemental Figure 7. The results showed that HEPHL1, HACD1, CLIC6, CP, CLEC6A, ARL9, and DNAH11 were correlated with drug sensitivity, in which the expression of ARL9 was associated with uthionine sulphoximine, Econazole Nitrate, Masoprocol, Hydrastinine HCl, LY-294002, OSI-027, Parthenolide, TESTOLACTONE, and Ibrutinib were positively correlated with drug sensitivity; CLEC6A expression was negatively correlated with drug sensitivity of (+)-JQ1 and positively correlated with drug sensitivity of norvir; CLIC6 expression was positively correlated with drug sensitivity of LY-2606368, Acrichine negatively correlated with the drug sensitivity of Lificguat, Vandetanib, Sonolisib, Erlotinib, CCT-128930, Idelalisib, Everolimus, Saracatinib; the expression of CP positively correlated with the drug sensitivity of Lificguat, Vandetanib, Sonolisib, Erlotinib Sonolisib, Erlotinib, CCT-128930, Idelalisib, Everolimus, Saracatinib; and the expression of DNAH11 was positively correlated with the drug sensitivity of Cisplatin, Carboplatin, Lovastatin; HACD1 expression was positively correlated with XR-5944, geldanamycin analog, Vinblastine, Tanespimycin, Tamoxifen, Colchicine, Eribulin mesilate, Vincristine, Quisinostat, DOLASTATIN 10, GSK-461364, Panobinostat, Actinomycin D, Mebendazole, Paclitaxel, Alvespimycin, TAK Plk inhibitor, Fluorouracil, Homoharringtonine, Pipamperone, and VINORELBINE were significantly negatively correlated with drug sensitivity; HEPHL1 expression was significantly negatively correlated with drug sensitivity of Epothilone B, Asparaginase, CUDC-305, and Etoposide.
Discussion
Breast cancer is a disease with high morbidity and mortality and is highly heterogeneous. Cancer cells are more dependent on obtaining energy from glucose metabolism. The tumor microenvironment, which includes tumor cells and their extracellular matrix, various immune cells and inflammatory factors, interacts with tumor cells to promote tumor progression and stimulate tumor cell heterogeneity. Biomarkers play a crucial role in the development of various cancers. In this paper, we investigated biomarkers with independent prognostic effects on breast cancer by screening glycolytic pathway genes through transcriptomics data obtained from TCGA, and also investigated their relationship with the tumor microenvironment.
In our study, we constructed a survival prediction model for breast cancer patients. The model consisted of multiple genes that had been reported to be involved in tumorigenesis and progression. In order to explore the function and metabolic changes of differential expression genes with high glucose metabolism and low glucose metabolism, this study performed a functional enrichment analysis of all differential expression genes. The 18 GO classifications with the highest degree of enrichment were shown in Figure 3. The classification with the highest degree of differential gene enrichment were cell, cell composition, biosynthesis, amino acid transport, and organic biosynthesis, revealing changes in cell status in breast cancer patients as well as changes in their own anabolism. The occurrence of cancer was accompanied by changes in metabolism in the body, and chronic cancer was one of the drivers of carcinogenesis. Interleukin was a factor involved in cell signaling during homeostasis and disease, and interleukin signaling in cancer cells was related to tumor growth, metastasis and spread mechanism, which could promote inflammation-induced carcinogenesis, induce the proliferation and invasion of cancer cells, and prevent apoptosis. KEGG enrichment analysis of differential expression genes showed that differential expression genes were significant in two pathways (P < 0.05), enriching in neural receptor ligand activity and cytokine cytokine receptor activity. In summary, cytokines were key factors in coordinating TME and controlling tumor-immune cell interactions. The study of cytokines in tumor biology could help better understand their mechanism of action and contribute to the development of better treatment strategies for clinicians. In addition, we had constructed a nomogram, combining gene signatures and clinical factors, to have better predictive accuracy for patients’ prognosis and help in the early diagnosis of current breast cancer. The calibration curve showed how numerically consistent the predicted probability with the actual result. And the easy availability of factors made the predictive model more widely available.
In this study, biomarkers related to glycolysis and gluconeogenesis were studied using the transcriptome data of breast cancer in the TCGA database, and a survival model associated with the survival prognosis of breast cancer patients was constructed, and a nomogram was constructed combining clinical characteristics to predict the survival rate of patients. In addition, transcriptome data from 33 different tumors in the TCGA database were used to investigate the difference in expression of prognostic biomarkers in cancer and normal tissues. The expression levels of the 9 selected prognostic biomarkers showed significant heterogeneity within the tumor and between normal tissues. In some members with very high tumor expression level, it is closely related to the progression of cancer, such as ARL9 upregulation, which can be used as a biomarker of poor prognosis of colorectal adenocarcinoma 27 and low-grade glioma, 28 confirming the study in this paper; HEPHL1 is significantly upregulated in cutaneous squamous cell carcinoma and is considered a new potential biomarker and therapeutic target for cutaneous squamous cell carcinoma 29 ;Changes in HACD1 genome lead to differences in susceptibility to lung adenocarcinoma, and can be used as an independent prognostic indicator of lung adenocarcinoma, 30 uveal melanoma, 31 and breast cancer. 32 The expression of CLIC6 can be used as a biomarker for predicting the survival of lung adenocarcinoma,33,34 has potential diagnostic role in prostate cancer, 35 and can also be used as a diagnostic indicator for gastric cancer 36 ; CLEC6A, a target for cancer immunotherapy, is highly expressed in breast cancer and can be a good predictor of survival in breast cancer patients, consistent with the findings in this paper 37 ; Yang X found that CSAG2 is essential for the proliferation of cancer cells and promotes tumorigenesis in vivo, which laterally validates the findings of this paper 38 ; Zhang Y showed that CPEB4 induced CSAG2 expression and contributed to the high expression of CSAG2 in ovarian cancer, which helped to overcome paclitaxel-resistant ovarian cancer, showing that CSAG2 exhibits an important role in ovarian cancer 39 ; Verma S has identified the variant rs2285947 of the DNAH11 gene as a potential risk factor for ovarian and breast cancer in the study population, echoing the findings of this paper. 40 These findings suggest a need to study the biomarkers screened in this paper as individuals that are differentially expressed between different tumors and thus promote or inhibit tumorigenesis. Tumor immune microenvironment plays an important role in cancer progression and metastasis, and in TME analysis, this study used the ESTIMATE algorithm to calculate stromal and immune scores of pan-cancer patients for correlation analysis. The results showed that a variety of biomarkers were significantly positively or negatively correlated with stromal or immune scores in some tumors, suggesting that there are interactions between the screened biomarkers and tumor cells and immune cells, which provides new visions for the development of more effective therapeutic regimens. Stem cell indices correlate with active biological processes in cells, and the present study found that the expression of biomarkers in pan-cancer was also significantly positively or negatively correlated with RNAss and DNAss, and these results suggest that the combination of DNAss and RNAss can be used to identify the characteristics of different tumors. This study also explored the potential correlation between biomarkers and drug sensitivity, and found that the expression levels of prognostic biomarkers in breast cancer were correlated with the sensitivity to certain drugs, so that the detection of the expression of these biomarkers in tumor patients could be of particular guidance for the selection of clinical drugs.
However, the current study still had several limitations. A limited sample size could affect the training of the model. There were no experimental conditions to validate the model. With the widespread adoption of personalized predictive models, the parameters and predictors of the model may need to be updated to achieve higher prediction accuracy.
Conclusion
In summary, this study not only provides a tool for objectively predicting the survival rate of breast cancer patients, but also provides a theoretical basis for targeted therapy of BRCA. MRNA biomarkers to construct prognostic models play an important role in the progression of various tumors. Individualized predictive models are simple and accurate, and can be widely used in a wide range of clinical settings.
Supplemental Material
sj-docx-1-cbm-10.1177_18758592241296278 - Supplemental material for A Glycolysis and gluconeogenesis-related model for breast cancer prognosis
Supplemental material, sj-docx-1-cbm-10.1177_18758592241296278 for A Glycolysis and gluconeogenesis-related model for breast cancer prognosis by Penglu Yang and Xiong Jiao in Cancer Biomarkers
Supplemental Material
sj-docx-2-cbm-10.1177_18758592241296278 - Supplemental material for A Glycolysis and gluconeogenesis-related model for breast cancer prognosis
Supplemental material, sj-docx-2-cbm-10.1177_18758592241296278 for A Glycolysis and gluconeogenesis-related model for breast cancer prognosis by Penglu Yang and Xiong Jiao in Cancer Biomarkers
Footnotes
Acknowledgements
The authors thank the public datasets involved in the current study.
Author contributions
Penglu Yang: Conceptualization, Data curation, Formal analysis, Investigation, Software, Writing – original draft. Xiong Jiao: Methodology, Writing- Reviewing and Editing.
Funding
The authors disclosed receipt of the following financial support for the research, authorship, and/or publication of this article: Supported by Fundamental Research Program of Shanxi Province(Grant No. 202203021221063).
Declaration of conflicting interests
The author(s) declared no potential conflicts of interest with respect to the research, authorship, and/or publication of this article.
Availability of data and material
The data were retrieved from TCGA databases (https://portal.gdc.cancer.gov/) and the Gene Ontology database (![]() ).
).
Supplemental material
Supplemental material for this article is available online.
References
Supplementary Material
Please find the following supplemental material available below.
For Open Access articles published under a Creative Commons License, all supplemental material carries the same license as the article it is associated with.
For non-Open Access articles published, all supplemental material carries a non-exclusive license, and permission requests for re-use of supplemental material or any part of supplemental material shall be sent directly to the copyright owner as specified in the copyright notice associated with the article.