
Abstract
In lower-income settings, agricultural producers (those engaged in production of crops, livestock, fishing, hunting and gathering) are largely engaged in small-scale activities, and classified as informal under the 21st ICLS. Informal agricultural producers are not a homogenous group, however — although survey data is still lacking in individual-level information on key productive assets, such as individual landowning, that would help shed light on their varying constraints and opportunities. Using nationally representative multi-topic surveys across low- and middle-income countries, that follow international guidance on collecting self-reported, individual-level data on employment and assets, this paper highlights substantial differences in socioeconomic profiles of agricultural producers, as well as areas for improving survey data collection going forward. The findings show that agricultural producers indeed vary widely across the distribution of consumption and land wealth. Agricultural producers also have substantial income diversification over a longer (12-month) timeframe, both within and across households — and across the farm and nonfarm sectors. This indicates a greater need to address seasonality and an intrahousehold perspective in data collection. Importantly, compared with other individual and household socioeconomic variables, individual land wealth has among the most consistent links with improved welfare status for agricultural producers across countries. It also identifies profiles of income diversification among men and women over the year, even compared to landowning area or overall ownership. The findings underscore the importance of individual-disaggregated data collection, that also fills key gaps on land wealth, to better understand welfare outcomes of agricultural producers and ways forward for improving evidence-driven policymaking.
Keywords
Introduction
Across low- and middle-income countries, agricultural producers — those who produce, and/or process for storage, agricultural, fishing, hunting and gathering products, for their family or household — are largely engaged in small-scale activities. This includes, largely, either employed work in unincorporated market enterprises (producing mainly for sale), or own-use production, primarily for the household’s livelihood [1]. All of these activities, following the 21st ICLS standards, are generally classified as informal [2]. Using available data from the ILO and the World Bank, for example, Figure 1 shows a strong positive association between agriculture-dependent economies and informality in agriculture, with many low and middle-income countries — particularly in Sub-Saharan Africa and South Asia — having upwards of 90 percent informally employed in the sector in 2021-22. Even among low and middle-income countries in Latin America and East Asia that have lower shares of agriculture in GDP, the share of informally employed in agriculture can range from 40 percent to as much as 70 percent.
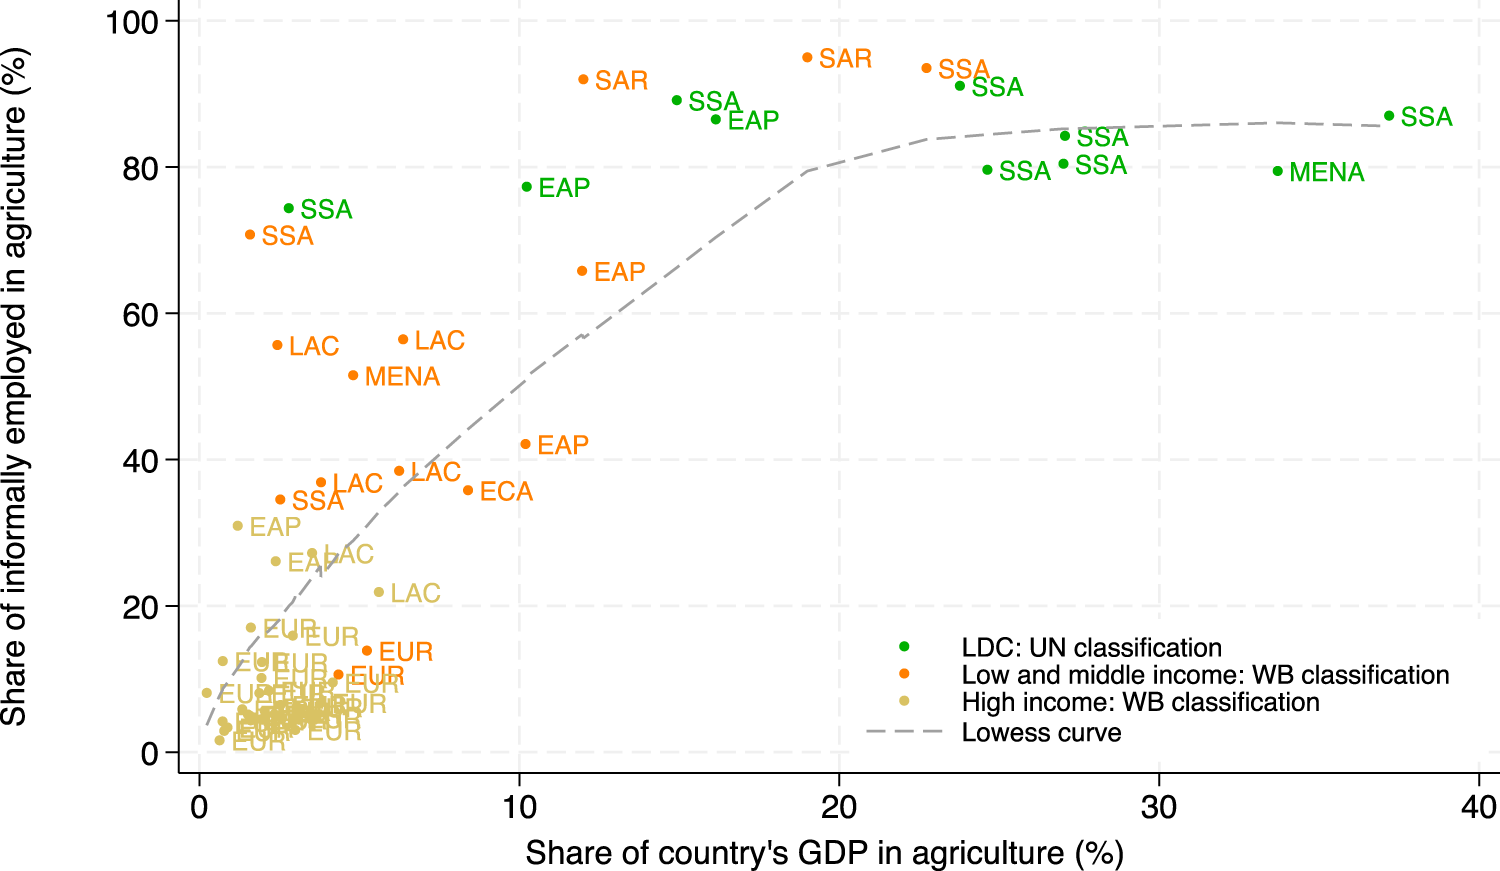
Cross-country estimates, 2021-22: share of informally employed in agriculture, relative to share of GDP in agriculture 1Notes: (1) Graph covers countries with data available in recent UN and World Bank databases. Share of informally employed in agriculture was obtained from the SDG Indicators Database, United Nations, Department of Economic and Social Affairs: https://unstats.un.org/sdgs/dataportal/database. Share of GDP in agriculture, and income classification, was obtained from the World Bank Development Indicators website: https://data.worldbank.org/indicator/NV.AGR.TOTL.ZS (2) To simplify the graph, each country was reflected by its region: SSA = Sub Saharan Africa; SAR = South Asia Region; EAP = East Asia & Pacific; LAC = Latin America & Caribbean; MENA = Middle East & North Africa; EUR = Europe (3) Lowess curve: locally weighted regression; bandwidth = 0.8.
Among this large group of informal producers, however, significant variation exists across socioeconomic outcomes that are important for policy targeting. As implied in Figure 1, agriculture can take on very different features — including the share of informal workers — depending on where a country is in the global distribution of agriculture in GDP, as well as by income classification. A clearer understanding of the socioeconomic profiles of workers in agriculture is critical for developing a more in-depth perspective — and measurement agenda — on this substantial share of the informal economy, also given the large share of GDP that agriculture represents in lower-income countries. Within countries as well, consumption and wealth-related welfare outcomes may vary substantially within agriculture, due to varying resource constraints faced by different producers, access to markets and norms. All of these, in turn, can affect the ability to purchase inputs, investments in operations, and resulting productivity [3], [4]. Subsistence foodstuff producers, who following the 19th ICLS definitions are own-use producers for their household’s livelihood, also need to be examined separately from the employed given their particular vulnerability to economic shocks, even though they are responsible for substantial shares of food production globally [5], [6]. Moving beyond a formal-informal dichotomy within agriculture is therefore important, including for better understanding sources of structural transformation in agriculture [7].
From a survey measurement perspective, an important question is how to unpack and nuance what could otherwise be a “black box” of informal producers in agriculture, to better target and design policies affecting these individuals, and also understand what factors might be consistently important across countries to guide survey data collection. Country labor force surveys and labor modules are well positioned to provide insight into a more disaggregated perspective, including breakdowns by different demographic and socioeconomic characteristics. However, survey data on economic status and opportunities of agricultural producers is generally limited to hours worked, intended destination of production, and specific areas of work (crops/livestock/fishing and forestry).
A key data gap is in wealth. Land, in particular, typically constitutes the largest share of wealth for individuals in agriculture [8] and can be a critical asset for improving farmers’ income and consumption, as well as hedging against future economic shocks. Ownership of land can also aid in the acquisition of productivity-enhancing inputs and capital. However, landowning variables — across overall ownership, as well as measures of land value and quality — are typically rare in labor force or similar economic surveys, also because of the traditional complexity in collecting such data. When included in other multi-topic household or agricultural surveys, data on landowning is either collected at the household level, preventing a disaggregated view across individual farmers — or, if collected at the individual level, is often reliant on a “most knowledgeable” household member who reports for others. This introduces potential risks of proxy measurement error [8], [9]. These data gaps, in turn, have hampered an understanding of how different aspects of landownership are directly linked with individual-level employment and production in agriculture. These issues are particularly important in lower-income countries, where men and women producers are also often involved in very different activities within agriculture. As a result, in these contexts, effective policy interventions (across a wide range of areas including subsidies, employment schemes, tariffs, and infrastructural investments, for example) need sufficient individual-disaggregated data on agricultural assets to consider how different groups are affected [10], [11].
Based on individual-level modules in multi-topic household surveys, this paper aims to fill some of these gaps, by focusing on the importance of collecting individual-level data on landowning and land wealth in understanding socioeconomic differences among agricultural producers. The findings also highlight the need to examine specific profiles of agricultural producers, across employed/own-producers, as well as diversification across agricultural and non-agricultural sources of income. The analysis relies on rich, individual-level, self-reported data on labor, land ownership and wealth from the World Bank Living Standards and Measurement Study – Plus (LSMS+) surveys [12], from countries in Sub-Saharan Africa (Malawi, Tanzania, and Ethiopia) and East Asia (Cambodia), all of which have the majority of their population in rural areas, with a high proportion of employment in smallholder agriculture. The LSMS + survey methodology on landowning and wealth is based on 2019 survey methodological guidance of the UN Statistical Division (UNSD) on individual-disaggregated data collection on asset ownership and rights, with a view to reducing sources of measurement error stemming from proxy reporting, and improving detail on types of ownership and rights across asset categories, especially among women [13]. The paper uses the LSMS + surveys to discuss relevant socioeconomic profiles of (mainly informal) agricultural producers—and in turn, aims to highlight areas for future data collection underscoring the importance of agriculture in the space of informality.
Several findings are highlighted in the paper, all of which underscore the importance of data collection that allows a disaggregated perspective of socioeconomic outcomes within agriculture. Overall, while agricultural producers in these samples are informally employed and tend to have lower household per capita expenditure on average (as compared to rural nonfarm employed, for example), substantial shares of agricultural producers are nonetheless in the highest tercile of household per capita expenditure in each country, and large shares also own land. Following the 19th ICLS guidance, distinguishing between production mainly for sale (i.e. employment) and own-use reveals important differences in consumption-based welfare for specific countries, as well as in hours worked — similar to findings in other countries, including pilots conducted by the ILO [14]. Even within these groups, however, there are a range of socioeconomic profiles that merit a closer look, particularly for data-driven policymaking. In better understanding socioeconomic profiles of those who are actually employed in agriculture, the findings also highlight the importance of land wealth — as measured by the respondent’s valuation of land they own, following the 2019 UNSD guidance — rather than more commonly used landowning metrics such as land area and overall land ownership. Finally, the paper shows a substantial degree of income diversification across agricultural and non-agricultural (wage/nonfarm enterprise) sources among agricultural producers, owing likely to a high degree of seasonality in agricultural activity within each country. Greater land wealth is also a key variable identifying respondents who diversify across farm and nonfarm sources of income, and with stronger links for women as well.
The paper also makes recommendations in certain areas of survey design to better measure characteristics of agricultural producers in labor force and other employment surveys. These recommendations are aided by the comparability/same structure of the LSMS + questionnaire modules across countries. Because self-reported, individual-level data on labor and landowning in agriculture are rare in surveys, there has been little work to better understand how data collection could be augmented to better capture the livelihoods and economic opportunities of informal producers in the sector. A key aim of this paper is to provide guidance by which data could be expanded to better understand profiles of these workers.
Country survey overview
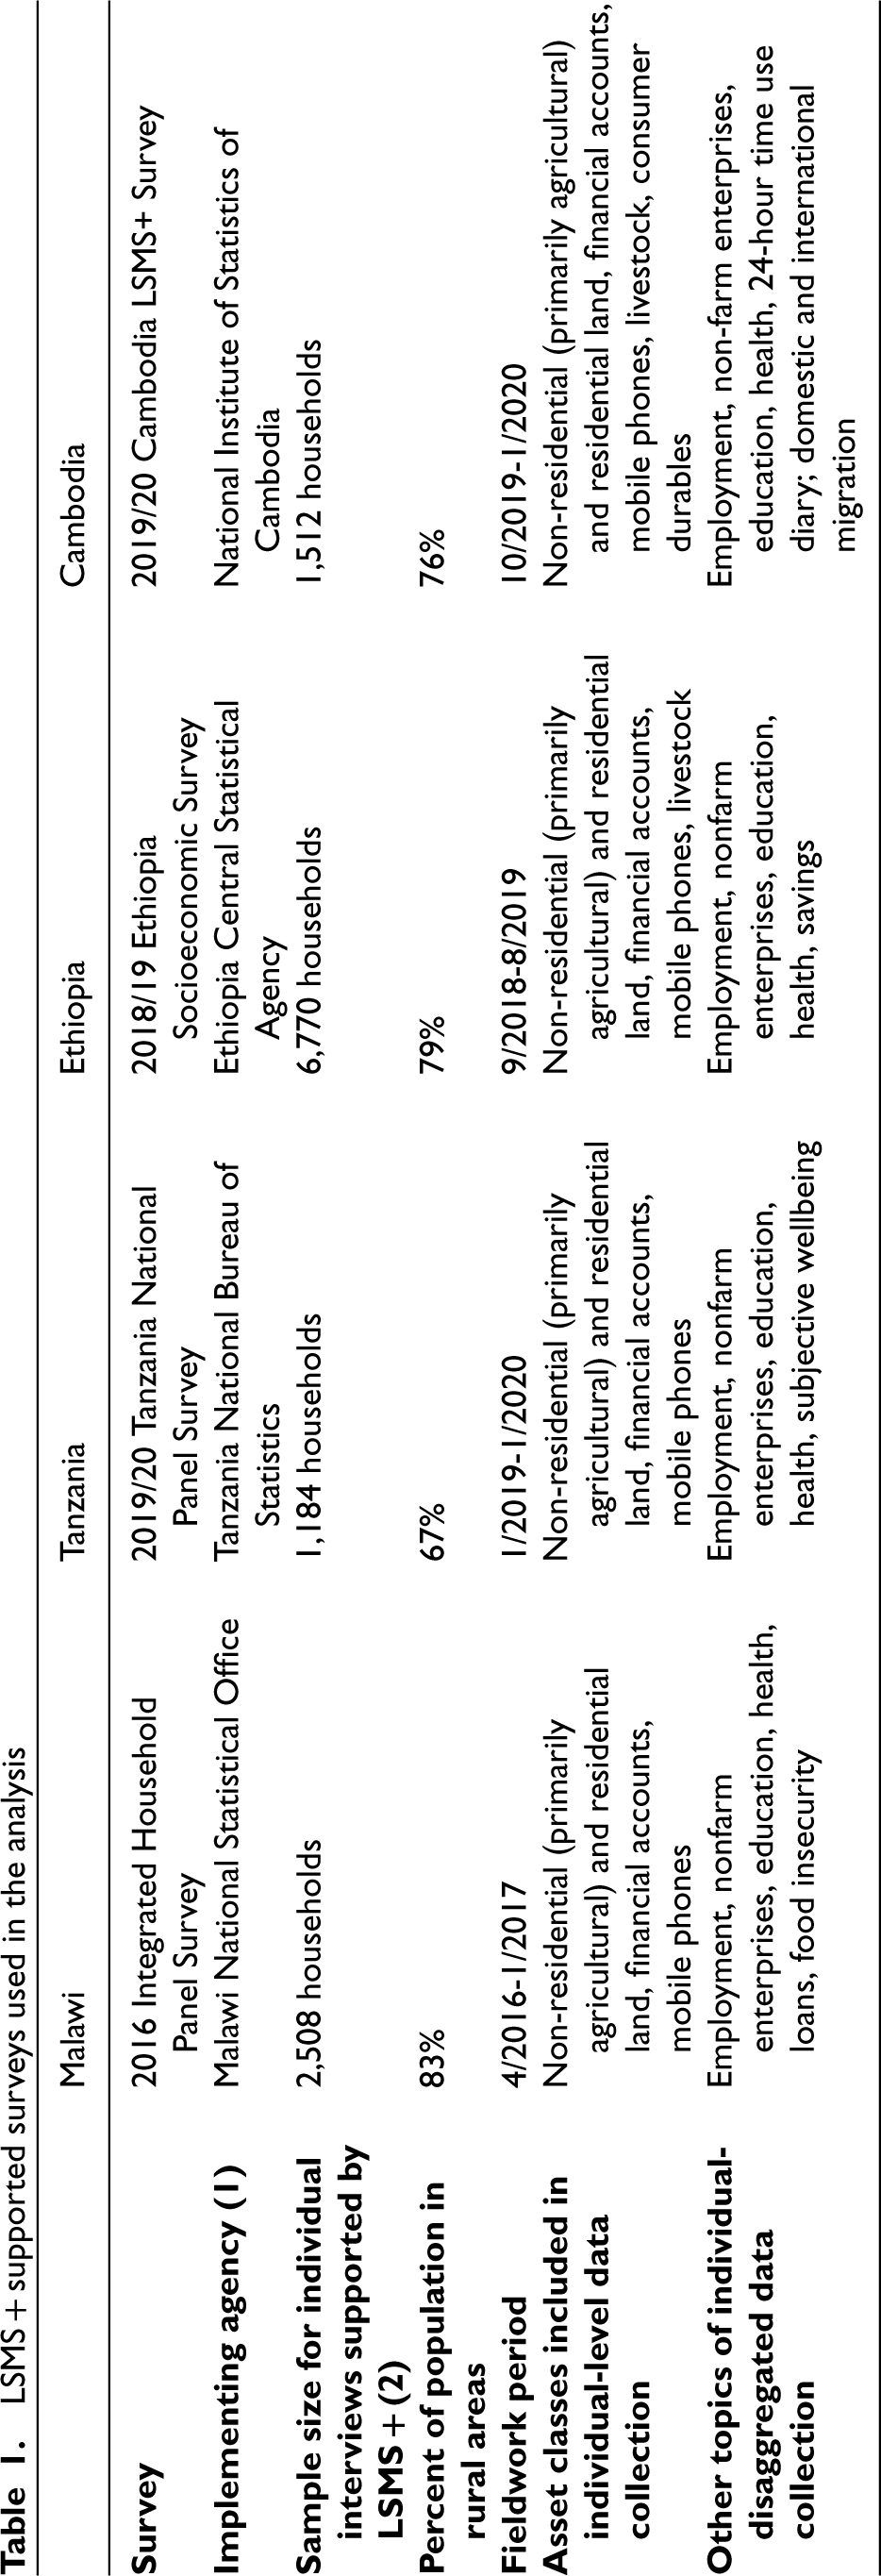
The LSMS + data underlying the findings in this paper spanned nationally representative surveys in low and middle-income countries — Malawi (2016/17), Tanzania (2019/20), Ethiopia (2018/19), and Cambodia (2019) — all with large shares of the population working in agriculture and living in rural areas (Table 1). Each survey was implemented in collaboration with the country national statistical office, and included a range of different modules that would allow an analysis of agricultural producers disaggregated across a range of socioeconomic and demographic characteristics.
LSMS + supported surveys used in the analysis
LSMS + supported surveys used in the analysis
The LSMS + surveys had comparable questionnaire modules on labor and asset ownership, based on the 2019 UNSD guidance emphasizing self-reported, one-on-one interviews with all adult men and women household members aged 18 and older [12].1,2 On labor, all the LSMS + surveys had individual-level, self-reported data on work and employment in the last 7 days, as well as main and secondary occupations.
To identify those working as agricultural producers in the last 7 days, the LSMS + surveys asked “in the last 7 days, did [NAME] work on family farming, livestock or fishing activities, even if only for one hour?” Following the 19th ICLS recommendations, main intended destination of production was also asked of agricultural producers. On assets in particular, respondents were asked about personal ownership, control and valuation over a range of physical assets (land and livestock, the latter of which was surveyed only in Malawi and Cambodia) as well as financial assets/accounts. Aspects of control included whether ownership was exclusive or joint — and for land, whether owners also had specific exclusive/joint rights to rights to sell, bequeath, rent, use as collateral, and invest the land parcel.3 Asset owners were also asked to value each asset they owned using the potential sales value (or realization value) recom admended in the 2019 UNSD guidelines: “if you were to sell < THIS ASSET > today at current market prices, how much would you receive for it (in local currency)?” 4,5 For land, valuation was asked for each parcel the respondent owned. A roster of assets owned by household members was first elicited for each asset class, which formed the basis of individual interviews on the questions around asset ownership and valuation.
The benefits of the LSMS + individual-level approach on improving accuracy of labor and wealth reporting has been discussed in recent research. Comparing the Malawi LSMS+, for example, with the concurrent, nationally representative 2016 Malawi Integrated Household Survey (which relied on proxy respondents and non-private/group interviews to elicit labor outcomes), Kilic et al. (2022) found that the standard approach in the IHS led to significant underreporting of wage and self-employment, with stronger effects for women and for a longer (12-month) recall period [19]. Hasanbasri et al. (2023) show, using data across the LSMS + countries, important gender inequalities in individual rights and decision-making over non-residential (primarily agricultural) land, even in cases where ownership rates are similar across men and women [20]. Hasanbasri at al. (2024) also found that data on land valuation reveals important insights on wealth inequality, within and across households in the LSMS + surveys [8].
Seasonality, employment and landowning wealth in profiles of informal agricultural producers: findings from the LSMS + surveys
As discussed in this section, the individual-level data from the LSMS + surveys underscore that agricultural producers — although largely informal — are not a homogeneous group, either across or within countries. Along with providing an overall perspective on agricultural employment and own-use production (including the role of seasonality), this section also examines the extent to which employment is linked with higher consumption-based welfare outcomes, and the additional importance of individual-level data on landowning.6
Seasonality and employment in agricultural production: measurement issues
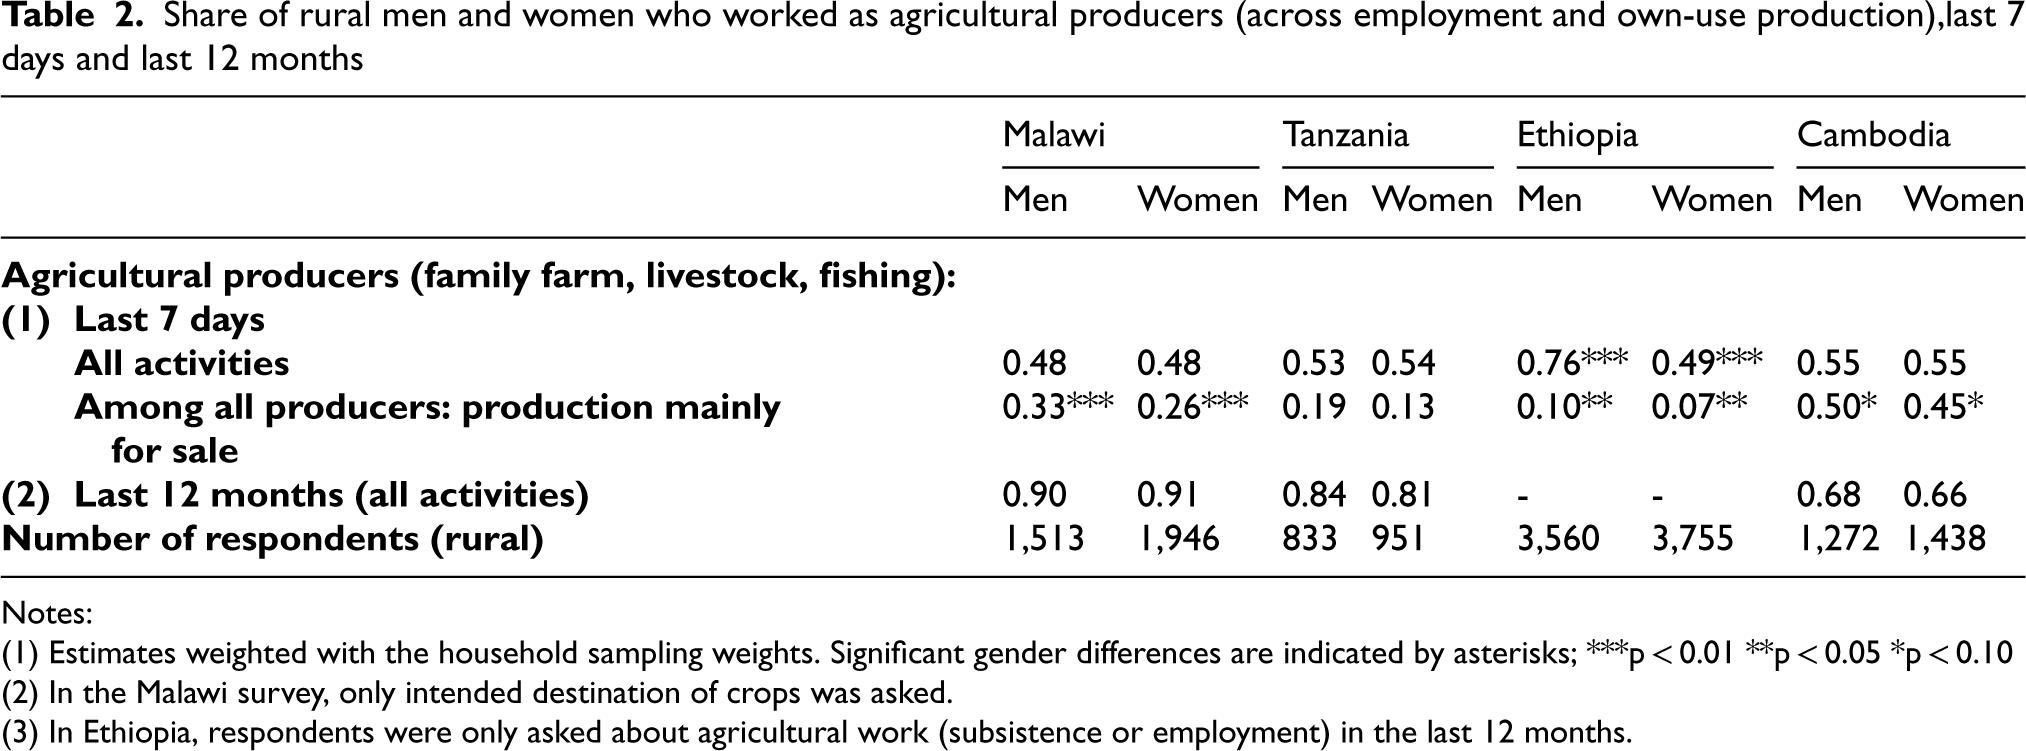
The LSMS + surveys asked respondents about production and employment activities in the last 12 months, as well as the last 7 days. This allows for an examination of the effect of reference periods in identifying work in agricultural production, across employed and own-use production activities. Table 2 shows that the longer reference period, as would be expected, plays a large role in accurately identifying rural agricultural producers. About 90 percent of men and women in the Malawi survey reported agricultural production work in the last 12 months, for example, but only about half that in the last 7 days. Similar differences emerge in Tanzania (and, to a smaller extent, in Cambodia).7 A substantial share of respondents in urban areas are also in agriculture — Appendix Table A1 also shows that around 10-20 percent of men and women in urban areas have engaged in agricultural activities over the last 7 days, with these numbers increasing to about 25-35 percent in the last 12 months. Guidance from the 21st ICLS focuses on relatively short reference periods for measuring work (7 days for employed activities; 4 weeks for own-use production of goods, unpaid trainee work and volunteer work; and one or more 24-hour days within a one-week period, for own-use provision of services) [21]. For agriculture in particular, longer reference periods can be helpful in understanding the extent of activity within the sector, also given diversification of activities across farm and nonfarm sources (discussed in Section 4).
Share of rural men and women who worked as agricultural producers (across employment and own-use production),last 7 days and last 12 months
Share of rural men and women who worked as agricultural producers (across employment and own-use production),last 7 days and last 12 months
Notes:
(1) Estimates weighted with the household sampling weights. Significant gender differences are indicated by asterisks; ***p < 0.01 **p < 0.05 *p < 0.10
(2) In the Malawi survey, only intended destination of crops was asked.
(3) In Ethiopia, respondents were only asked about agricultural work (subsistence or employment) in the last 12 months.
Table 2, based on individuals’ reporting of whether their production in agriculture was mainly for sale, also reflects substantial country variation in agricultural employment, with women tending to be significantly less likely to produce for sale (and hence employed by international standards) than men. These gender differences also underscore the importance of questions on own-use production in identifying agricultural activities, and particularly for women. Within rural areas, Table 2 shows that about 50 and 45 percent of men and women producers in Cambodia, respectively, would officially be counted as employed, compared to 10 and 7 percent of men and women producers in Ethiopia; Malawi and Tanzania fall in the middle of this range. In the Malawi survey, in particular, only intended destination of crops was asked, as opposed to all agricultural production spanning crops, livestock and other activities; this has continued through the most recently available (2019) round. However, looking at the much greater differences between those producing/not producing mainly for sale in other countries in Sub-Saharan Africa, there may be a better case for asking about the intended destination of agriculture across all production as opposed to a specific category of output [5]. As discussed in Section 3.1, intention to sell agricultural output could also be asked over longer as well as shorter reference periods so as not to underreport employment in agricultural production that could be seasonal, although measurement error can be an issue [22]; in general this is an area for future work.
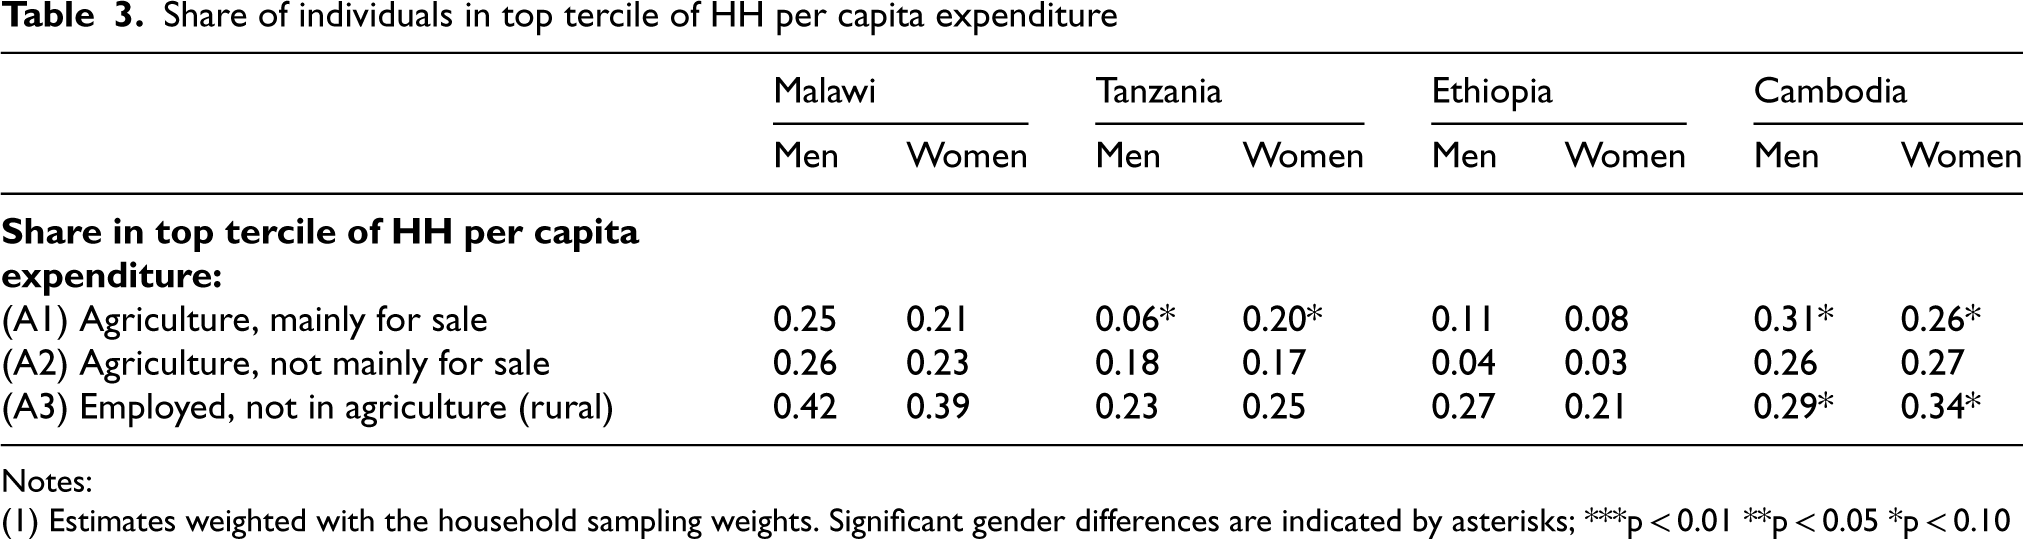
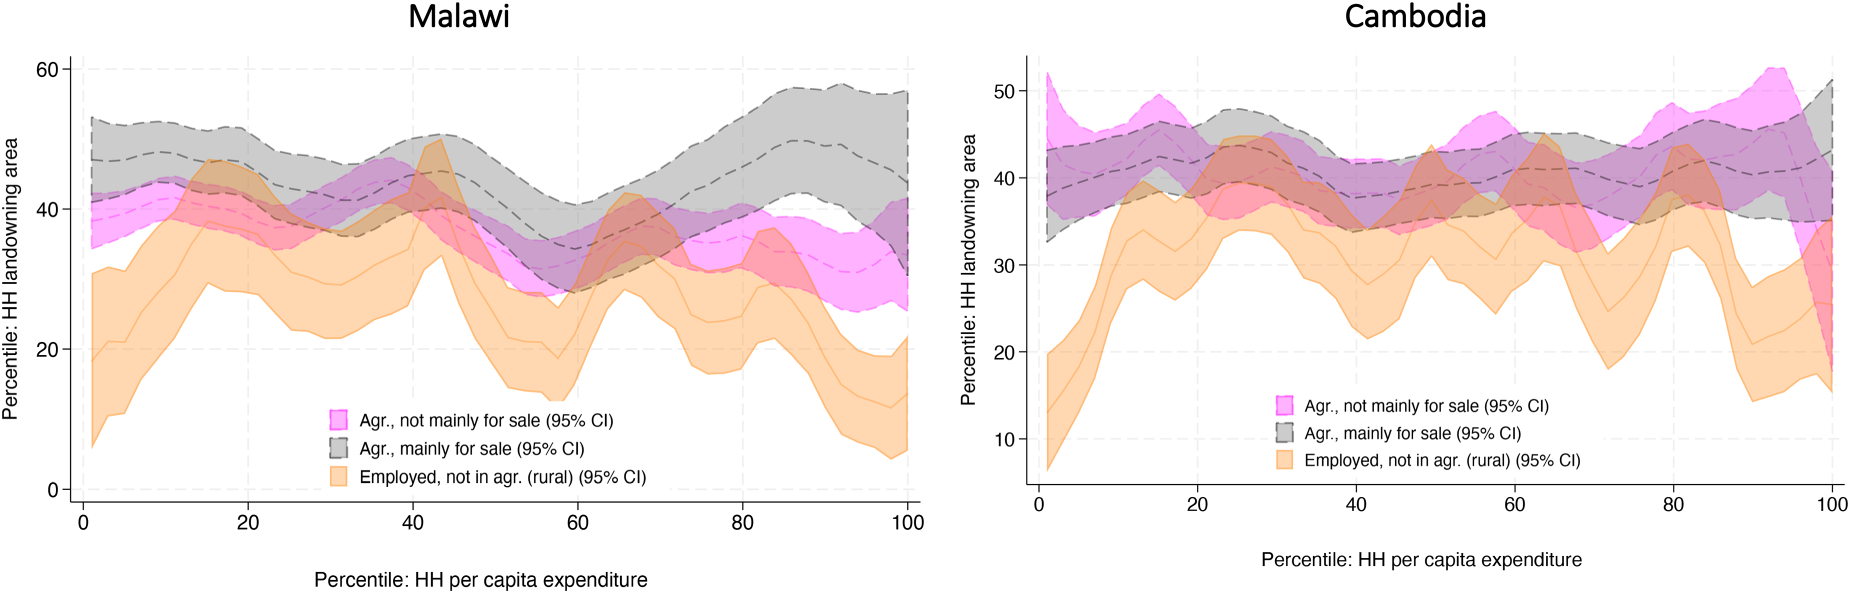
Interestingly, however, being officially counted as employed in agriculture does not necessarily link with higher welfare outcomes compared to own-use producers. While in Ethiopia and Tanzania, own-use producers are significantly worse off in the distribution of household per capita consumption compared to those producing mainly for sale — and compared to individuals engaged in rural nonfarm employment (Figure 2), there are no significant differences across own-producers and employed in agriculture in Malawi, and across the three groups as a whole in Cambodia. Substantial shares of agricultural producers are also concentrated in the top tercile of household per capita expenditure, regardless of employment status (Table 3). This is particularly the case within Malawi (21-26 percent), Cambodia (26-31 percent), as well as own-producers in Tanzania (17-18 percent); in Ethiopia these shares are much lower (3-11 percent).
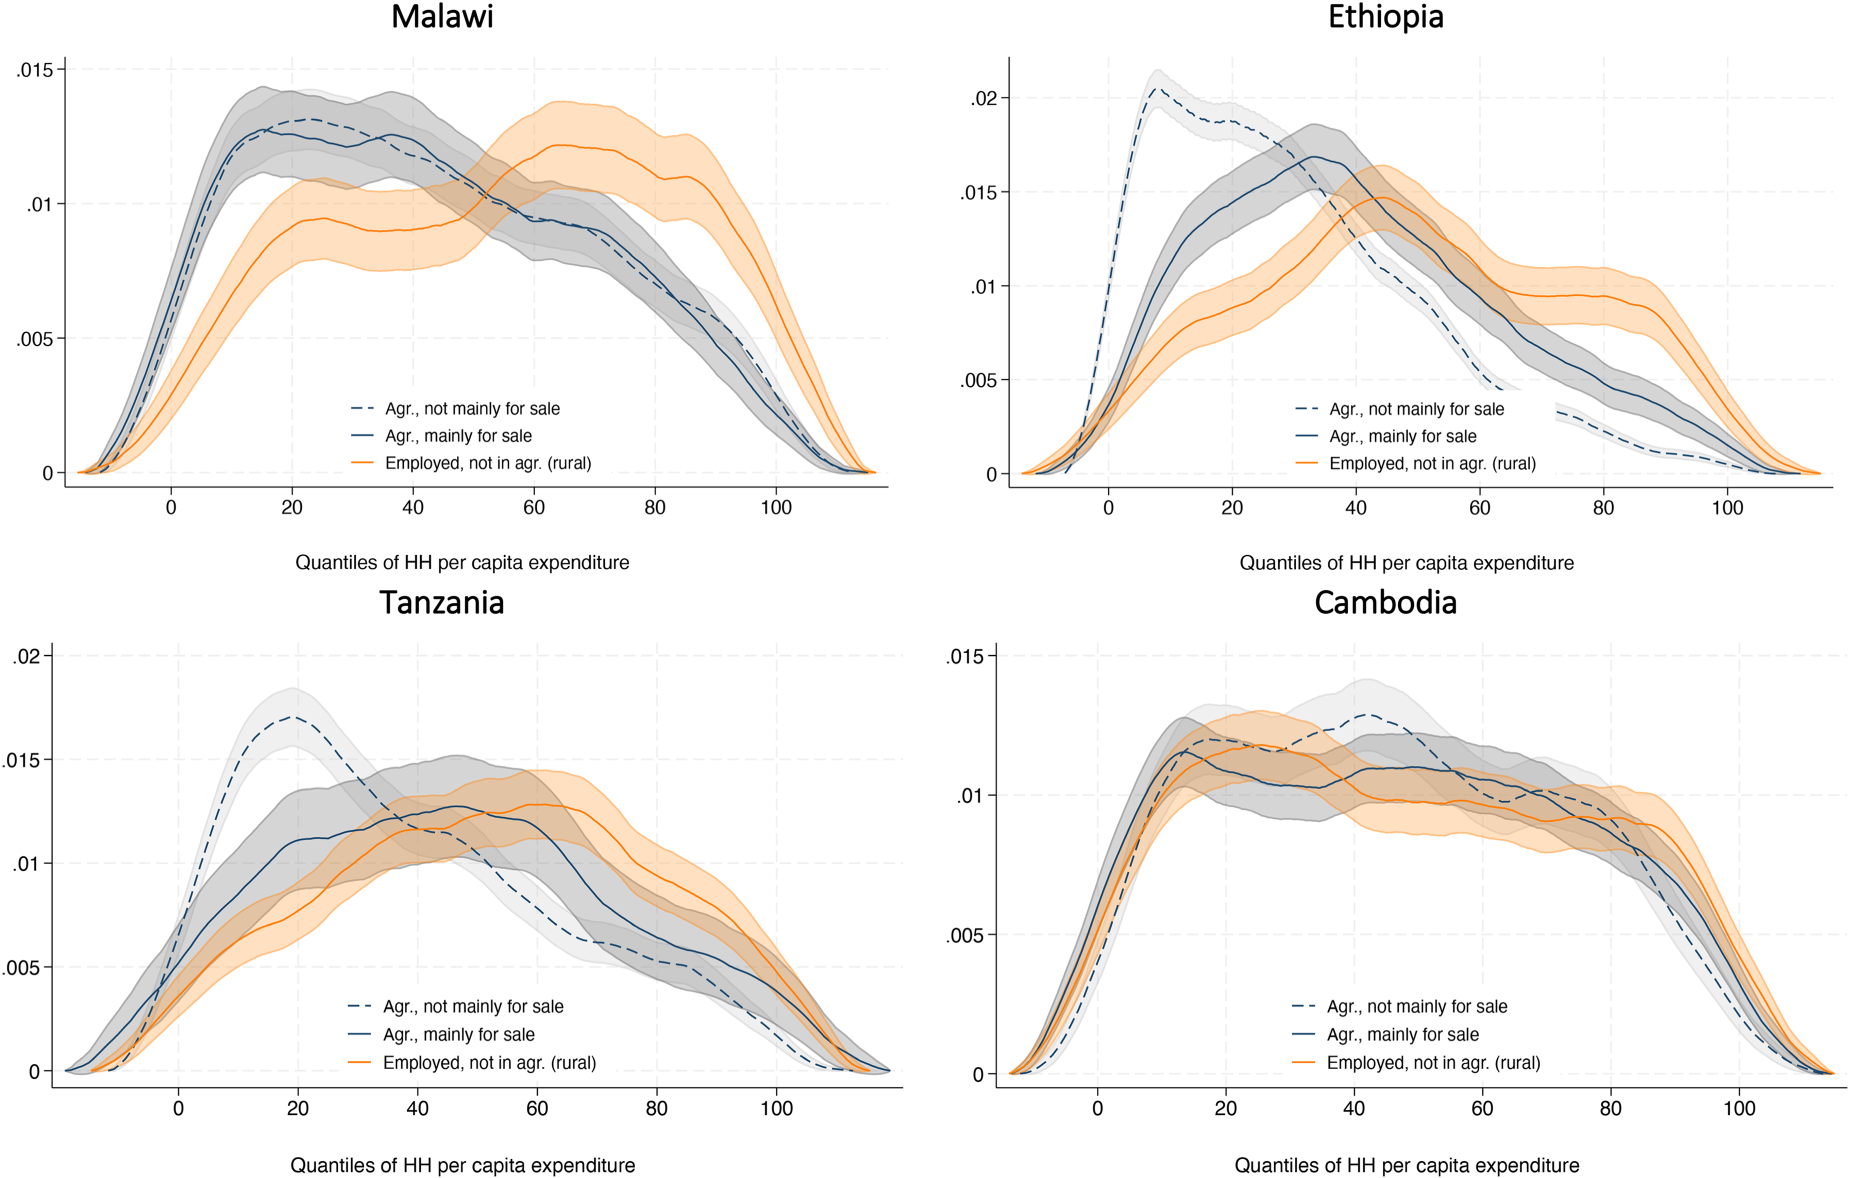
Kernel density regressions: individuals working in agriculture (mainly/not mainly for sale), by quantiles of HH per capita expenditure
Share of individuals in top tercile of HH per capita expenditure
Notes:
(1) Estimates weighted with the household sampling weights. Significant gender differences are indicated by asterisks; ***p < 0.01 **p < 0.05 *p < 0.10
Tables 2-3 and Figure 2 reflect wide variation across countries in agricultural employment and production, and lack of a systematic pattern between agricultural employment and household consumption. Examining additional dimensions of agricultural producers’ socioeconomic status, alongside employment, are therefore helpful to better understand linkages with common welfare outcomes. As discussed earlier, this includes examining data on assets such as landowning (Table 4 and Figures 3a-3b), to shed light on seasonal patterns in production and employment, and for which the LSMS + survey modules collected detailed, individual-disaggregated information.
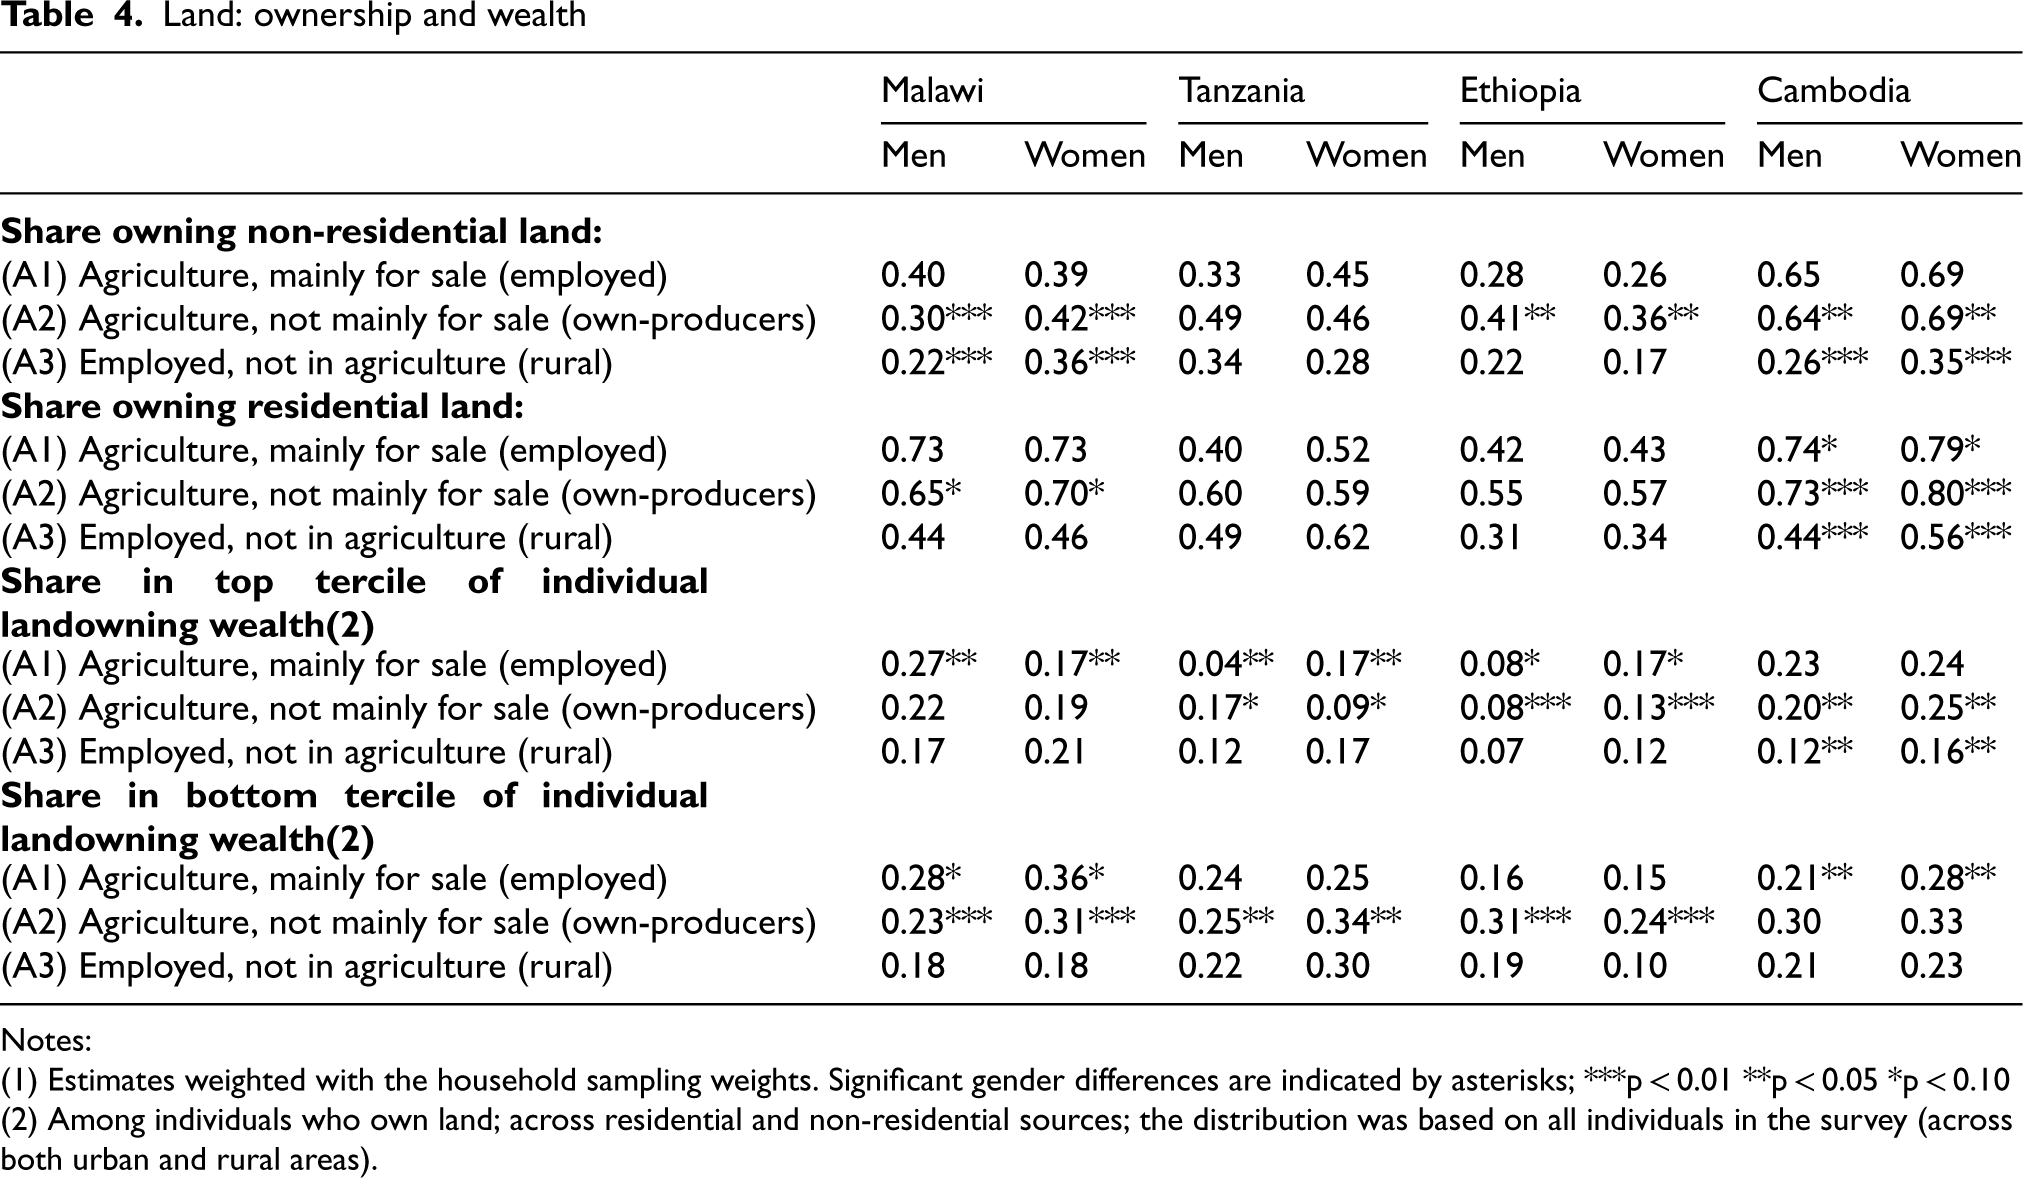
Table 4 shows that large shares of own-producers (denoted as A2 in the table) and those employed in agriculture (A1) own land across countries. Ownership of non-residential land8 among own-producers, for example, ranges from 30-45 percent in the three countries from Sub-Saharan Africa, to 65-70 percent in Cambodia. These shares increase for residential land across countries, and are particularly high in Malawi and Cambodia. Own-producers in Ethiopia and Tanzania, as well as women in Cambodia, are also more likely across groups to own residential land. Individual-level data, in particular, are also important in highlighting significant gender differences in ownership and wealth, as well as cross-country variation in the extent of these gender inequalities, owing to different marital and community customs around how land is transferred (see Hasanbasri et al., 2023 [19] and 2024 [8]).9
Land: ownership and wealth
Land: ownership and wealth
Notes:
(1) Estimates weighted with the household sampling weights. Significant gender differences are indicated by asterisks; ***p < 0.01 **p < 0.05 *p < 0.10
(2) Among individuals who own land; across residential and non-residential sources; the distribution was based on all individuals in the survey (across both urban and rural areas).
Looking at different aspects of landowning is important, however — despite higher rates of landownership, agricultural own-producers are more likely to be in the bottom tercile of total individual landowning wealth,10 compared to those who are employed. Malawi is the one exception, where differences across employed/not employed in agriculture are much smaller — this again may be a function of restricting the intended destination question to just crops, resulting in less variation in the employment variable. Figures 3a and 3b also underscore how different metrics of landowning matter. Individual land wealth, in particular, trends upward with household per capita expenditure (Figure 3a) — but land area, which was collected in Malawi and Cambodia, does not (Figure 3b). This reflects important questions around what aspects of landowning are more closely linked with welfare and productivity — for agricultural producers as well as the rural nonfarm employed — which Tables 5 and 6 delve into further.
OLS regressions: association of land and other socioeconomic variables, on being in top and bottom terciles of per capita expenditure(2)
Notes:
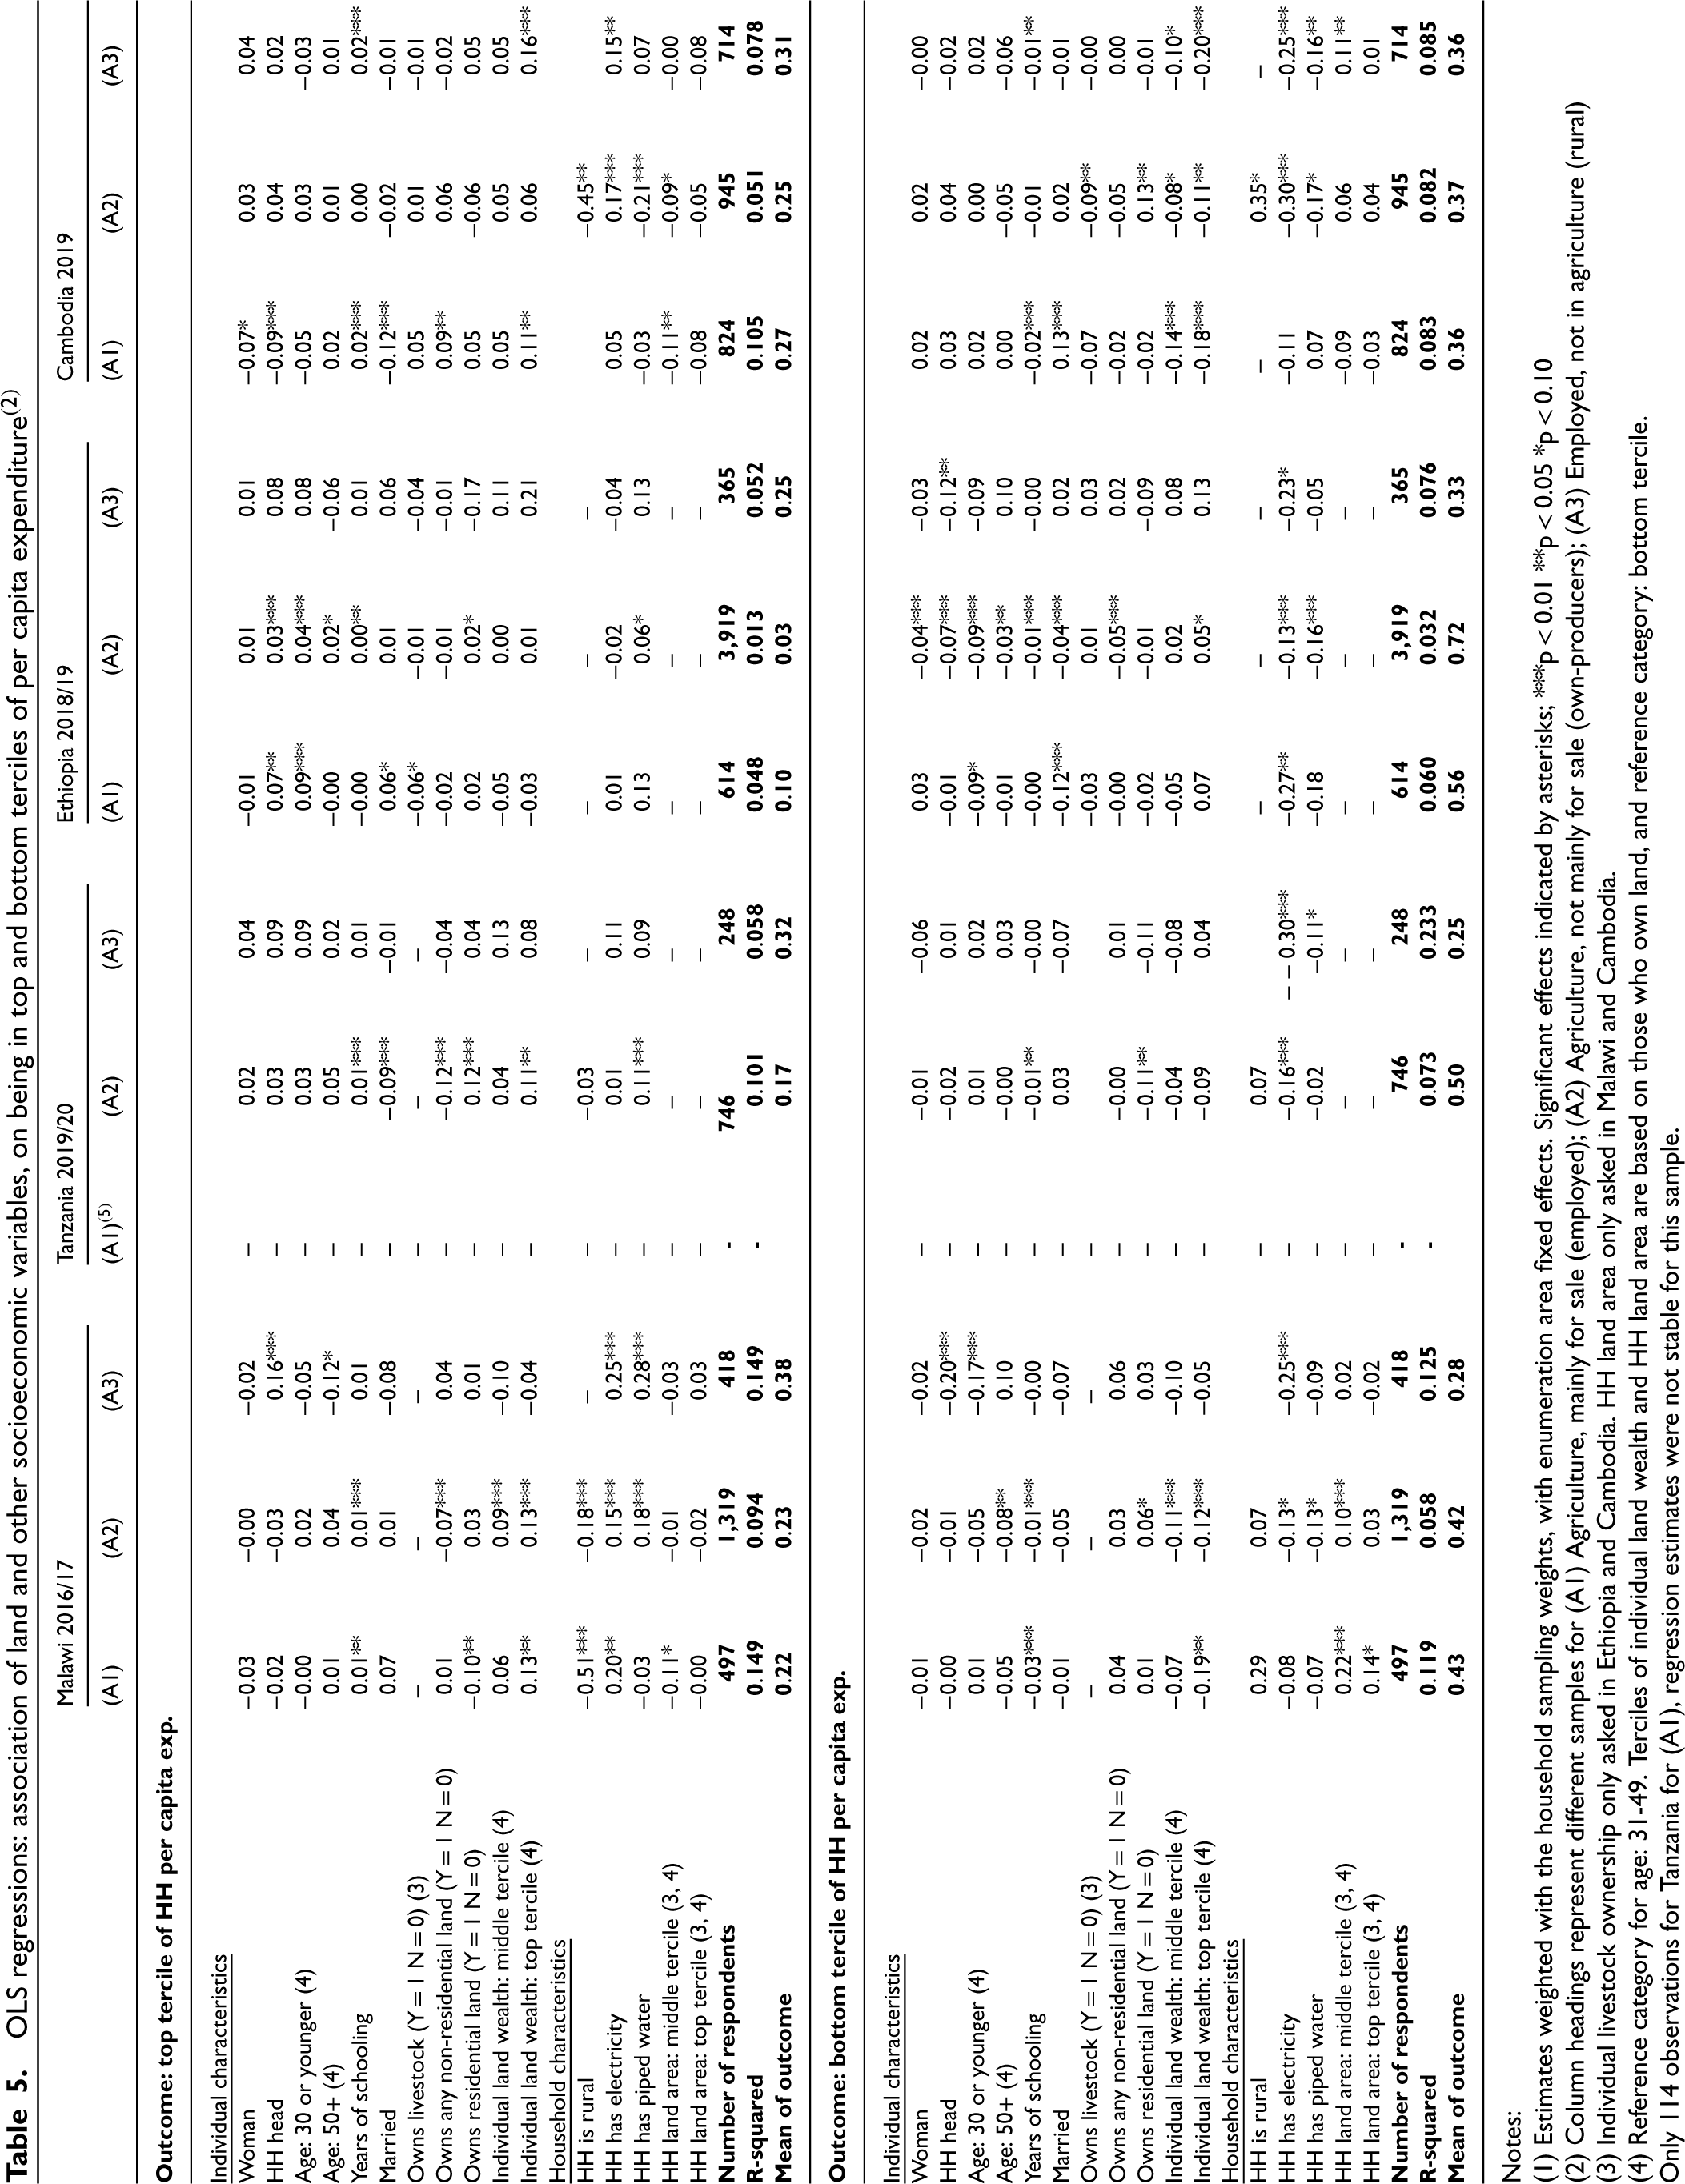
(1) Estimates weighted with the household sampling weights, with enumeration area fixed effects. Significant effects indicated by asterisks; ***p < 0.01 **p < 0.05 *p < 0.10
(2) Column headings represent different samples for (A1) Agriculture, mainly for sale (employed); (A2) Agriculture, not mainly for sale (own-producers); (A3) Employed, not in agriculture (rural)
(3) Individual livestock ownership only asked in Ethiopia and Cambodia. HH land area only asked in Malawi and Cambodia.
(4) Reference category for age: 31-49. Terciles of individual land wealth and HH land area are based on those who own land, and reference category: bottom tercile.
Only 114 observations for Tanzania for (A1), regression estimates were not stable for this sample.
To address these questions, Tables 5 and 6 present results from OLS regressions on how different dimensions of land ownership and wealth, alongside other individual and household characteristics, are correlated with specific socioeconomic outcomes yijk. These include outcomes available in the surveys linked with welfare (whether in the top or bottom tercile of household per capita consumption) 11 as well as measures of work and ability to secure additional resources (hours worked in the last week, and ownership of a financial account). In the absence of exogenous variation in the right-hand-side variables, understanding causal effects is not possible; these regressions rather aim to understand what factors are more closely linked or correlated with variation in outcomes as an initial insight. Separate regressions were run for each of the groups A1, A2, and A3 in Table 4:


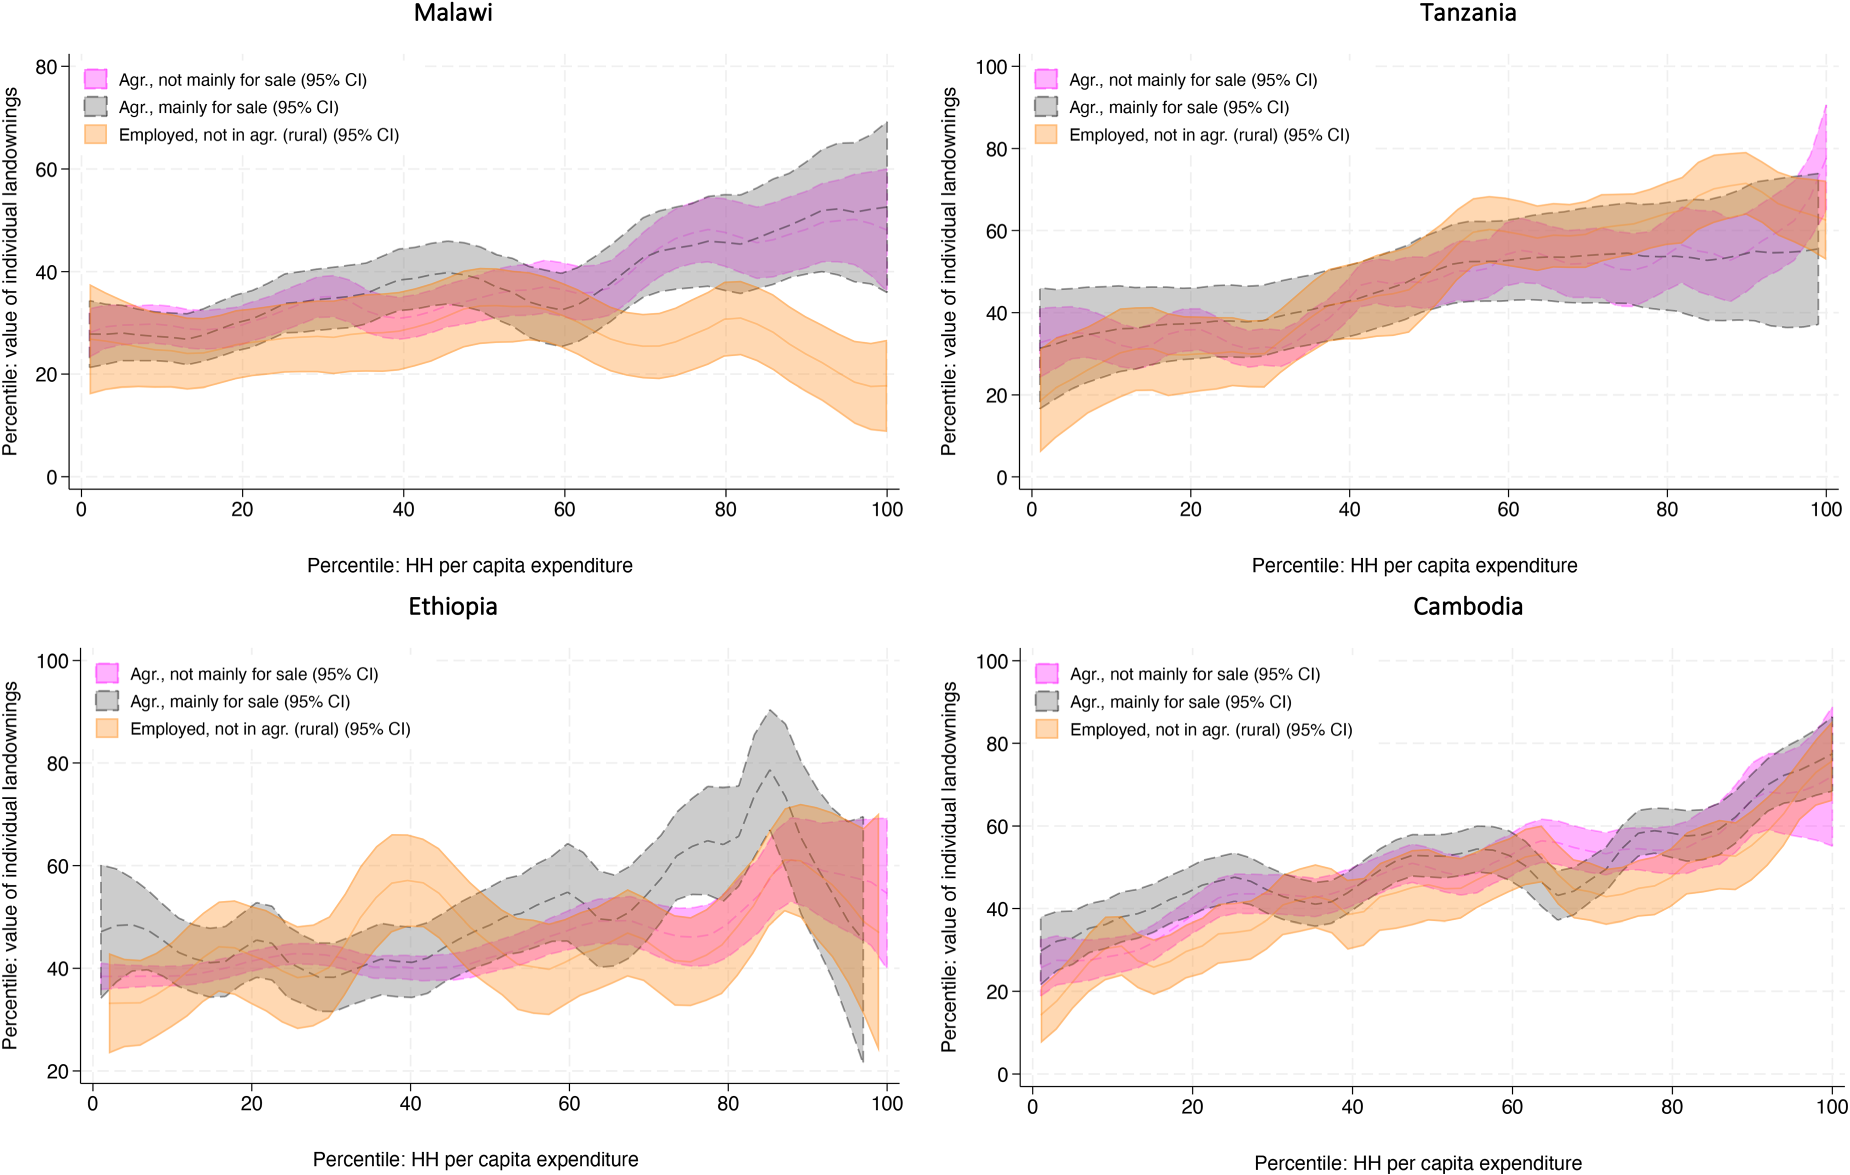
Locally weighted regressions (with 95% CI): relationship between percentile of individual landowning value and household per capita expenditure
Locally weighted regressions (with 95% CI): relationship between percentile of household landowing area and household per capita expenditure
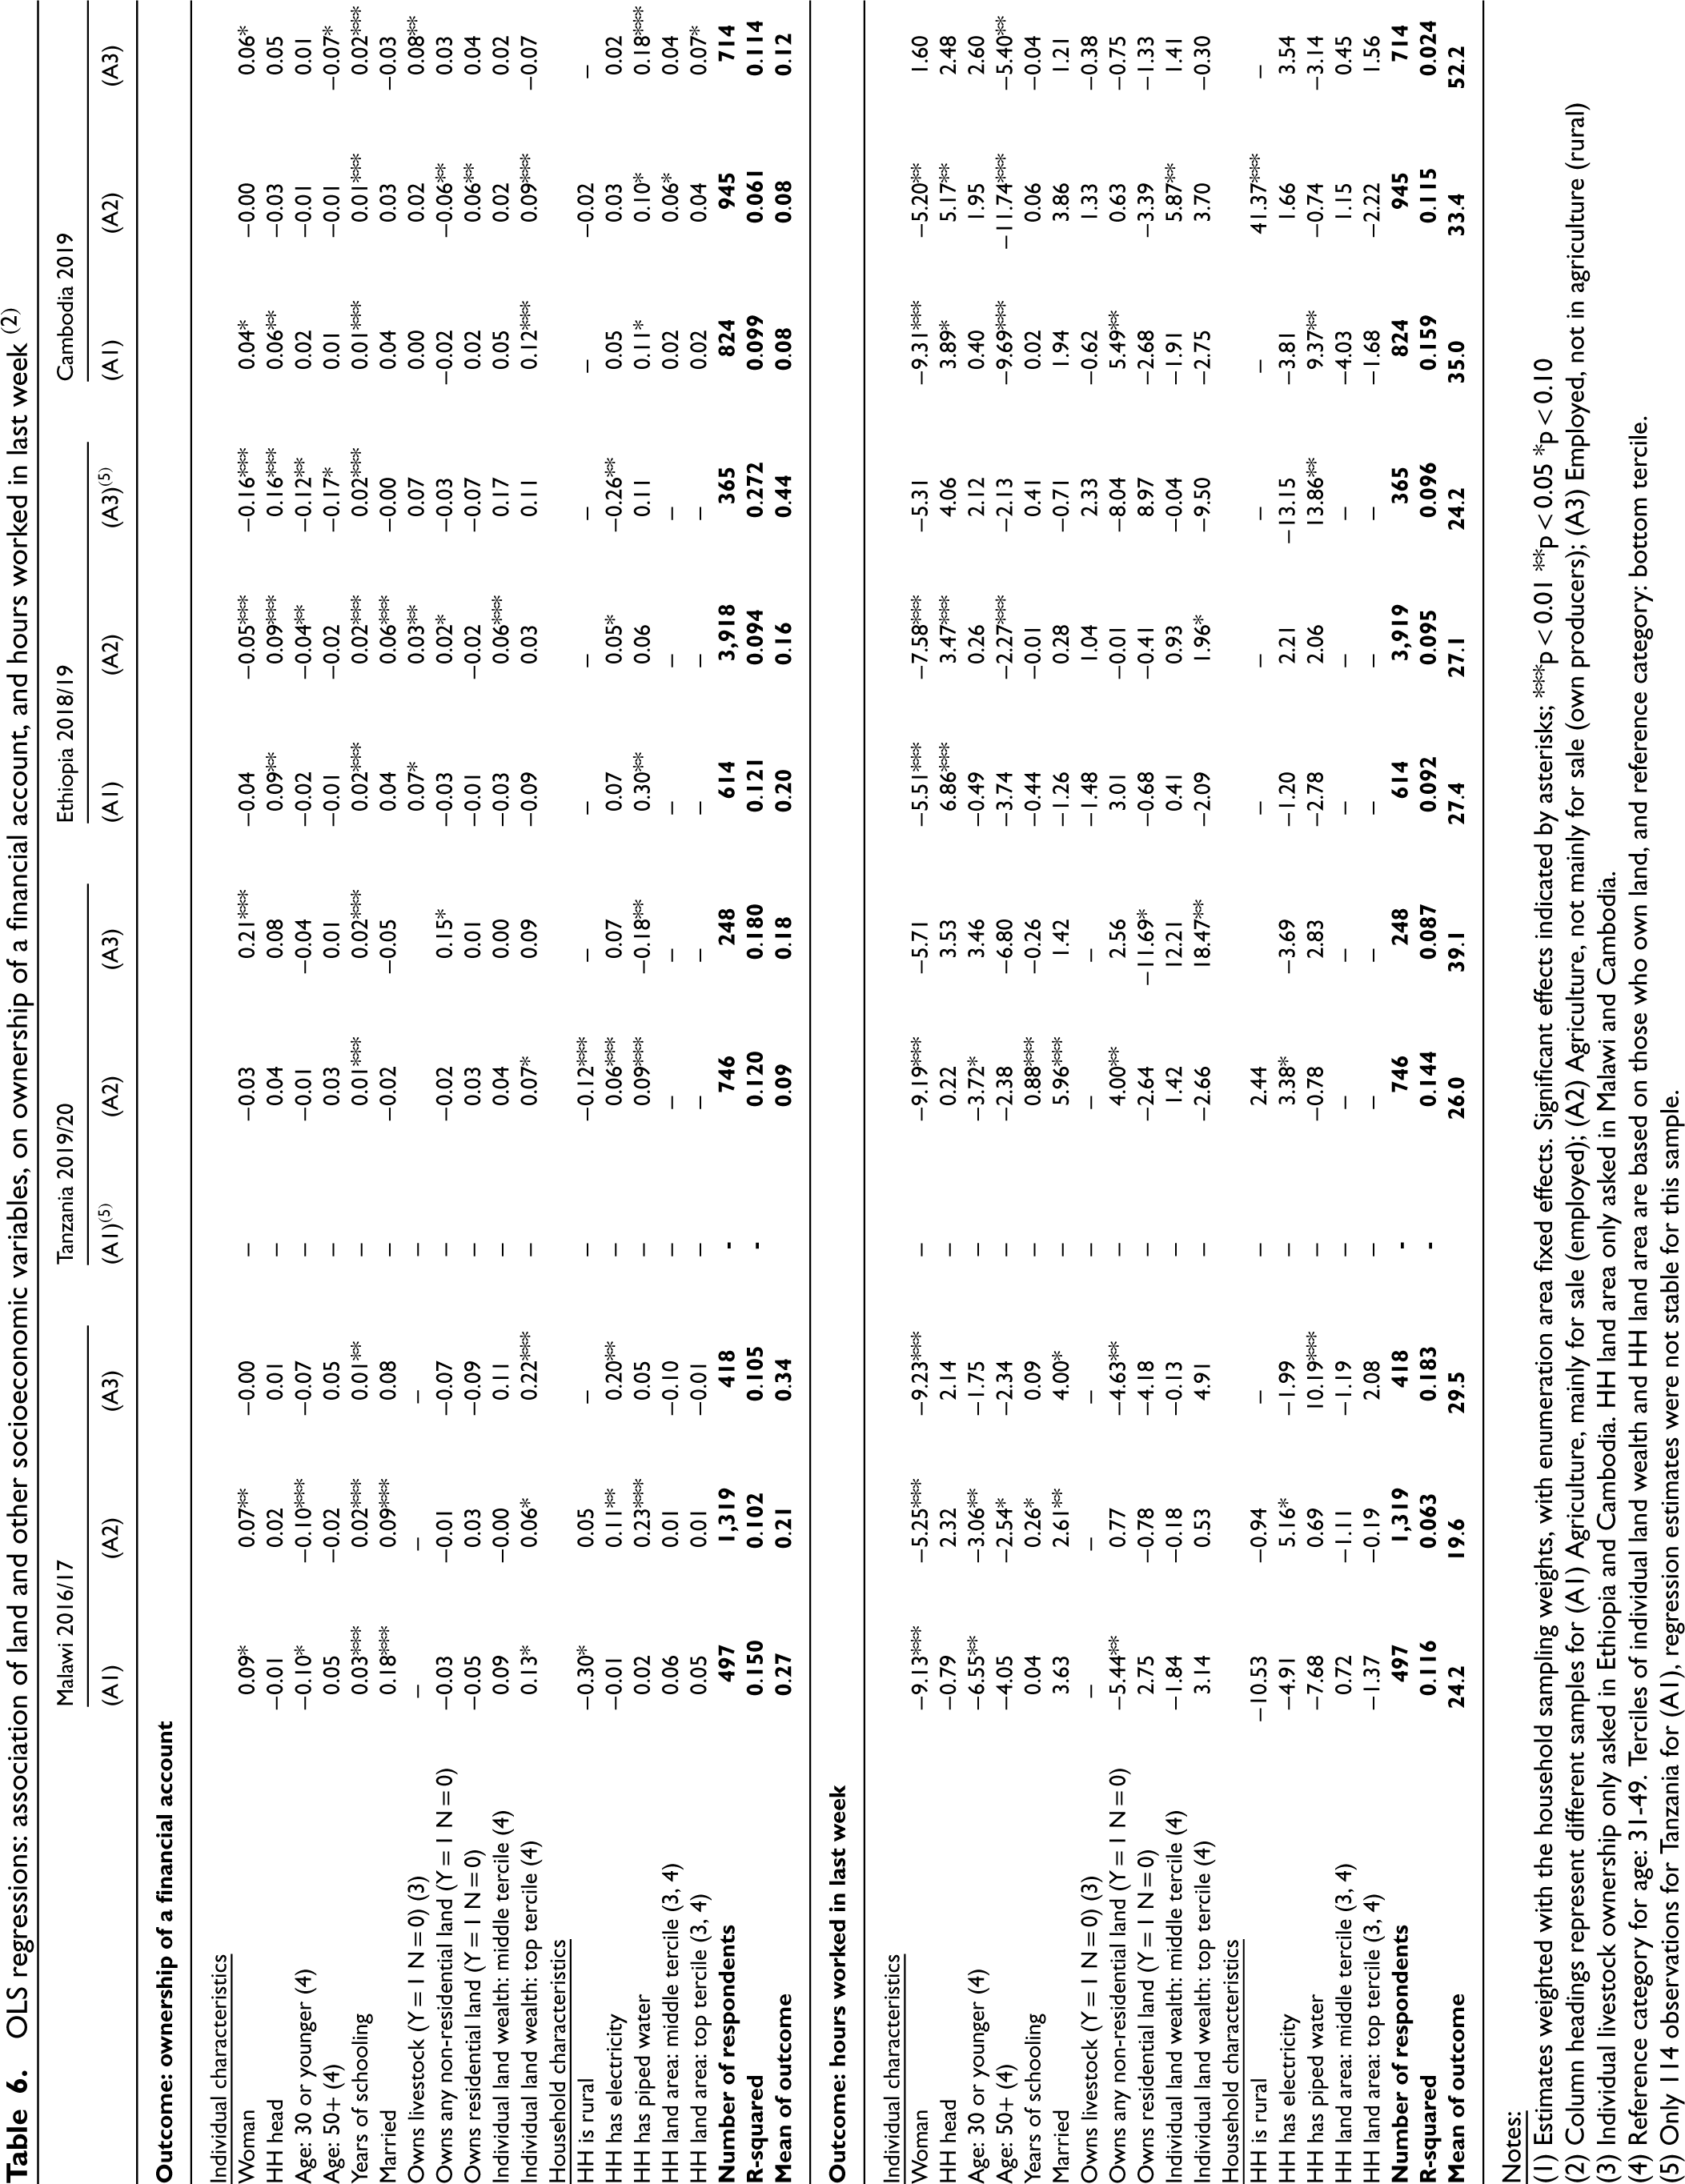
OLS regressions: association of land and other socioeconomic variables, on ownership of a financial account, and hours worked in last week (2)
(1) Estimates weighted with the household sampling weights, with enumeration area fixed effects. Significant effects indicated by asterisks; ***p < 0.01 **p < 0.05 *p < 0.10
(2) Column headings represent different samples for (A1) Agriculture, mainly for sale (employed); (A2) Agriculture, not mainly for sale (own producers); (A3) Employed, not in agriculture (rural)
(3) Individual livestock ownership only asked in Ethiopia and Cambodia. HH land area only asked in Malawi and Cambodia.
(4) Reference category for age: 31-49. Terciles of individual land wealth and HH land area are based on those who own land, and reference category: bottom tercile.
(5) Only 114 observations for Tanzania for (A1), regression estimates were not stable for this sample.
In equations (1a)-(1c), Xijk represents a vector of individual- and household-level characteristics (descriptive statistics in Appendix Table A3). Across individual characteristics, this includes whether the respondent was a woman, headship and marital status, age, education, as well as individual livestock and landownership (binary variables for ownership), and percentile of land wealth among those who owned land. Among household characteristics were rural status, whether the household had electricity, piped water, and percentile of land area (among households that owned land). Ak represents fixed effects for enumeration areas; and is the error term.
In general, Table 5 shows that among individual characteristics, individual land wealth, along with years of schooling, tend to have the most consistent link across countries with higher household per capita expenditure. Being in the highest tercile of individual land wealth, for example, is positively linked with being in the top tercile of household per capita expenditure for agricultural producers in Malawi (employed and own producers), Tanzania (own producers) and Cambodia (employed), as well as rural nonfarm employed in Cambodia. Reported land ownership overall, on the other hand, has mixed effects on being in the highest tercile of household expenditure — and being in the middle of the household land area distribution, interestingly, was associated with being in the bottom tercile of household per capita expenditure in Malawi and Cambodia. The findings underscore again the stronger link of individual land wealth with welfare, and how different measures of landownership may each capture very different aspects of socioeconomic status. Other variables associated with being in the highest percentile of household per capita expenditure included access to other resources/infrastructure, including electricity and piped water.12
Table 6 also shows that compared to overall land ownership and household land area, agricultural producers in the top tercile of individual land wealth in Malawi, Tanzania and Cambodia, as well as the middle tercile in Ethiopia, are also more likely to be associated with having a financial account; the same also holds for rural nonfarm employed in Malawi. For hours worked in the last week, greater individual land wealth has positive effects just for agricultural own-producers in Ethiopia and Cambodia, as well as large effects for rural nonfarm employed in Tanzania. In this case, then, significant links between land wealth and hours worked for the employed in agriculture are less apparent, perhaps due to the mix of activities different producers are engaged in—and discussed further in Section 4. We continue to see mixed effects of overall landownership, as well as few significant effects from household land area. Access to electricity and piped water are also consistently important across countries for agricultural producers in these areas, reflecting key areas of infrastructure necessary for improved livelihoods and productivity.
The results in Section 3 show important links between individual land wealth and markers of socioeconomic status across agricultural producers. Across countries, however, many households are diversified across different agricultural and non-agricultural activities, and within agriculture, between mainly own production versus sale. This section discusses how an intrahousehold perspective, underscored by individual-level data within households, is therefore also important for understanding and targeting socioeconomic outcomes in agriculture.
Diversification within and across sectors in the LSMS + surveys
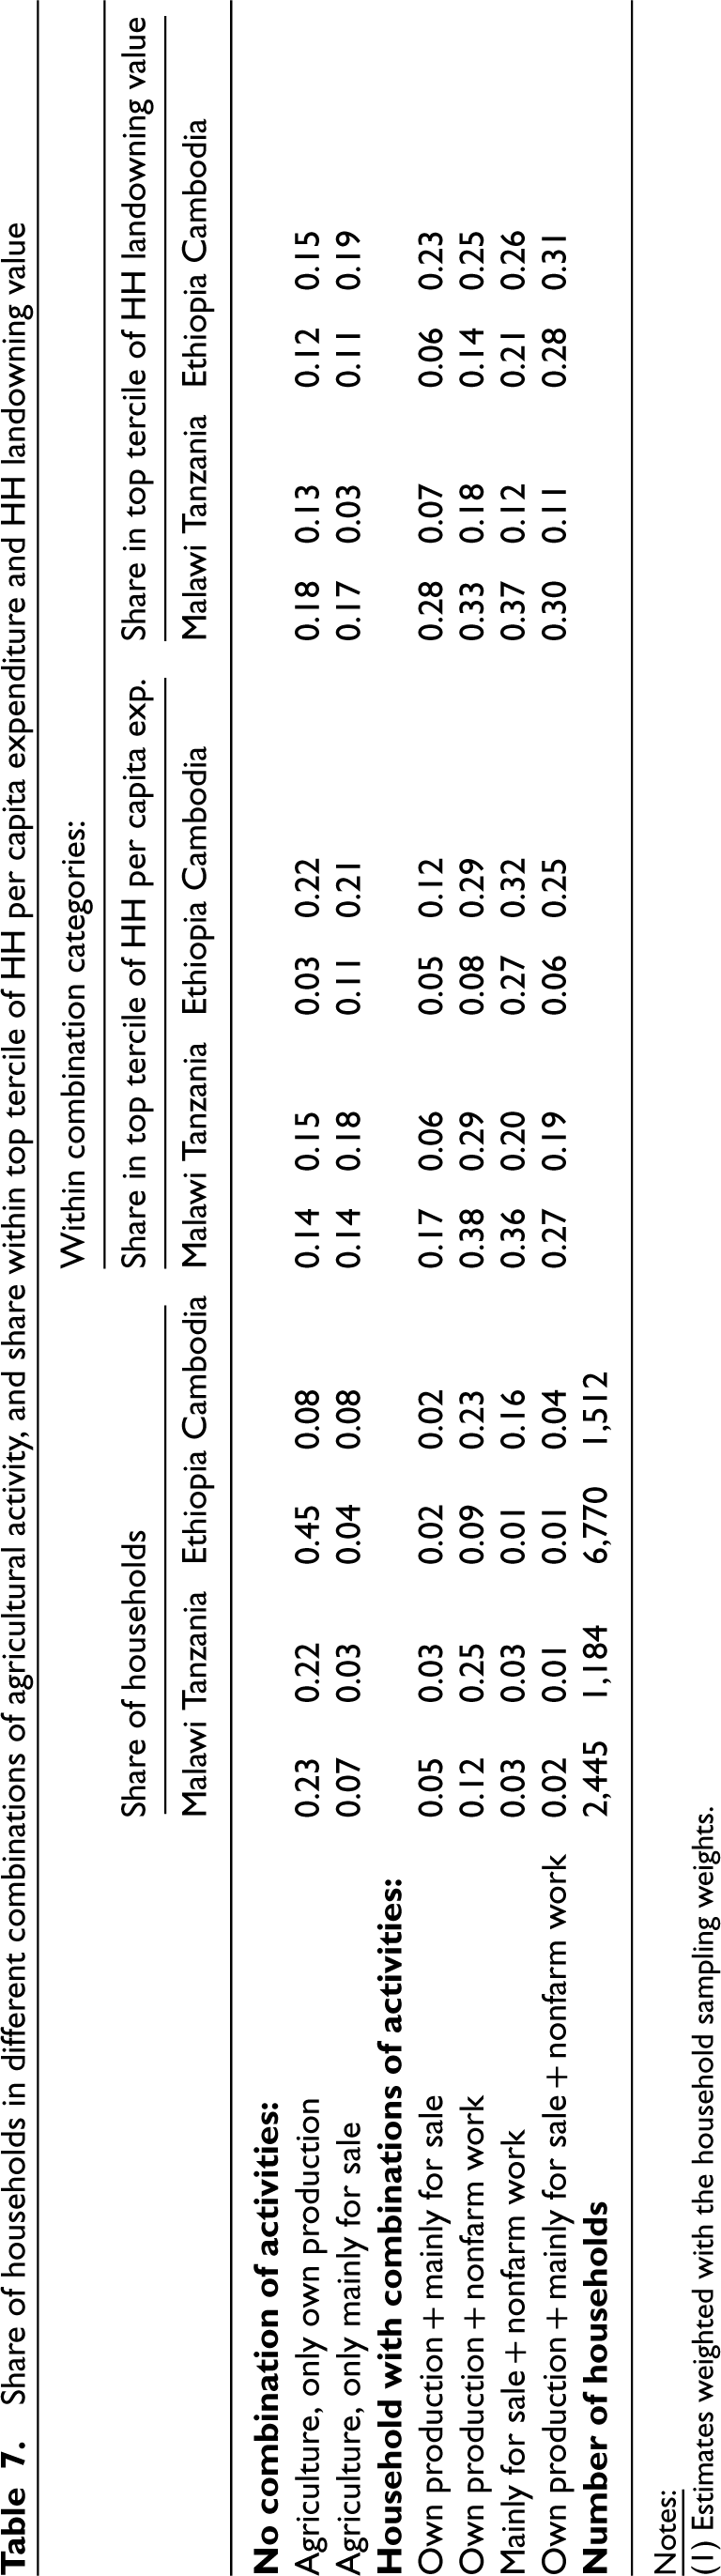
Table 7 shows that in Tanzania and Malawi, 22-23 percent of households are engaged entirely in agricultural own-production activities, while 12 percent of households in Malawi and 25 percent in Tanzania have household members working in either own production and/or nonfarm wage or enterprise activities. In Ethiopia, a much greater share (45 percent of households) are entirely in own-production, with about 9 percent in both own-production and nonfarm work. In Cambodia, households are much more likely to diversify—23 percent are in own-production and nonfarm work, 16 percent in agricultural employment (mainly for sale) and nonfarm work, and 4 percent in all three areas. Table 7 also shows, generally, that households diversifying across agricultural and nonfarm work tend to have higher per capita expenditure, and are in the top tercile of household landowning value across all members, compared to those solely in agriculture. While most labor force surveys do have information for all individuals in the household, the relative lack of detailed analyses of the within-household context can mask the extent to which income diversification is occurring within agriculture.
Share of households in different combinations of agricultural activity, and share within top tercile of HH per capita expenditure and HH landowning value
Share of households in different combinations of agricultural activity, and share within top tercile of HH per capita expenditure and HH landowning value
(1) Estimates weighted with the household sampling weights.
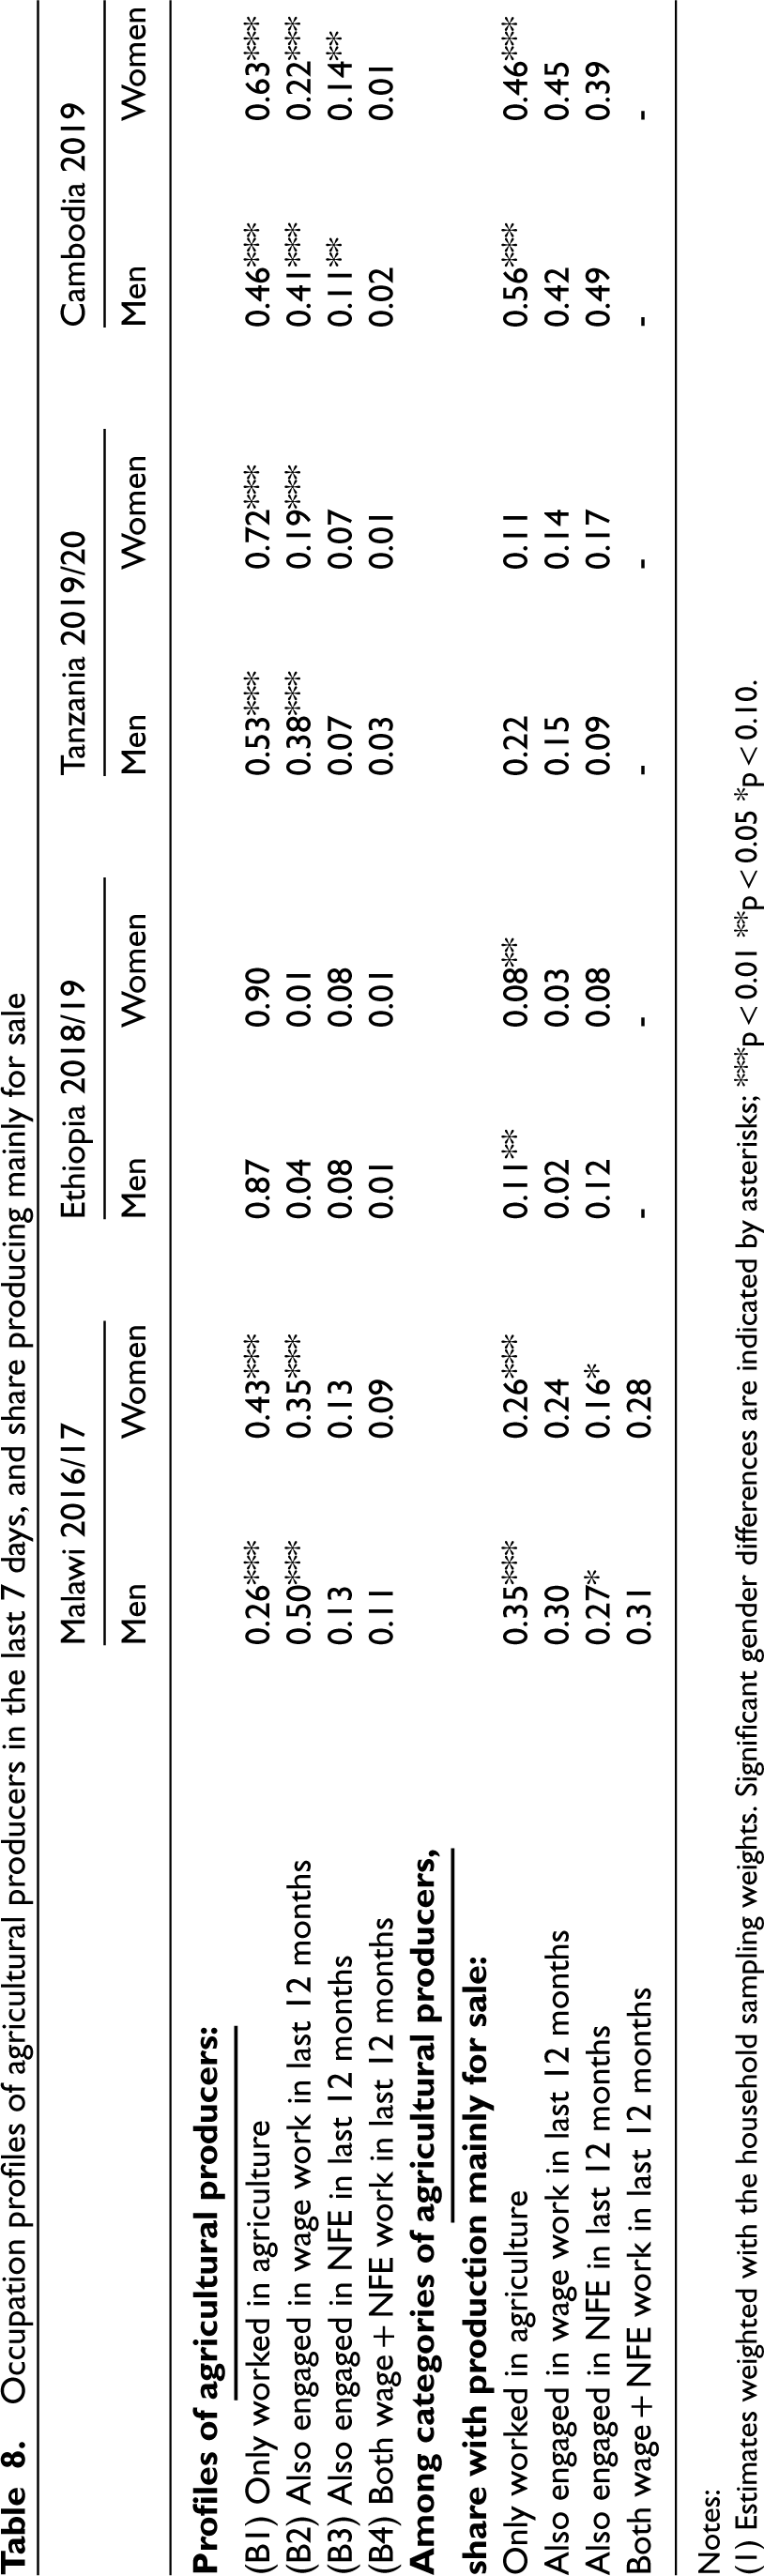
Occupation profiles of agricultural producers in the last 7 days, and share producing mainly for sale
Notes:
(1) Estimates weighted with the household sampling weights. Significant gender differences are indicated by asterisks; ***p < 0.01 **p < 0.05 *p < 0.10.
A related issue is that among multi-topic household surveys, additional questions on the range of respondents’ activities within agriculture (not just the main activity) can be helpful in identifying and targeting employment among agricultural producers. In Malawi, for example, among respondents working only in crops, 36 percent of men and 27 percent of women produced crops mainly for sale; these shares increased to 52 and 46 percent, respectively, when looking at respondents engaged in both crop and livestock activity (Figure 4). Crop producers who have additional agricultural activities are more likely to be employed in this context, as a result. The percentage increase in employment rates is greater for women than men, which may also stem from the fact that men and women often engage in different spheres of activity within agriculture [11]. Comparisons could not be made with the other countries in this study, as the employment modules in the Tanzania, Ethiopia and Cambodia surveys did not ask individuals specifically about different activities within agriculture; many multi-topic surveys do have an agricultural module which detail different activities of household members, but not necessarily with a question for each individual on whether their work in the area is mainly for sale or own production. Labor force surveys, as well as employment modules in multi-topic surveys, do ask about main and secondary activities of respondents in the last 7 days, but depend on the incidence of reporting of secondary occupations within this reference period. Because of the complementarity of activities within agriculture [23], better capturing individuals’ range of activities in the sector is helpful for improved policy design. Recent labor force and socioeconomic surveys have also increasingly asked about the main intended destination across all agricultural products (not just one aspect of production, as was this case with the Malawi survey), supported by recent discussions informing the 21st ICLS as well [5, 21].
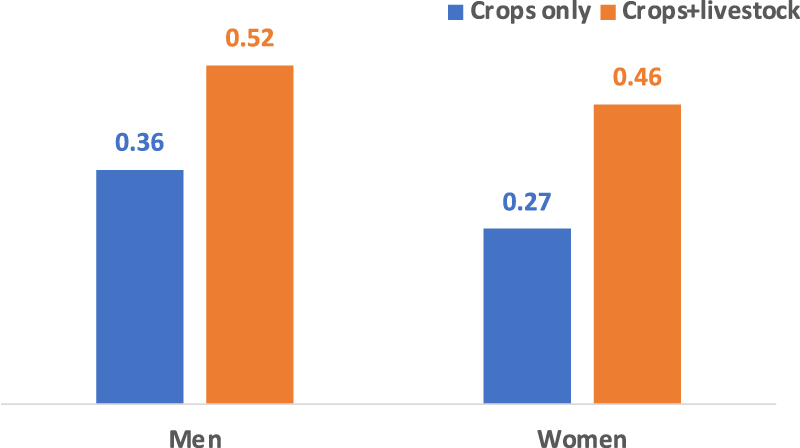
Malawi 2016/17: among agricultural producers in the last 7 days: share producing crops mainly for sale, by whether individuals only engaged in crop production or crops + livestockNotes: (1) Estimates weighted with the household sampling weights. Both rural and urban areas included. (2) Because the intention to sell in the Malawi survey was asked only of crops, producers only in livestock were not included in the figure. (3) Fishing was included in “livestock,” since the share of farmers in fishing was very low (2 percent among agricultural producers).
Table 8 shows that questions not only about work in the last 7 days, but also over longer periods such as the last 12 months, are useful in identifying multiple sources of income. Among agricultural producers in Malawi, for example, 26 percent of men and 43 percent of women were solely engaged in agriculture (B1), while 50 and 35 percent, respectively, also had nonfarm wage work in the last year (B2), and 13 percent in agriculture and non-farm enterprise work (B3). In Tanzania and Cambodia as well, about 20 percent of women and 40 percent of men agricultural producers were also in nonfarm wage activity over the past year— and in Cambodia, 14 percent of women and 11 percent of men were in agriculture and nonfarm enterprise work. A much smaller share of respondents across countries were in all three areas of work over the past year, with the exception of Malawi (about 10 percent of men and women). Table 8 also shows that generally, agricultural production for sale was mainly concentrated among individuals whose activities were entirely in agriculture, although substantial shares of men and women (particularly in Malawi and Cambodia, and to a lesser extent in Tanzania) were also in wage and nonfarm enterprise work.
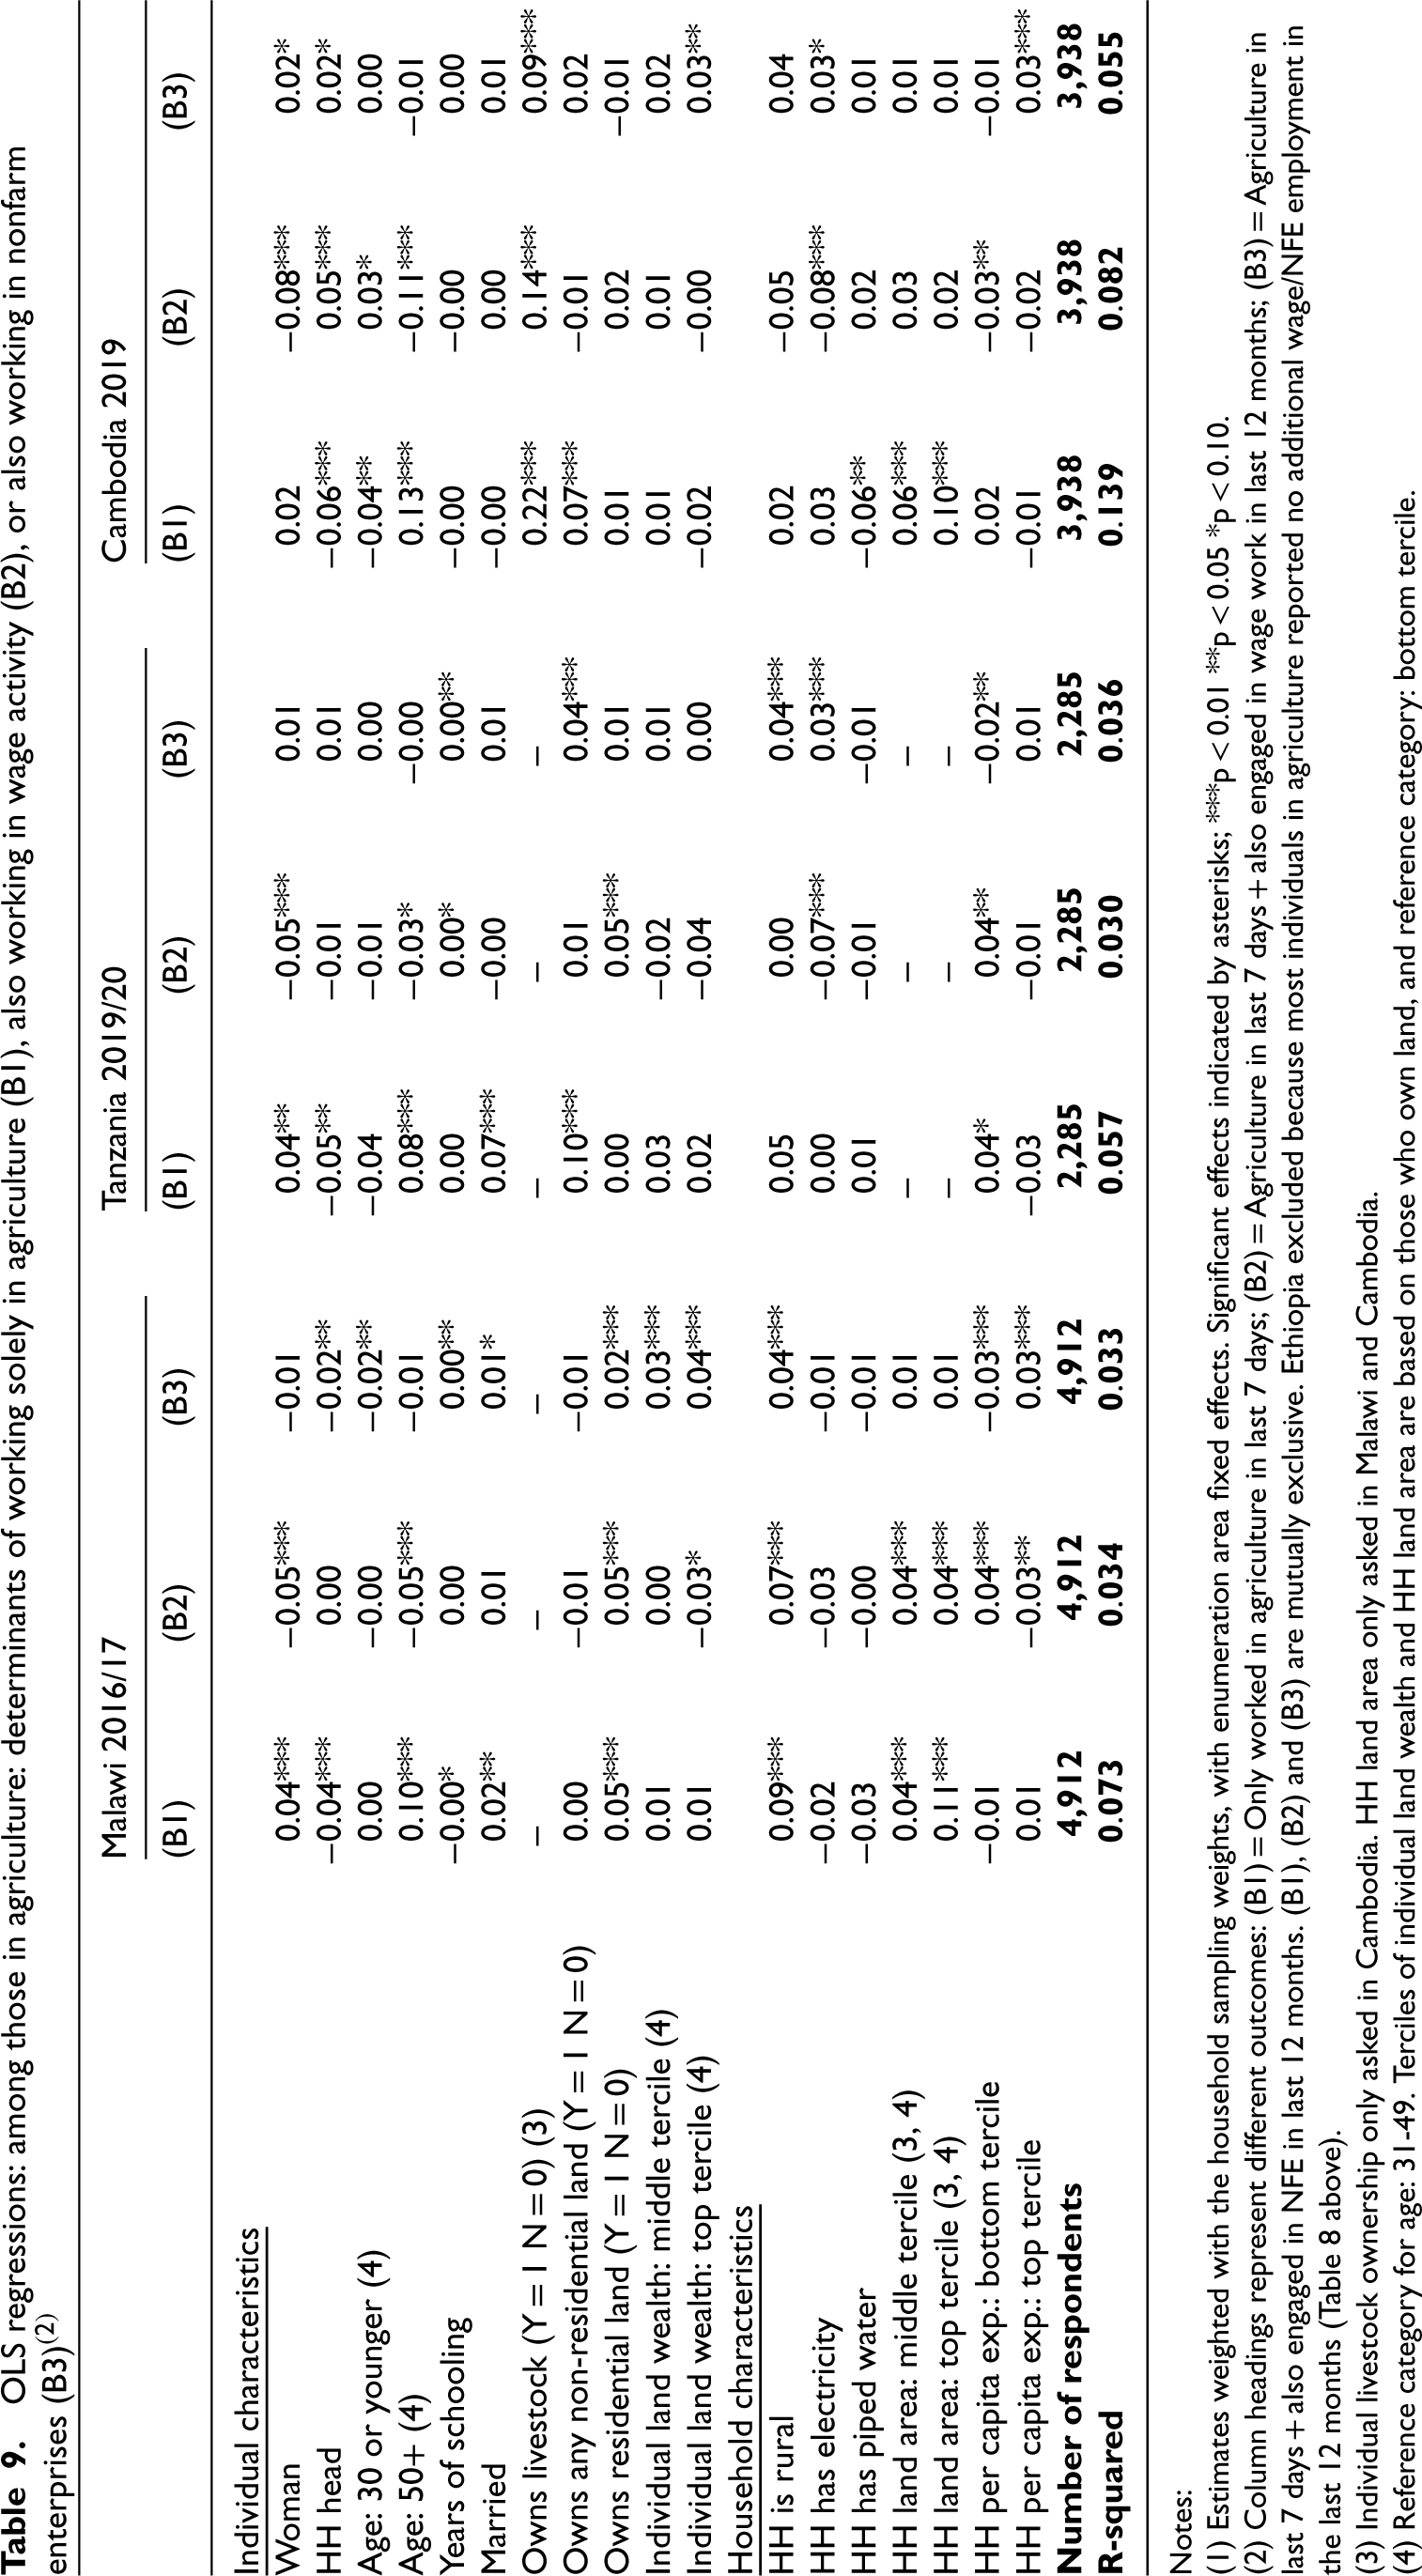
OLS regressions: among those in agriculture: determinants of working solely in agriculture (B1), also working in wage activity (B2), or also working in nonfarm enterprises (B3)(2)
Notes:
(1) Estimates weighted with the household sampling weights, with enumeration area fixed effects. Significant effects indicated by asterisks; ***p < 0.01 **p < 0.05 *p < 0.10.
(2) Column headings represent different outcomes: (B1) = Only worked in agriculture in last 7 days; (B2) = Agriculture in last 7 days + also engaged in wage work in last 12 months; (B3) = Agriculture in last 7 days + also engaged in NFE in last 12 months. (B1), (B2) and (B3) are mutually exclusive. Ethiopia excluded because most individuals in agriculture reported no additional wage/NFE employment in the last 12 months (Table 8 above).
(3) Individual livestock ownership only asked in Cambodia. HH land area only asked in Malawi and Cambodia.
(4) Reference category for age: 31-49. Terciles of individual land wealth and HH land area are based on those who own land, and reference category: bottom tercile.
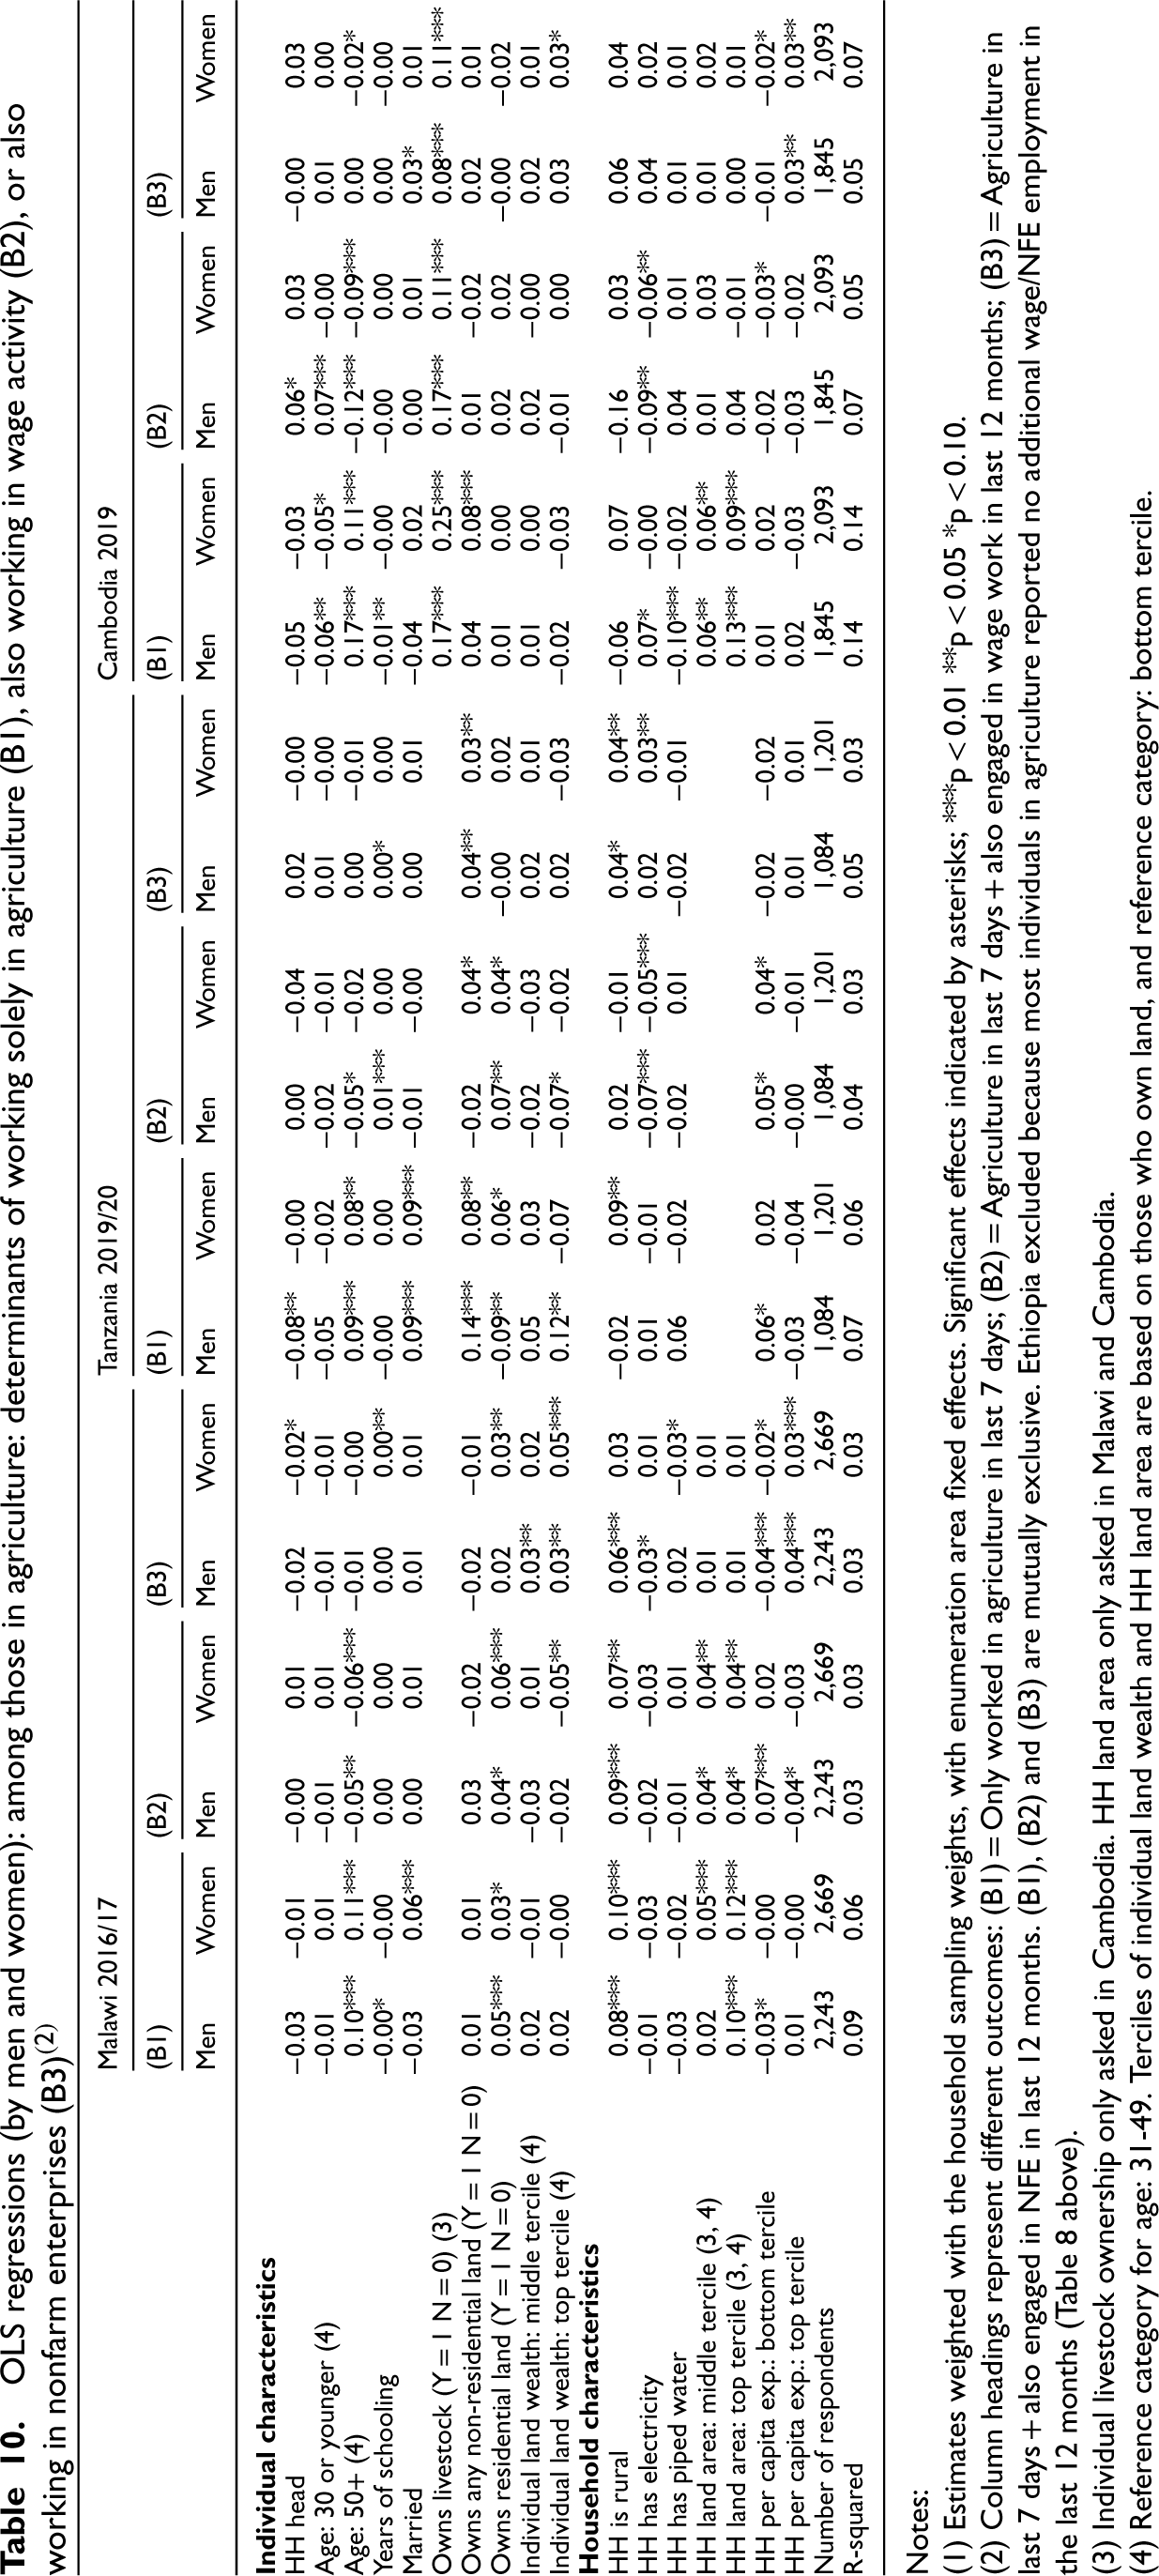
OLS regressions (by men and women): among those in agriculture: determinants of working solely in agriculture (B1), also working in wage activity (B2), or also working in nonfarm enterprises (B3)(2)
Notes:
(1) Estimates weighted with the household sampling weights, with enumeration area fixed effects. Significant effects indicated by asterisks; ***p < 0.01 **p < 0.05 *p < 0.10.
(2) Column headings represent different outcomes: (B1) = Only worked in agriculture in last 7 days; (B2) = Agriculture in last 7 days + also engaged in wage work in last 12 months; (B3) = Agriculture in last 7 days + also engaged in NFE in last 12 months. (B1), (B2) and (B3) are mutually exclusive. Ethiopia excluded because most individuals in agriculture reported no additional wage/NFE employment in the last 12 months (Table 8 above).
(3) Individual livestock ownership only asked in Cambodia. HH land area only asked in Malawi and Cambodia.
(4) Reference category for age: 31-49. Terciles of individual land wealth and HH land area are based on those who own land, and reference category: bottom tercile.
Given substantial diversification of activities among agricultural producers, what are socioeconomic correlates that might help better identify these workers through a policy lens? Tables 9 and 10 present OLS regressions, similar to equations (1a-1c) earlier, that examine socioeconomic profiles of agricultural producers, across these different categories:

In Equation (2), yijk is a binary variable, for individual i in household j and enumeration area k, taking the value 1 depending on whether B1 = 1, B2 = 1, or B3 = 1, following Table 8 above. Xij individual- and household-level characteristics similar to those in the regressions in Tables 5-6, but which also includes the bottom and top tercile of household per capita expenditure on the right hand side. In addition to full sample regressions in Table 9, regressions were also run separately for men and women, to better understand socioeconomic correlates of working in different activities. Again, the aim of these regressions is not to explore causal links, but rather what variables are more closely correlated with profiles of agricultural producers.
Looking first at Table 9, women are much more likely than men to be solely in agriculture across countries, for example, as well as those who are aged 50 and older (column B1). Those in agriculture who are also engaged in wage work (column B2) are more likely to be younger, male, and more likely to be in the bottom tercile of household per capita consumption; they do have residential landowning (at least in the case of Malawi and Tanzania), but the value of landowning tends to be lower in Malawi for this group. Individuals in agriculture but also with some nonfarm enterprise activity (column B3), on the other hand, are more likely to have higher individual land wealth, as well as situated in the top tercile of household per capita expenditure.
The findings, in general, continue to underscore how different aspects of land ownership are linked differently with profiles of agricultural producers. Greater individual land wealth, in particular, is the most consistently linked with agricultural producers that also engage in some nonfarm activity (which Table 7 shows also tend to be better off vis-à-vis per capita expenditure), among different combinations of residential and non-residential owners. Greater landowning area, on the other hand, is significantly linked with being solely in agriculture in Malawi and Cambodia, as well as in agricultural and wage work in Malawi, but with little association for those also in nonfarm enterprise activity—supporting the links across Figures 3a-3b and Table 7 that landowning area, as compared to value, is less linked with household consumption as a measure of welfare.
Table 10 also reveals substantial differences in the link between individual landowning wealth and activity profiles by sex. The positive association between individual landowning wealth and agriculture/nonfarm enterprise activity (B3) tends to be stronger for women in Malawi, as well as to a lesser extent in Cambodia. Men in Tanzania who are solely in agriculture (B1) are also more likely to be in the top tercile of individual land wealth, with no significant effects for women. Only women in Malawi, and only men in Tanzania in agriculture and wage work (B2) are also significantly less likely to be in the top tercile of individual land wealth. Contextual factors, including differences in how landowning are traditionally allocated across men and women, are likely a key factor underlying these differences [8, 19]. There is less variation across men and women for other land-related variables on ownership and household land area — indicating that data on individual landowning wealth allows for a more nuanced understanding on whether men or women may be more or less likely to be engaged in specific activities.
Along with these recommendations, however, the costs need to be considered of collecting individual-level, self-reported data on landowning and wealth in nationally-representative surveys. To address these concerns, a separate 2024 study using the paradata from the LSMS + surveys examines the per-question and per-module costs of the self-reported, individual level modules in the LSMS + [24]. Among the results include that the land module, while the longest module to administer in each LSMS + country, has an average duration ranging from 8 to 13 minutes (based on a full-length module). Separately, even within individual-level data collection, a quasi-experimental study comparing landownership estimates across the self-reported Malawi LSMS + and the concurrent, nationally representative 2016 Malawi Integrated Household Survey that allowed for proxy reporting, showed the latter approach led to lower reported landownership among women vis-à-vis men [25]. At the end, given the significant role land wealth plays in our findings as compared to other metrics of landownership — as well as the importance of self-reported data — the value of collecting this information at the individual level bears well against the cost.
The new standards on informality, stemming from the 21st ICLS, provide an important platform on which to better understand the disaggregated profiles of informal workers. This paper provides new insights — using self-reported, individual-disaggregated data in a subset of low- and middle-income countries — into the varied profiles of informal agricultural producers, particularly along dimensions of individual landowning and land wealth. In so doing, a key goal of this paper is to identify areas of data collection that can help shed light on vulnerabilities among this group. The relatively greater role of individual-level land wealth, for example, highlights areas of survey data collection going forward that can help us better understand socioeconomic and occupational profiles of these workers. Seasonality, as well as the substantial extent of rural income diversification over a longer (12-month) timeframe also point to the importance of expanding reference periods for agricultural work, as well as additional data on secondary occupations and main intended destination of agricultural production. Alongside additional data and analyses of employment vis-à-vis own-use production in agriculture, as well as intra-household-level analyses of income diversification and wealth, this can all help in better understanding sources of income and resilience for agricultural producers, and in turn, aid in measuring broader structural transformations in agriculture — all of which are relevant for policy targeting and design.