
Abstract
This paper describes the compilation of the OECD Key Indicators of Informality based on Individuals and their Household (KIIbIH) database, a new dataset that builds upon household surveys to provide comparable indicators and harmonised data on the socio-economic characteristics of informal workers in 50 countries across North and sub-Saharan Africa, Eastern Europe and Central Asia, Asia and the Pacific, and Latin America and the Caribbean. Whereas other publicly available harmonised statistics on informality largely draw upon labour force surveys to estimate the size of informal employment, the KIIbIH uses household surveys to provide more information on the socio-demographic and economic status of workers and their household. Overall, the database provides useful information for policy makers when developing their formalisation strategy and designing policies to tackle the vulnerability of informal workers taking into account their household context.
Introduction
People's perceptions about the informal economy vary greatly. Some focus on the survivalist aspects believing that in developing economies many workers have no choice but to run or being employed in small businesses, with very low levels of productivity, with poor working conditions, low wages and no access to social insurances or social protection. Others consider economic and labour informality as a parasitic phenomenon, a tug on economic and social development, normally associated with tax evasion, little respect for the rule of law and unfair competition between formal and informal enterprises. Finally, others recognise its potential to support the livelihoods of workers, in some stages of economic development, who would prefer formalisation but find little opportunities to be employed in the formal economy. Whatever the perceptions are, two things are certain: today, the vast majority of people in developing economies depend on the informal economy for their livelihoods, and this often comes with risks and vulnerabilities that constitute a formidable policy challenge.
In recent years, several steps have been taken to recognise the reality of the informal economy and address some of its adverse effects on well-being. The ILO adopted in June 2015 the Recommendation No. 204 1 concerning the transition from the informal economy to the formal economy. The target 8.3 of the UN Sustainable Development Goals, include a direct reference to formalisation, while the Target 1.3 instituted a global commitment to implement nationally appropriate social protection systems for all persons. 2
As more and more governments throughout the world are seeking ways to address the vulnerability challenge in the informal economy and support the formalisation agenda, developing comprehensive portraits of informality that capture the heterogeneity of informal workers and take into account the broader context of their households becomes essential. A thorough understanding of the human experience of informality and the various channels through which social protection can reach out informal economy workers requires indeed going beyond a narrow individual or firm perspective of informal employment to include a household dimension.
The Key Indicators of Informality based on Individuals and their Household (KIIbIH) is a database compiled by the OECD Development Centre since 2017 and which is of primary interest for policy makers engaged in the formalisation agenda and the extension of social protection. Whereas other publicly available harmonised statistics on informality largely draw upon labour force surveys to estimate the size of informal employment, the KIIbIH uses household socio-economic surveys to provide more information on the socio-demographic and economic status of workers and their households. The dataset currently covers 50 countries across the world in North and sub-Saharan Africa, Eastern Europe and Central Asia, Asia and the Pacific, and Latin America and the Caribbean and features a time series dimension for several countries.
By covering both individuals and their households, the database allows for a comprehensive monitoring of informality that captures the heterogeneity of informal economy workers, taking into account the broader context of their households. The household dimension allows the monitoring of how workers’ vulnerability in the informal economy is passed on to other segments of the population and also enriches our understanding of the different channels through which social protection can reach out to informal workers as part of the formalisation agenda. As such, the KIIbIH complements other international databases on informal employment. The KIIbIH also provides a unique tool for social policy making and monitoring, which often requires information about individuals and their households. The database is published on the OECD data portal and has a wide dissemination in English and French.
Data and methodology
This section describes the data sources and the methodology employed to construct a comparable dataset that can be used for monitoring informality across countries.
Data sources
The KIIbIH primary sources used to calculate its indicators are household surveys data - either household living conditions or household income surveys. The full list of data sources, together with the years covered by the database, is provided in full details in Annex A.
As opposed to other harmonised data sources of international organisations, the KIIbIH database has a broader scope. The clear advantage of household socio-economic surveys (i.e., whose primary objective is to measure the socio-economic conditions of households) is that they provide information on both individuals and households such as the work status of all adult household members, household income and/or consumption, poverty status, family composition, and access to basic services, and the coverage of social programmes which are normally not tracked in labour force surveys. Moreover, in many socio-economic household surveys, particular modules allow to draw information on education and health status of each family component, allowing more in-depth information on some features of people's well-being living in families depending entirely or partially on informal work. Additionally, the KIIbIH contains some panel datasets, which allow for tracking transitions in informal employment, poverty, and other socio-economic conditions over time. All in all, this information allows to shed light on specific vulnerabilities linked to some socio-economic characteristics that are not traditionally captured by labour force surveys and to deepen the analysis of the impacts of informality on people's livelihood.
However, relying on socio-economic household surveys instead of labour force surveys for the KIIbIH has also some limitations. First, in many developing countries, especially in low or low-middle income ones, those types of surveys are carried over time in lower frequency compared to labour force surveys. Second, the sample size of socio-economic household surveys is generally smaller than in labour force surveys, resulting in larger sample errors which negatively affect the analysis of small clusters and sub-groups of people. Due to these considerations, the KIIbIH data shall be considered as a complement to existing data on informal employment, rather than as a substitute.
Methodology
Selecting household surveys and harmonising variables for informality monitoring
As a starting point for the construction of the KIIbIH dataset, a comparison of the information provided in the household survey questionnaire and the information needed to produce the KIIbIH indicators is undertaken for each household survey in the year and country of interest. In the case of missing information on non-essential information, the variable is defined as missing. Available indicators are then recoded and harmonised across all surveys for each country and year. At this preliminary stage, external macroeconomic variables that are needed to calculate welfare indicators, such as the level of economic development (i.e., low, low-middle, middle, high-middle income country, as defined by the World Bank) purchasing power parities, exchange rates or consumer price indexes are imported in each country datafile.
In a second step, an aggregate and cross-country comparable indicator of informal employment is constructed. The algorithm used to functionally define informal employment conceptually follows the methods of the ILO resolution concerning statistics of employment in the informal sector, adopted by the 15th ICLS, 3 and the ILO Guidelines concerning a statistical definition of informal employment, endorsed by the 17th ICLS 4 (see section 4, for the conceptual framework). New standards have been adopted, by the 21st ICLS 5 and the methodology will evolve as household surveys adjust to the new functional definition of labour informality. In minor extents, the methodology of the KIIbIH may diverge from the ILO guidelines for functional reasons, essentially due to the constraints given by the available household surveys’ questionnaires.
In the country datafile of the KIIbIH, depending on the availability of the questions in the surveys’ questionnaires, some preliminary information on the variables needed to define the formal and informal sector, and the formality status of workers is collected and coded. Concerning the economic sector in which the units of production operate, the following six variables are constructed as follows:
The first variable stores information on the institutional sector of the unit of production in which the worker operates, following the 17th ICLS labour statistician guidelines, which are based on the National Accounts framework for categorising the institutional sectors of units of production: the public sector, the private sector, the household production sector or a residual category. The second variable categorises the production unit according to the destination of its products/services, either for the market or for own consumption. The third variable includes information on the bookkeeping practices of the units of productions: whether they keep or not regular books of their operations. The fourth variable records of the registration of the unit of production in tax authorities or other government registries: whether they are registered or not. The fifth variable contains information on the place of operation of the units of production: whether they operate in fixed place of work, or not. The sixth variable stores information on the size of the units of production, in term of persons employed: if they employ 5 or less employees or more than 6. The first variable contains information on whether the worker contributes to any social security scheme, such as pension or health insurance. The second variable categorises workers according to whether they are entitled to paid annual leave. The third variable stores information on whether workers are entitled to paid sick leave. The fourth variable distinguishes workers according to their contractual status: whether they are hired with a written contract or not.
Additional variables are then constructed to identify the personal status of workers, using the surveys’ questionnaires on the contribution to social security and some contractual rights of the workers, as follows:
The algorithm used in the KIIbIH to define informality – at sectoral and personal level – makes use of all the information stored in the above-mentioned variables, according to its availability, and of the variable coded with the status in employment of workers, as defined in the International Classification of Status in Employment (ICSE), adopted by the 15th International Conference of Labour Statisticians.
6
The informal sector is categorised in three modalities, formal, informal or household sector according to the following procedure, which is run step by step (i.e., starting from the first rule, the second one applies only if the unit of production is still not categorised:
The unit of production is defined as operating in the formal sector if its production process is run in the public sector or if it keeps books and, at the same time, it is not producing just for own use. Moreover, it is defined as a formal unit if it is registered to tax authorities. The unit is considered as formal if it has a fixed place of work or employs more than 5 employees. Finally, in the exceptional case that a unit of production employs non-contributing family workers who nonetheless contribute to social security, it is considered as operating in the formal sector. The unit of production is defined as operating in the household sector if its production process is run in the household sector. Moreover, it is considered as a household unit if the production process is run in the private sector, or no information can be drawn from this variable, and at the same time the destination of its products or services is for own use. The unit of production is defined as operating in the informal sector if it is not registered to tax authorities. Moreover, it is considered as an informal unit of production if has no fixed place of work, or if it employs 5 or less workers. Finally, if no information can be drawn from any of the variables of interests, the variable is coded as missing. By definition, contributing family workers are considered as informal. A worker is classified as informal in case is an employee, or no information can be drawn from the status in employment, and at the same time the employer for which he works contributes to social security. Moreover, the employee, or again no information is present on his status, and there is no information on whether the employer contributes to social security, is considered informal if is not entitled to annual paid leave or paid sick leave. In all other cases he is considered a formal worker. A worker is classified as informal in case is an employer or an own-account worker (hereafter self-employed), and at the same time the economic unit operates in the informal sector. The information on whether the self-employed is contributing to social security is used as a proxy of the registration of the firms in case this information is missing in the questionnaire. On the contrary, if the self-employed operates in the formal sector, or if contributes to social security in case of missing information on the registration status, he is considered a formal worker. If no information is present on the formality status of the sector in which the worker is employed, or no variable on personal status as defined above contains information, the variable on informality status is coded as missing.
The formality status of workers is defined crossing the information on the informal sector, as explained above, the status in employment, and the information on personal status stored on the fourth variables mentioned earlier in this section. The variable is a dummy, categorising workers as formal or informal in the following step by step procedure:
The validation and the publication of the KIIbIH indicators is done on a country per year basis. Some basic indicators are calculated from each country file and year available, and they are then compared with external data sources, published by other international organisation (the International Labour Organisation and the World Bank), by national statistical office or other government bodies which are responsible of collecting and producing statistics based on the specific household survey. The indicators used as validation instruments are the following:
Employment rates of the working age population Informality rates National poverty rates
In case these basic indicators do not match as close as possible the ones published by other official databases, as defined above, the entire country file is not validated, and no statistics are published in the KIIbIH database. For employment rates and informality rates, the KIIbIH estimates were compared with the same indicators published by the International Labour Organisation in its database (ILO, 2024[7]), for the respective country and year. For employment rates of the working age population the mean difference and mean absolute difference between the validated KIIbIH estimates and the ILO ones are, respectively, 0.4 and 4.7 percentage points and the statistical t test comparing the means of the two samples indicates that the difference is not statistically significant (t = 0.17, P value = 0.86). For informality rates those differences are, respectively, 0.3 and 3.9 percentage points, and the t test suggests an insignificant difference between the two samples of estimates (t = 0.45, P value =0.65). These statistics signal the overall good quality of the KIIbIH compared to similar published statistics.
Given that the primary objective of the KIIbIH is to provide information on informal workers and their households, further checks are run to ensure that the distributions of informal workers across gender, age groups and worker status match as closely as possible the ones published by the International Labour Organisation in its database. 7 In case of extreme values in the distributions, the statistics based on the specific breakdown are not published in the KIIbIH database.
Key indicators
This section provides the list and the definition of key indicators produced in the KIIbIH. A variable map is produced for each survey wave, which is used to construct the harmonized indicators described below. Most variables are harmonized in their definition, except where specified. The full list of indicators which can be produced using the KIIbIH are presented in Annex B.
Socio-demographic
Age, gender, civil status, educational attainment, location (urban/rural)
Age groups are defined according to two classifications: an overall classification, and a classification specific to dependents. In the overall classification, ages are broken down into six groups: 15–24, 25–29, 30–34, 35–54, 55–64, 65 + years. Dependents of the households are categorized into three groups: infants (0–4 years), children (5–14 years), and older persons (60 + years). The gender variable is limited by the level of disaggregation in the data and based on the binary definition of sex.
Civil status is grouped into four main categories: single (unmarried, or without civil union), civil union/married, separated/divorced, and widowed.
Educational attainment is measured as an individual's highest level of education attained, according to the broad categories of the ISCED classification of none/less than primary, primary, secondary, tertiary, and other. Where data permit, educational attainment categories closely follow ISCED mappings by country. 8 In cases where attainment information is not available, highest level attended is used instead.
Because of national differences in the characteristics that distinguish urban from rural areas, the distinction between urban and rural population is not amenable to a single definition that would be applicable to all countries. Most national definitions are based on size of locality. In general, however, population which is not urban is considered rural. In the KIIbIH database, location is not currently harmonized and relies on the national or survey definition of urban and rural areas.
Household
Generally, the concept of a household is based on the arrangements made by persons, individually or in groups, for providing themselves with food or other essentials for living. A household may be either a one-person household, that is to say, a person who makes provision for his or her own food or other essentials for living without combining with any other person to form part of a multi-person household, that is to say, a group of two or more persons living together who make common provision for food or other essentials for living. The persons in the group may pool their incomes and may, to a greater or lesser extent, have a common budget; they may be related or unrelated persons or constitute a combination of persons both related and unrelated. In the KIIbIH, households are currently defined as persons who live under a common roof and pool resources. Most surveys use this definition, and typically no modifications are made to the defined household structure as it exists in the base survey.
Treatment of domestic employees and non-resource pooling household members varies. In Latin America, if live-in domestic employees (and their dependents) do not partake in the resources pooled by their employers, they are separated from the main household and placed into a separate “sub”-household category.
Household dependency ratios (total, child, elderly, disabled)
Simple household dependency ratios are calculated for the share of children, elderly and disabled persons, wherein the number of dependents is divided by the number of workers in the household.
Disability is included where the data permits, for individuals flagged as suffering from a chronic disability.
Employment
Employment
A person is considered to be employed if she has worked at least one hour, in any job, in the past seven days; or are normally employed but “not at work” due to temporary absence from a job, or due to their personal working-time arrangements. In older surveys, employment may be based on the definition of having worked at all in the past 12 months. A person is considered unemployed if she has been actively looking for work in the past four weeks, and available to take a job within two weeks.
The following employment indicators are calculated for primary and secondary jobs, where secondary job information is available.
Informal employment
Informal sector
Economic units are considered to be part of the informal sector if the following series of criteria are met:
The institutional sector of the economic unit are farms or private businesses. The final destination of production is at least partly for the market. The economic unit is not currently registered with social security authorities, sales or income tax authorities, or other bodies following national legislation. The economic unit does not maintain a set of official accounts, or other accounts as required by law.
Informal employment
The definition of informal employment differs by status in employment. Employees are considered to have informal jobs if their employment relationship is, in law or in practice, not subject to national labour legislation, income taxation, social protection or entitlement to certain employment benefits (advance notice of dismissal, severance pay, paid annual or sick leave, etc.). In the case of own-account workers and employers, the informal employment status of the job is determined by the informal sector nature of the enterprise. Employers (with hired workers) and own-account workers (without hired workers) are considered to be informal when their economic units belong to the informal sector. All contributing family workers are classified as having informal employment, irrespective of whether they work in formal or informal sector enterprises. More information on the functional definition of the informal sector and informal employment is provided in section 3.
Other indicators
Wage and earnings
Wages and earnings are provided as the average remuneration for an hour of work. Average hourly wage/earnings are typically calculated by dividing the equivalent of the average pay for one week of work by the number of hours worked in a week. Wages and salaries include the values of any social contributions, income taxes, payable by the employee even if they are actually withheld by the employer for administrative convenience or other reasons and paid directly to social insurance schemes, tax authorities, etc., on behalf of the employee. Wages and salaries may be paid in various ways, including goods or services provided to employees for remuneration in kind instead of, or in addition to, remuneration in cash. However, the actual definition of wages varies greatly across countries’ household surveys.
Weekly hours worked
Actual hours worked are typically provided for the past week of work. Actual hours worked should include hours worked during normal hours of work, time worked in addition to hours worked during normal periods of work (overtime), time spent at the place of work on preparation of the workplace, repairs and maintenance. They should exclude hours paid for but not worked, such as paid annual leave, paid public holidays, paid sick leave, meal breaks, and commuting time spent on travel. Where unavailable, hours normally worked over a week period are used. Usual hours of work per week identifies the most common working schedule during a typical week of a person in employment.
Firm size
Firms are categorized into small, medium and large sized enterprises. Small firms are considered to have 1–5 employees; medium firms are considered to have 6–20 employees, and large firms are considered to have 21 and more employees.
Industry and economic sector
Industry variables are identified and converted to their corresponding ISIC Rev. 4 categories, when possible, for detailed analytical objectives. In some cases, survey data were collected before ISIC Rev. 4, 9 in which case ISIC Rev. 3.1 10 or earlier categories were used instead. Economic sectors are further categorised in two ways: (i) primary, secondary, and tertiary; and (ii) agriculture, industry, and services.
Occupation
A job is defined as a set of tasks and duties executed, or meant to be executed, by one person. A set of jobs whose main tasks and duties are characterised by a high degree of similarity constitutes an occupation. Persons are classified by occupation ideally though the ISCO-08 classification. 11 However, in many instances household surveys collect information on occupation according to previous international classifications, either ISCO-88 or ISCO-68,12,13 or using national classifications. In those cases, when possible, the classifications have been recoded to match ISCO-08 at one digit level.
Household level of informality
Households are categorised by the “degree” of informality among working household members. Within this definition, households can fall into one of three categories: informal, which identifies households where all working members are informally employed; formal, where all working members are formally employed; and mixed, where household members are in both formal and informal work.
These members are not ranked by importance of income; household heads who work informally are identified in a separate variable. By construction, only households with working members are accounted for in this indicator. Annex C provides estimates of the share of households with no working members, in each country and year.
Welfare
Where possible, derived values of income, consumption, and poverty are used. Adjustments are made to ensure consistency of welfare estimates with those used in the World Bank's PovcalNet poverty estimates. 14 Three units of welfare aggregate are identified or constructed: at household level, in household per capita terms, and at individual level. The rest of this section details the construction of these welfare indicators in the cases where they were constructed by OECD.
Income
Although there is considerable debate on the definition of income, in microeconomics analysis, whose primary interest is the measurement of people and households’ welfare and its distribution, income is primarily determined on the basis of what an individual perceives to be an income receipt of direct benefit to him or her. In this sense, total income is the broadest measure of income and refers to regular receipts such as wages and salaries, income from self-employment, interest and dividends from invested funds, pensions or other benefits from social insurance and other current transfers receivable. Large and irregular receipts from inheritances, etc, are considered to be capital transfers because they are unlikely to be spent.
However, functionally this definition varies greatly across household surveys, depending on the questionnaire design. In some instances, countries’ household surveys already provide a constructed estimate of total household income and the KIIbIH database directly refers to those estimates. In all other cases, total household income is constructed by first aggregating labour and non-labour-income at the individual level, then taking the total of individual income at the household level. Per capita household income is obtained by dividing total household income by the number of household members.
Consumption/expenditure
Consumption of goods or services is the household activity for the direct satisfaction of individual needs or wants or the collective needs of their members. On the contrary, expenditures are the values of the amounts that buyers pay, or agree to pay, to sellers in exchange for goods or services that sellers provide to them. Consumption differs from expenditure primarily because durable goods, such as automobiles, generate an expenditure mainly in the period when they are purchased, but they generate “consumption services” (for example, an automobile provides transportation services) until they are replaced or scrapped. Another notable difference arises from home ownership. If the household owns its home, imputed rents (i.e., the opportunity cost of home ownership) should be part of consumption, even if they do not appear in expenditures.
Consumption and/or expenditure are provided at the household level, for an average month in a standard calendar year. It is first grouped by food and non-food categories, then converted to the monthly level. The share of health expenditure in total expenditure is typically not calculated when it has not been first aggregated by the data provider, or if the question has not been asked in the survey questionnaire.
Poverty
National definition
Poverty headcount rates provided using the national line are not harmonized, with exception of the choice of poverty threshold. The national poverty lines are generally defined an income or consumption level that is considered minimally sufficient to sustain a family in terms of food, housing, clothing, medical needs, and so on. Where distinguished, the upper poverty limit is used as the national poverty line and is measured the using the welfare unit specified by each country. Adult equivalents are utilized when specified by the country's methodology, whereas in all other cases per capita estimates are used as a poverty threshold.
International
The World Bank's international poverty lines, currently set at $1.90, $3.20, and $5.50 per day are used to measure poverty in a harmonized way across countries. The welfare indicator to be used for each country in each reference year is converted to daily per capita values and divided by the Purchasing Power Parity conversion factor of private consumption.
Quintiles
Individuals are ranked according to the per capita welfare distribution, and then grouped in quintiles to calculate specific indicators (see Annex B, for more details). Quintiles based on the distribution of household income are also calculated for other specific analyses.
Social protection
Social protection variables are divided into social insurance and social assistance variables.
Social insurance
Pension contributors
Pension contributors are identified as those who are currently affiliated with a pension scheme, or who currently contribute to a pension fund through their current employment (both worker and employer contributions are counted, where distinctions are made).
Health insurance through employment
A health insurance plan or access to healthcare offered on the basis of employment is considered as a type of social insurance, and it is considered as relevant in the coding of the variable on the contributory status of workers (see section 3 for more details).
Pension receipt
Pension receipt is determined using a combination of questions in the survey. Where possible, questions asking directly about pension receipt, and type of pension are used to identify if the beneficiaries receive a contributory pension. If such questions are not included in the survey questionnaire, non-zero values of pension receipt as a source of income are used instead.
A number of different pensions are grouped in this database and are categorised based on the extent to which they are individually/privately financed. The main types of contributory pensions included are as follows: retirement pensions, old-age pensions, and survivor pensions.
Contributory capacity for social insurance at individual and household level
A worker's individual contributory capacity is constructed using information on individual earnings and assuming that high paid workers have individual contributory capacity, contrary to low and middle paid ones.
In turn, the contributory capacity is also estimated at the household level using information on both the food share in total consumption at the household level and the poverty status. To be considered as Food consumption/expenditure must account for less than half of total monthly household expenditure. Additionally, household members must not be considered poor according to the upper national poverty line.
Social assistance
Pension receipt
Pension receipt is determined using a combination of questions in the survey. Where possible, questions asking directly about pension receipt, and type of pension are used to identify if the beneficiaries receive a non-contributory or social assistance pension. If such questions are not included in the survey questionnaire, non-zero values of pension receipt as a source of income are used instead.
The main types of non-contributory pensions included are as follows: disability pensions, social pensions, and other old-age related cash transfers assimilated to a pension.
Cash Transfers
Cahs transfer schemes recipiency is constructed using information of the questionnaires of the household survey on any social assistance programmes entailing public cash transfers. If specific and relevant variables allow to distinguish the specific government programme, further information is collected on its scope, coverage, targeting and conditionalities, and the cash transfers receipt is further distinguished in conditional or non-conditional. Depending on the surveys and the programme structure the recipiency may be allocated either at individual or household level. The KIIbIH variables consider such difference and statistics are generally aggregated and analysed at household level.
Using the KIIbIH for social policy making and monitoring
The information contained in the KIIbIH is of primary interest for policy makers engaged in the formalisation agenda and the extension of social protection as spelled out in SDG 1.3 and 8.3. This section provides some examples of how the KIIbIH can be used to address key social policy questions such as: What could be the appropriate mix of schemes in social protection extension strategies? What are the different options to extend social assistance and social insurance to informal workers?
Finding the right combination of non-contributory and contributory schemes
As countries look at the different ways to extend social protection to informal economy workers, it is essential to portray informal workers within their household context. Monitoring household-level characteristics is essential to provide answers to a range of information needed to develop an effective social protection extension strategy and to tackle vulnerability among groups exposed to informality.
Looking at the distribution of informal workers by income can yield information to determine the appropriate mix of schemes in social protection extension strategies. This is especially important for deciding upon the delivery mechanism of means-tested social assistance schemes, and other contributory and non-contributory programmes.
The KIIbIH database offers a typology of informal workers by income class that could be used as one criterion for analysing and deciding which types of schemes to extend to which workers (e.g., means-tested non-contributory schemes, subsidized contributory schemes, non-subsidized contributory schemes). What is remarkable is that in many countries, the extension of anti-poverty programmes would cover a large share of informal workers. From the KIIbIH data, and using international poverty lines for comparison purposes, we estimate indeed that about 86% of the informal workers of Zambia would be covered if anti-poverty programmes managed to entirely cover poor informal workers (at Int. USD 2.15/day), with similarly large numbers for Madagascar (74.9%), India (70.7%), and more (Figure 1).
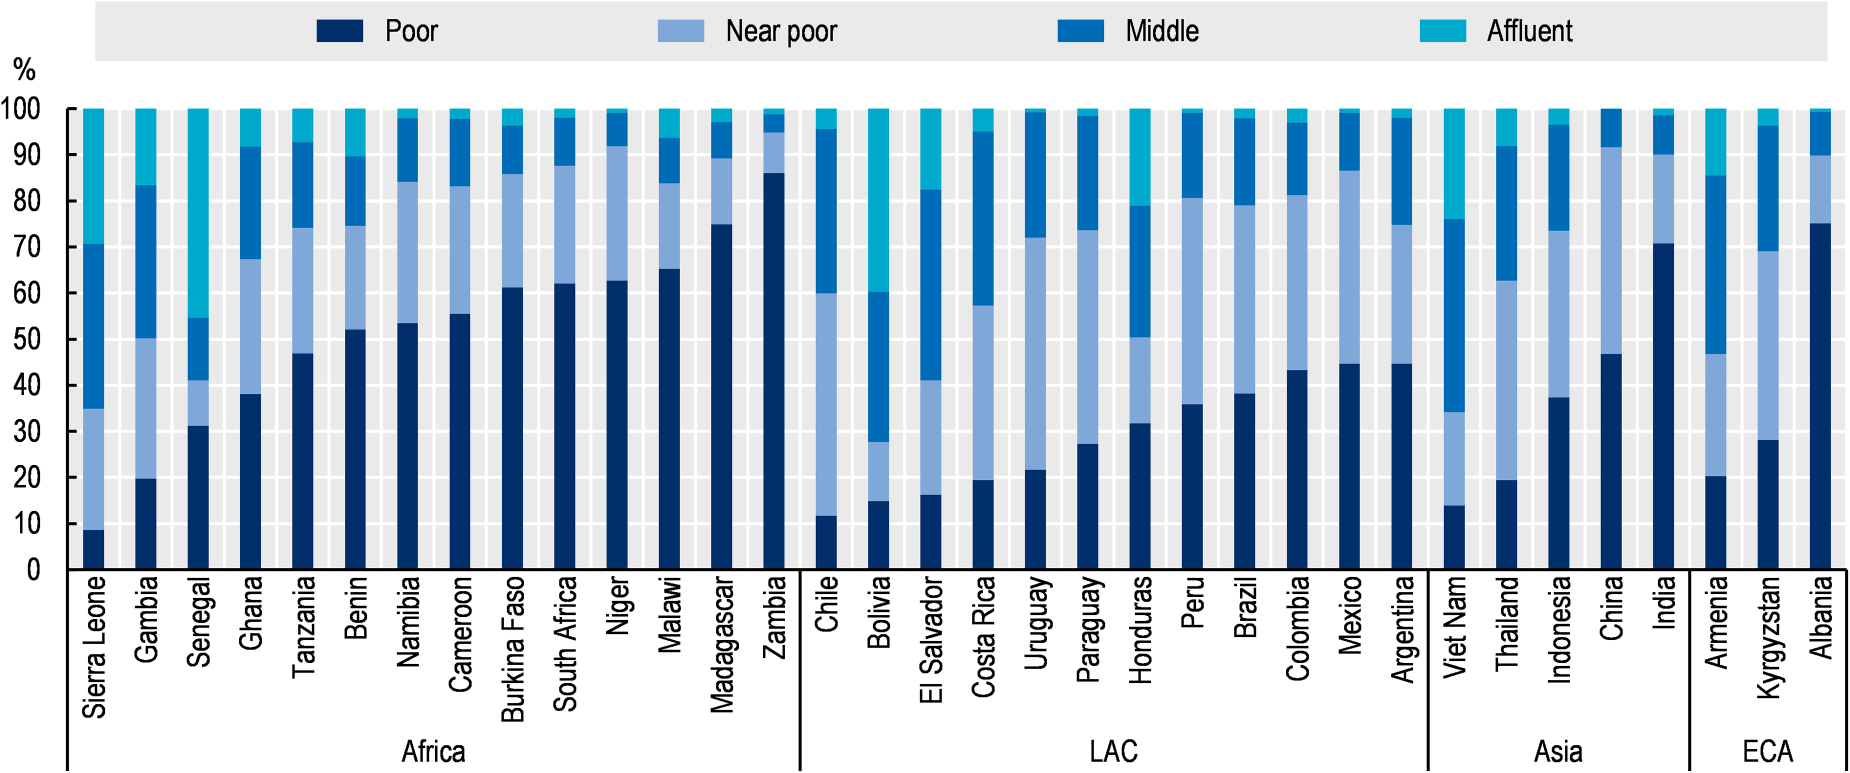
Informal workers are predominately poor, but some are at the richer end of the income distribution. Percentage of informal workers by income class. Note: Economic classes are based on four absolute per capita per day welfare thresholds, which differ by income level: LIC: Poor, Int. USD 2.15/day or less; Near poor, Int. USD 2.15-4/day; Middle, Int. USD 4-8/day; Affluent, Int. USD 8/day or more. LMIC: Poor, Int. USD 3.65/day or less; Near poor: 3.65–7/day; Middle, Int. USD 7–20/day; Affluent, Int. USD 20/day or more. UMIC and HIC: Poor, Int. USD 6.85/day or less; Near poor, Int. USD 6.85–15/day; Middle, Int. USD 15–70/day; Affluent, Int. USD 70/day or more. Source: Authors’ calculations based on KIIbIH (2021).
Yet, while there is a strong consensus for using non-contributory, tax-financed programmes to reduce the social protection gap of the poor, this is not necessarily the case for informal workers with contributory capacity. In designing an approach to increase coverage of non-poor informal economy workers, countries face a host of difficult decisions, including whether to offer universal entitlements or use other coverage mechanisms, such as voluntary or mandatory social insurance; how to develop processes for identification and registration; and how to make existing social insurance schemes attractive to collect voluntary contributions, and whether to subsidise contributory schemes and for whom.
The KIIbIH data show that depending on the country, the extension of contributory schemes would still need to include a significant proportion of the remaining non-poor informal workers. Out of these “non-poor” informal workers, between 27.7% (Sierra Leone) and 94.8% (Zambia) are in the middle or affluent class and could potentially be enrolled in non-subsidised contributory schemes (Figure 1). Yet, 8.8% (Zambia) to 50.4% (Uruguay) of informal workers belong to the near poor category and would most likely need to be supported through subsidized contributory schemes, as their contributory capacity to pay contributions on a regular basis may not be sufficient.
Non-contributory schemes do not require contributions from protected persons but are mostly financed directly from the government budget – that is, from general taxation, other state revenues or in some cases external grants or loans. There are many types of non-contributory programmes, such as universal schemes for all residents (e.g., a national health service), categorical schemes covering certain broad groups of the population (e.g., a social pension or universal child benefit schemes) or means-tested social assistance schemes that provide benefits for groups of the population living in poverty (usually based on a means test, a proxy means test or other targeting mechanism).
Non-contributory schemes play a key role in ensuring a basic level of protection within the social protection system, for poor and vulnerable groups who do not have access to any other mechanisms. For that reason, non-contributory schemes are an essential component of any nationally defined social protection floor.
The role of cash transfers to lift informal workers out of poverty
Cash transfers can play an important role in the fight against poverty among informal workers, although they design often come with a number of challenges in terms of targeting, labour market incentives, and errors of inclusion/exclusion. Based on KIIbIH data, we estimate that to close the poverty gap among informal workers through social assistance, between roughly 0.03% to 4.5% of GDP would need to be spent yearly in addition to current spending on social protection (Figure 2). These numbers are consistent with previous estimations on closing the annual poverty gap. 15
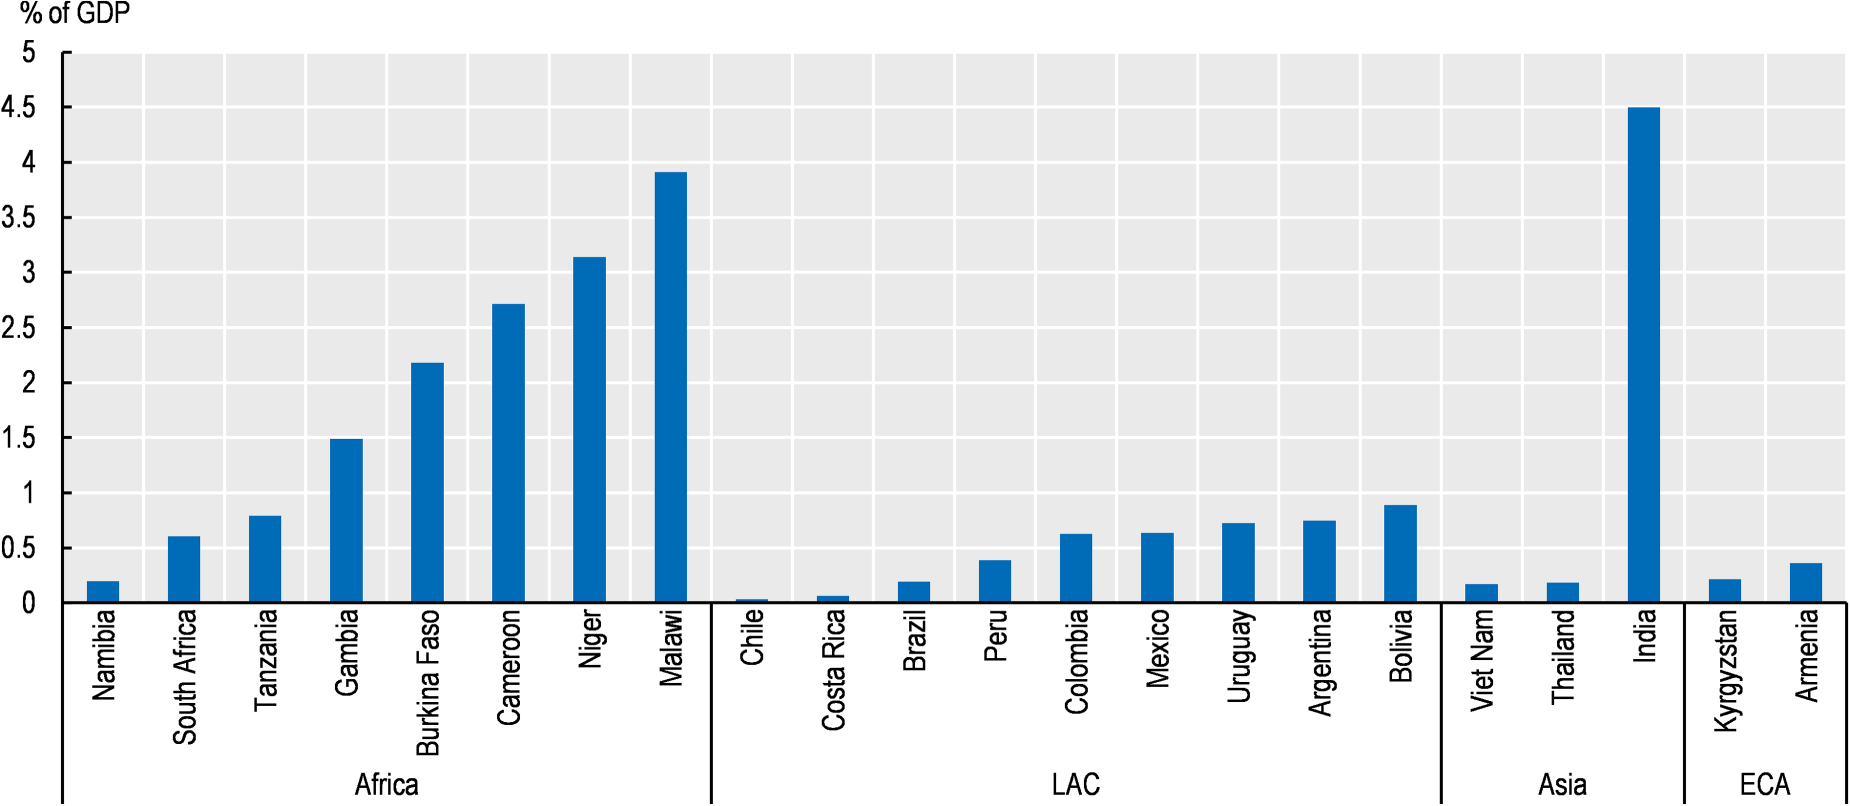
Closing the poverty gap for informal workers is not always exorbitantly expensive. Estimated yearly amount needed to close the poverty gap for informal workers in year of survey. Note: The poverty gap is the ratio by which the mean income of the poor falls below the poverty line. Mean poverty gap is estimated based on international poverty lines and current GDP, corresponding to 2017 PPP conversion rates and country income level, for the year of each country's survey. Source: Authors’ calculations based on World Bank and KIIbIH (2021).
Could the extension of priority benefits such as child benefits and social pension be beneficial for informal workers and their households? To answer this question, it is critical to examine the demographic composition of households of informal workers. This can indeed be an important way to identify the extent to which extending child benefits and social pensions could become an effective way to support the extension of non-contributory schemes to informal workers.
In the KIIbIH, just over half of children (54.6%) and older dependents (57.2%), live in households where all workers are informal (Figure 3). This points to the centrality of child benefits and social pensions as a supplementary mechanism to extend social protection to informal workers and to reduce the vulnerabilities of informal workers’ household. In boosting the provision of benefits to children and older persons, governments have indeed another way to act to reduce the vulnerability of those economically dependant on informal workers.
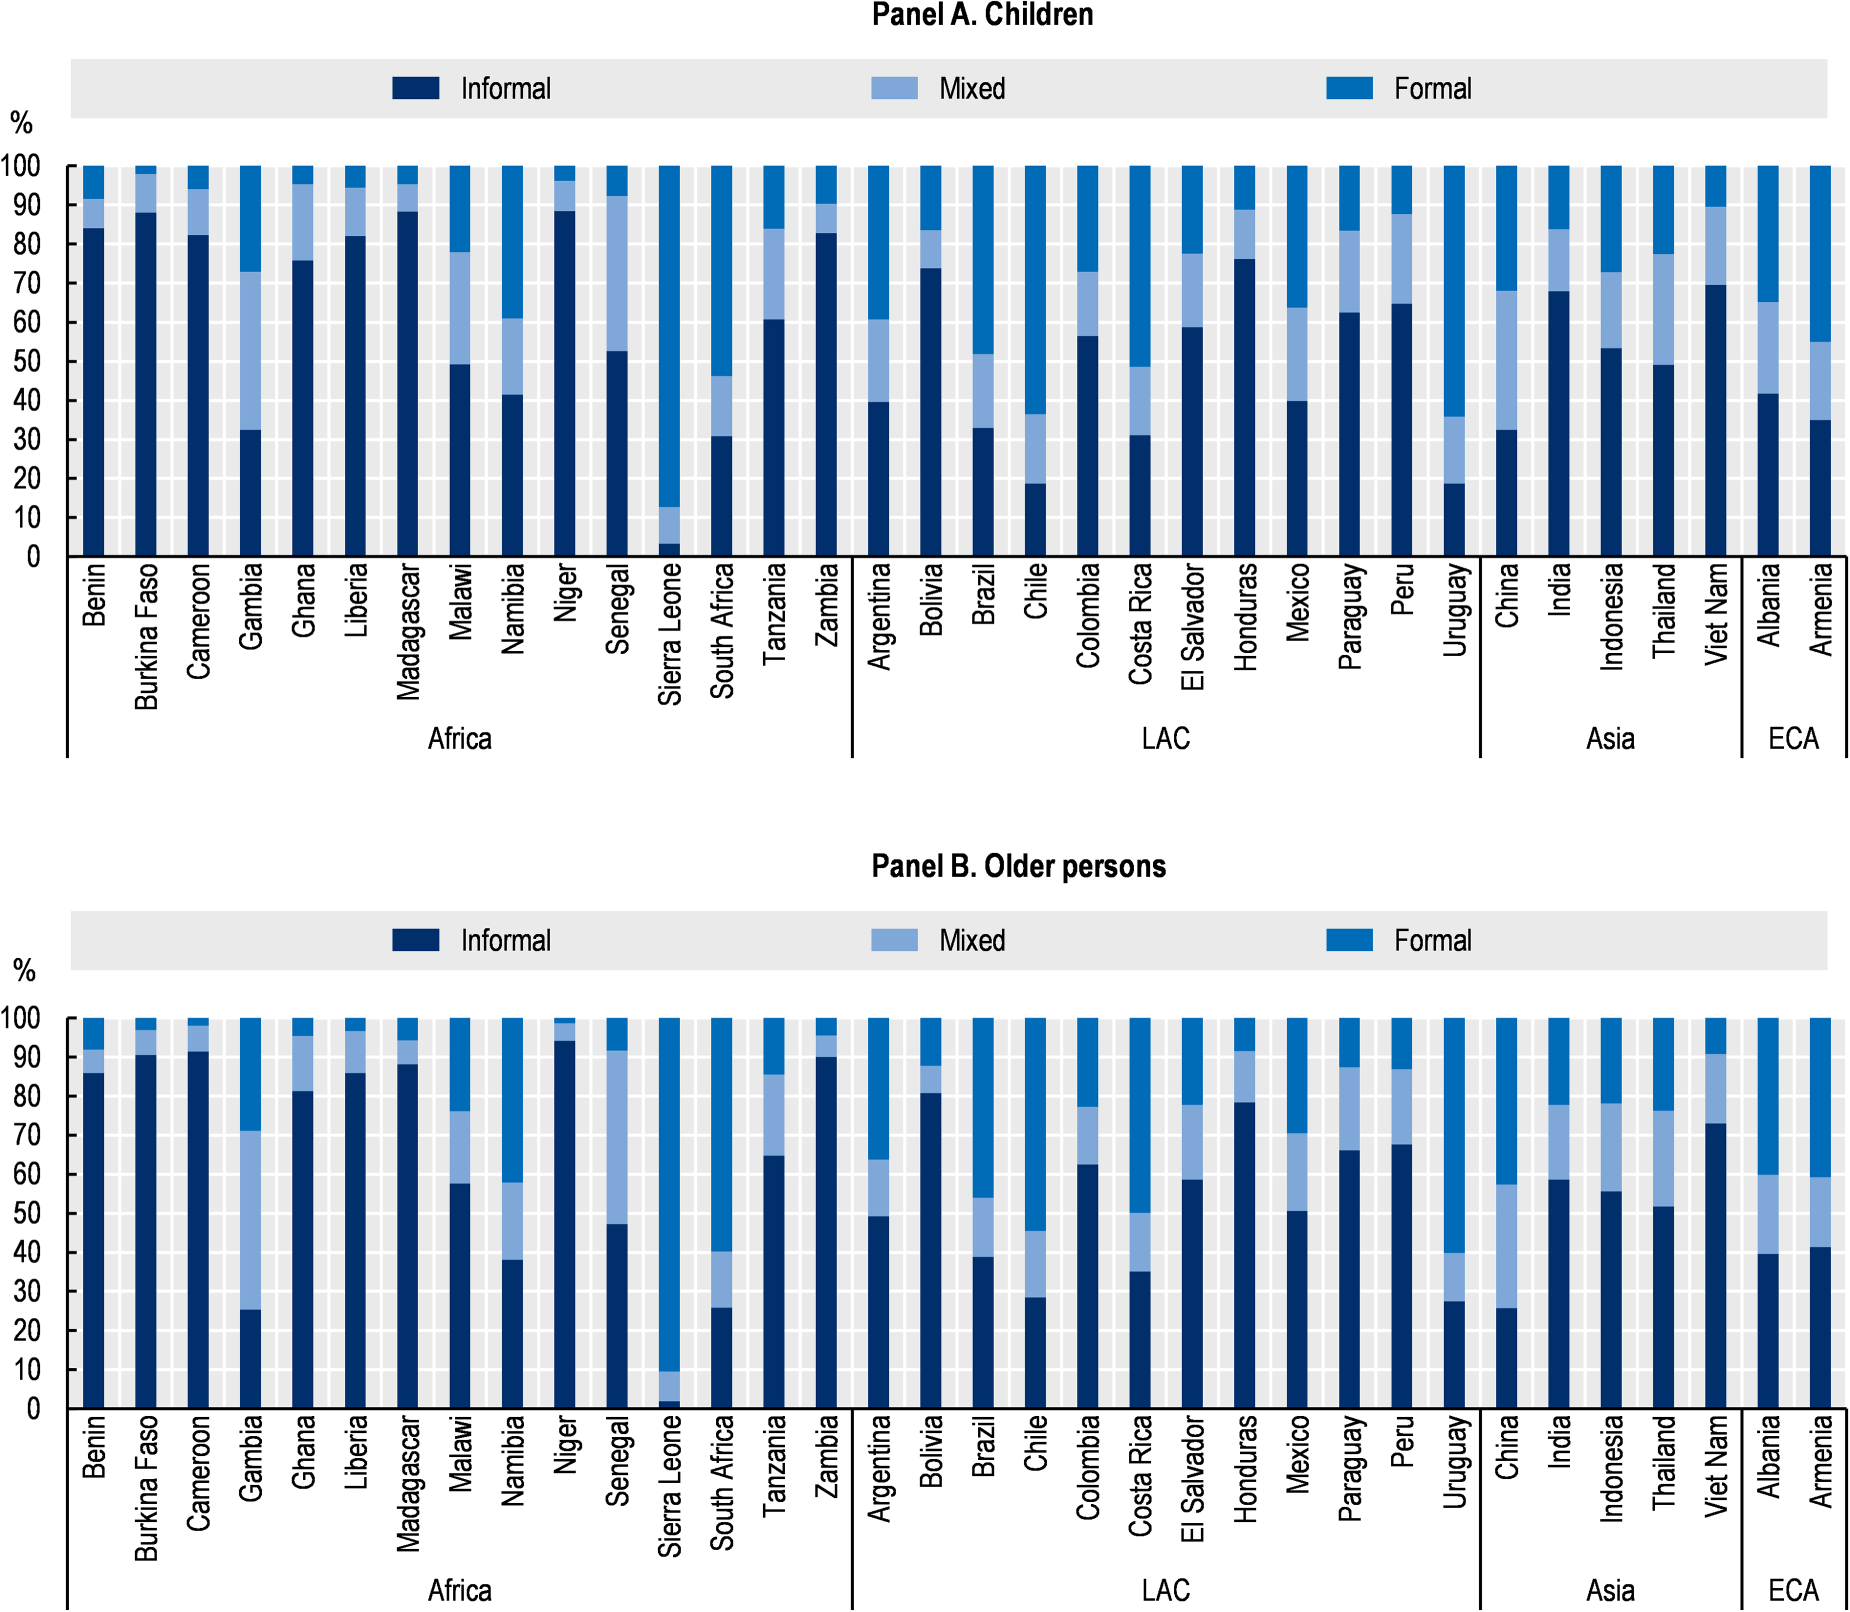
Children and older persons live disproportionately in informal households. Distribution of children (0–15)/older persons (65+) by degree of household informality. Note: Children are household members aged 0–15; older persons are household members aged 65 + . Source: Authors’ calculations based on KIIbIH (2021).
Contributory social protection schemes constitute a key element of the extension of social protection to informal workers. Contributory schemes are based on the payment of contributions by the workers and, in the case of employees, by their employers in the case of employment related contributory schemes, which give rise to entitlements or acquired rights. As such, they play an important role in the financing of social protection systems and can reduce the fiscal pressure on the government budget by offering a reliable and stable financing mechanism. Moreover, the level of protection offered in contributory schemes is usually higher than for many non-contributory schemes.
In most developing countries, the coverage of existing contributory schemes remains limited to formal waged or salaried employment assuming a defined employment relationship based on a written contract and remunerated through regular salaries or wages and with contributions shared between workers and employers. However, several contributory schemes also include other categories of workers, such as employers and own-account workers. A crucial step in the extension of contributory social insurance to the informal economy has been the extension of social and labour rights to domestic workers through a mix of enforcement and simplification measures; inclusion of self-employed workers in social insurance schemes through adapted mechanisms and simplified registration, tax and contribution payment mechanisms; adaptation of contribution calculation and payment modalities to the characteristics of workers and employers; harnessing digital and mobile technology to facilitate access to social protection; and extension of pension coverage through existing or new schemes adapted to the needs of self-employed workers.
As countries look at the ways to extend contributory schemes to informal workers, they need to address several policy choices. One question is whether the extension of contributory schemes can be linked to an identifiable employment relationship between an employer and a dependent worker. Another question is whether informal economy workers can afford to enrol in contributory schemes. There is also the related question about the extent to which the extension of contributory schemes can be best achieved through voluntary or mandatory enrolment, and through labour law enforcement. These are not easy questions to answer, but one critical way to inform the decision-making process is to start looking at the potential role of employer-employee contributions in the informal economy, the contributory capacity of informal workers, and the distance of informal workers vis-à-vis the formal economy.
Finally, in contexts where a significant number of informal workers live with formal workers and where transitions in and out of informal employment may happen, issues related to the extension of social insurance to informal workers through other household members formally employed and of the portability of contributory schemes throughout the life cycle of workers need to be addressed.
The scope for employer-employee contributions
Status in employment is an instructive indicator for examining which actors shall have the responsibility to contribute to social insurance. It is also useful to determine the extent to which both employers and employees could contribute to social insurance. As shown in Figure 4 most informal workers in KIIbIH countries are own account workers (39.0%) and employees (32.5%). This suggests first that for a significant share of the informal worker population, the extension of contributory schemes can be linked to an identifiable employment relationship between an employer and an employee, making co-payments from the side of both employers and employees a priori a possible option. Second, the results show that the development of contributory schemes also need to include programmes that can be attractive to a large segment of informal own account workers with no co-payment possibilities 1 .
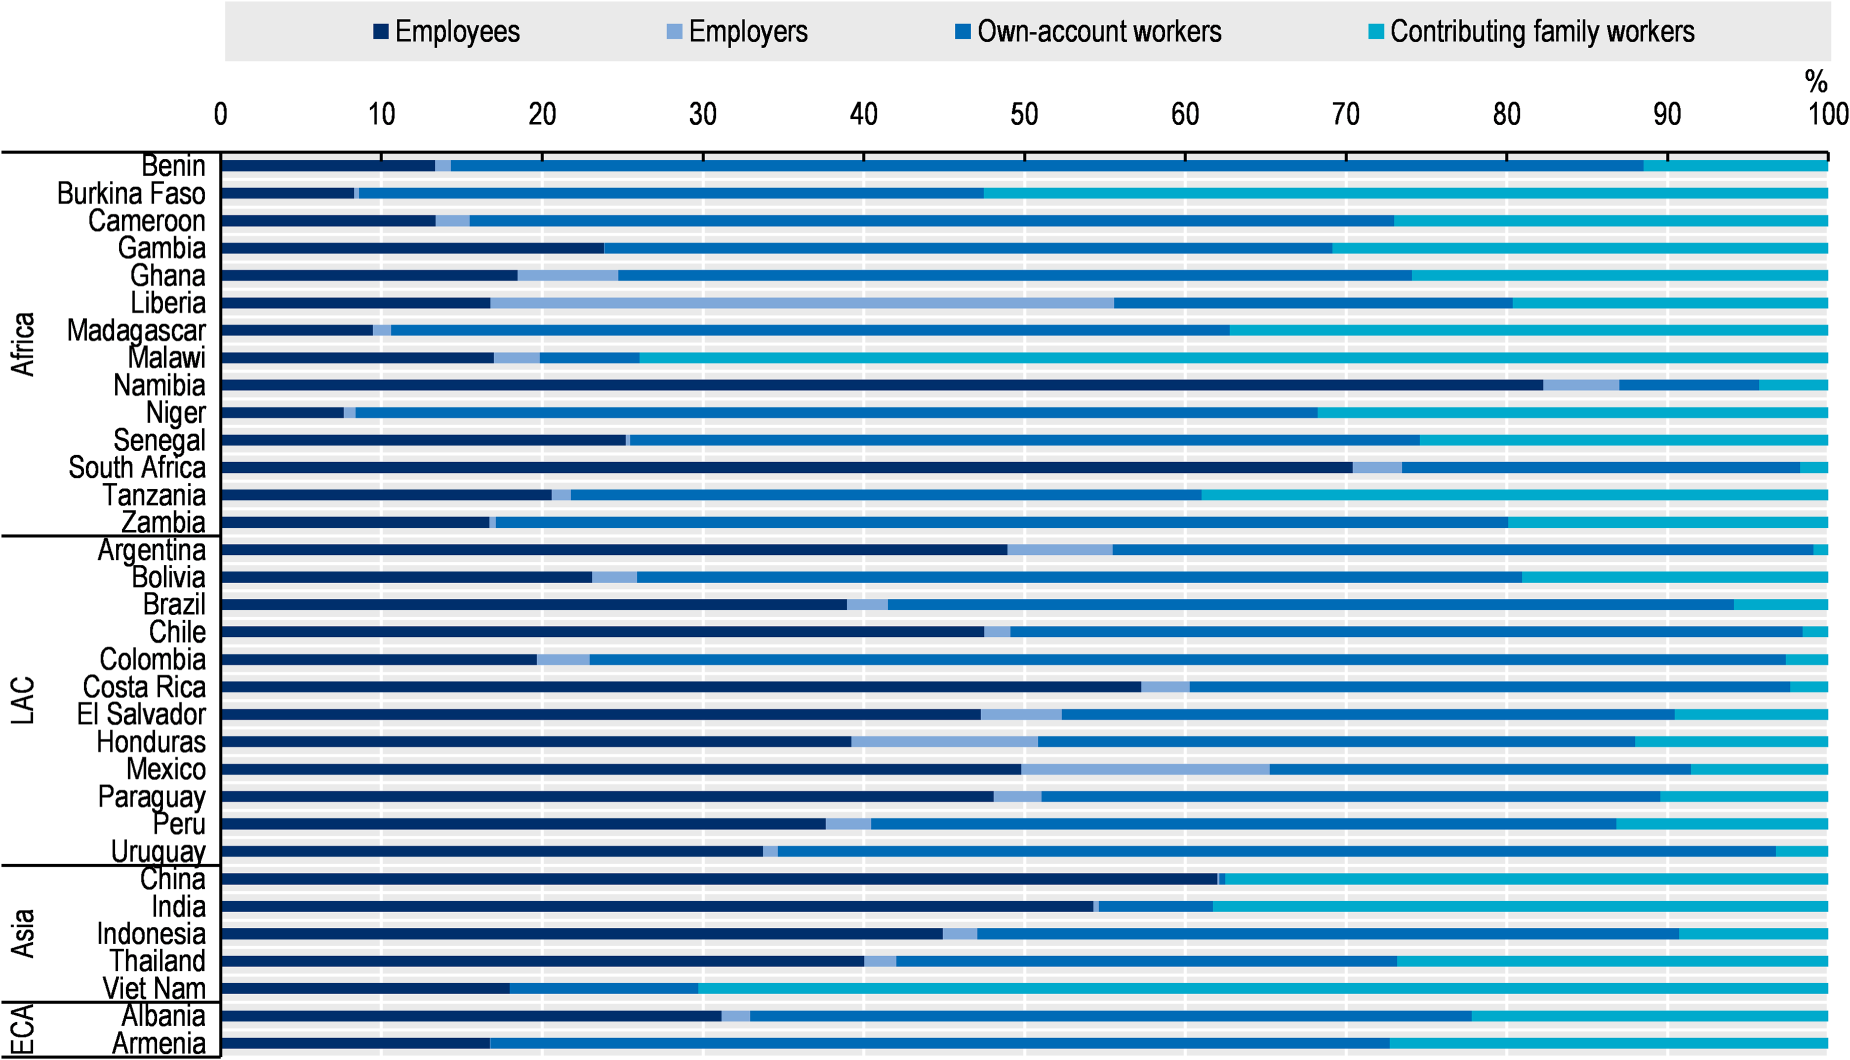
Most informal workers are employees and own account workers. Distribution of workers by status in employment. Note: In Viet Nam, no way to distinguish between employers and own account workers. Source: Authors’ calculations based on KIIbIH (2021).
Recent experiences with the development of social insurance schemes for informal workers show that affordability issues need specific attention in the design of such schemes. Looking at the individual contributory capacity of informal workers as well as that of their household is therefore critical. Figure 5 presents the earnings categories of informal workers to investigate the individual contributory capacity of informal workers. It reveals that a large number of informal workers are low-paid workers 2 , – about 53.7% on average among our sample of countries. For such workers the contributory capacity will be limited, and contributory schemes would probably need to be subsidised and/or complemented with employers contribution when possible. Yet, the data also reveal that a non-negligible proportion of informal workers – between 17.6% to 61.4% depending on the country – are medium or high paid workers and may have some capacity to contribute to social insurance schemes.
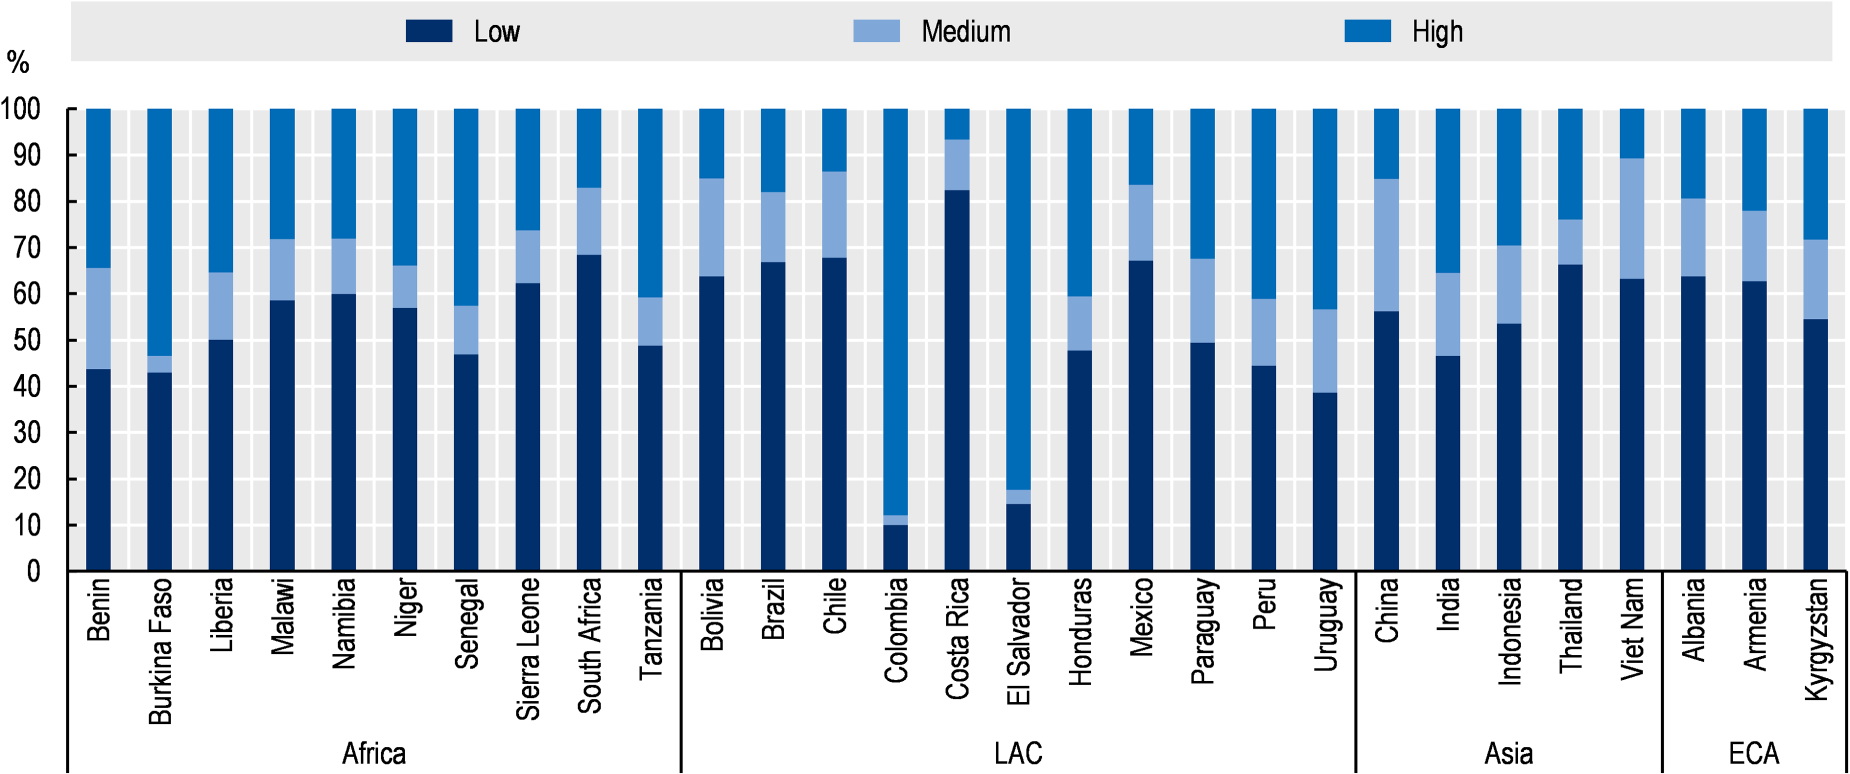
Many informal workers are low earners. Percentage of informal workers by earnings category. Note: Earnings categories are relatively defined based on the total earnings distribution: low earnings are from the bottom of the distribution to 50% of the median earnings level; medium earnings are from 50% of the median to 150% of the median; high earnings are 150% of the median and above. Source: Authors’ calculations based on KIIbIH (2021).
The affordability of existing schemes for informal workers will also vary depending on their status in employment, which may influence the regularity and predictability of earnings. Looking at the earnings categories of informal workers by status in employment, we see that informal employers are most likely to be part of the top end of the overall earnings distribution. Contributing family workers are most likely to be at the bottom end in all regions. Informal employees and own account workers tend to be located towards the middle, with regional differences: in ECA and Asia, a greater proportion of informal employees tend to be low paid. Additionally, being that certain social insurance programmes tend to base contributions on earnings, this indicator could be useful for gauging capacity to contribute towards insurance schemes like pensions.
Remittances may also influence the contributory capacity of informal workers at the household level, while providing an innovative source of financing for voluntary contributory schemes. 16 Considering that remittances act as an informal insurance,17,18 the very receipt of remittances may be a sign that recipient households have a demand for social protection. Among relatively well-off recipient households, moreover, this demand may be financially solvent and channelled towards formal contributory schemes. In the case of Colombia, for instance, recent evidence shows that remittances are an important source of income that increases enrolment in contributory social insurance schemes among informal workers. 19 Moreover, remittance receipt can be considered to provide useful information on capacity to contribute to other social insurance schemes, such as health insurance.
An important question, therefore, is to what extent and under which conditions informal workers that receive remittances and that do not qualify for social assistance may be willing and able to channel some of their resources to enrol in formal social insurance schemes. According to the KIIbIH data, around 10.5% of informal workers live in a household that received remittances and that is food secure (Figure 6). This suggests that a mutually beneficial solution to the exclusion of informal workers from contributory schemes and the financing of the extension of national social insurance schemes for these workers, may lie in the development of informality-robust social insurance schemes targeting middle class informal economy workers that receive remittances.
Informal workers that receive remittances have some capacity to pay for social protection. Percentage of informal workers living in households that receive remittances and which are food secure. Note: Capacity to pay is estimated based on household food security (share of household consumption or expenses on food are less than 50%) and non-poor status (based on national lines). Source: Authors’ calculations based on KIIbIH (2021).
Labour law enforcement, understood here as the state possibility to make firms and workers that fall under the labour law to comply with labour regulations, is often considered as one important pathway for the extension of social protection to informal workers and formalisation. Yet, how much hope shall policy makers place on the extension of social protection through enforcement largely depends on a combination of factors, including the depth of the legal social security coverage of different categories of workers but also the extent to which informal workers have some contributory capacity; how close they are to the formal economy; and the level of institutional capacity.
Enforcement measures may be more effective in expanding contributory coverage in countries with greater institutional capacity and legal social security coverage of workers in different employment status, and if they target informal workers with contributory capacity and informal workers in the formal sector (mostly employees as per the definition of informal employment in the formal sector). As discussed above, evidence from the KIIbIH indicates that the contributory capacity of informal workers tends to vary across countries. We estimate that in our sample of countries, from 3.5% to 82.3% of informal workers may have some individual contributory capacity (Figure 5), while others may have some contributory capacity at the household level as they live in affluent households and in households that receive remittances. Other KIBIH estimates further suggest that in many countries, the share of informal economy workers who work in the formal sector and may be not so far from the formal economy is important. On average across countries, about 43.5% of informal employees work in the formal sector; the remaining 56.5% work in the informal sector (Figure 7).
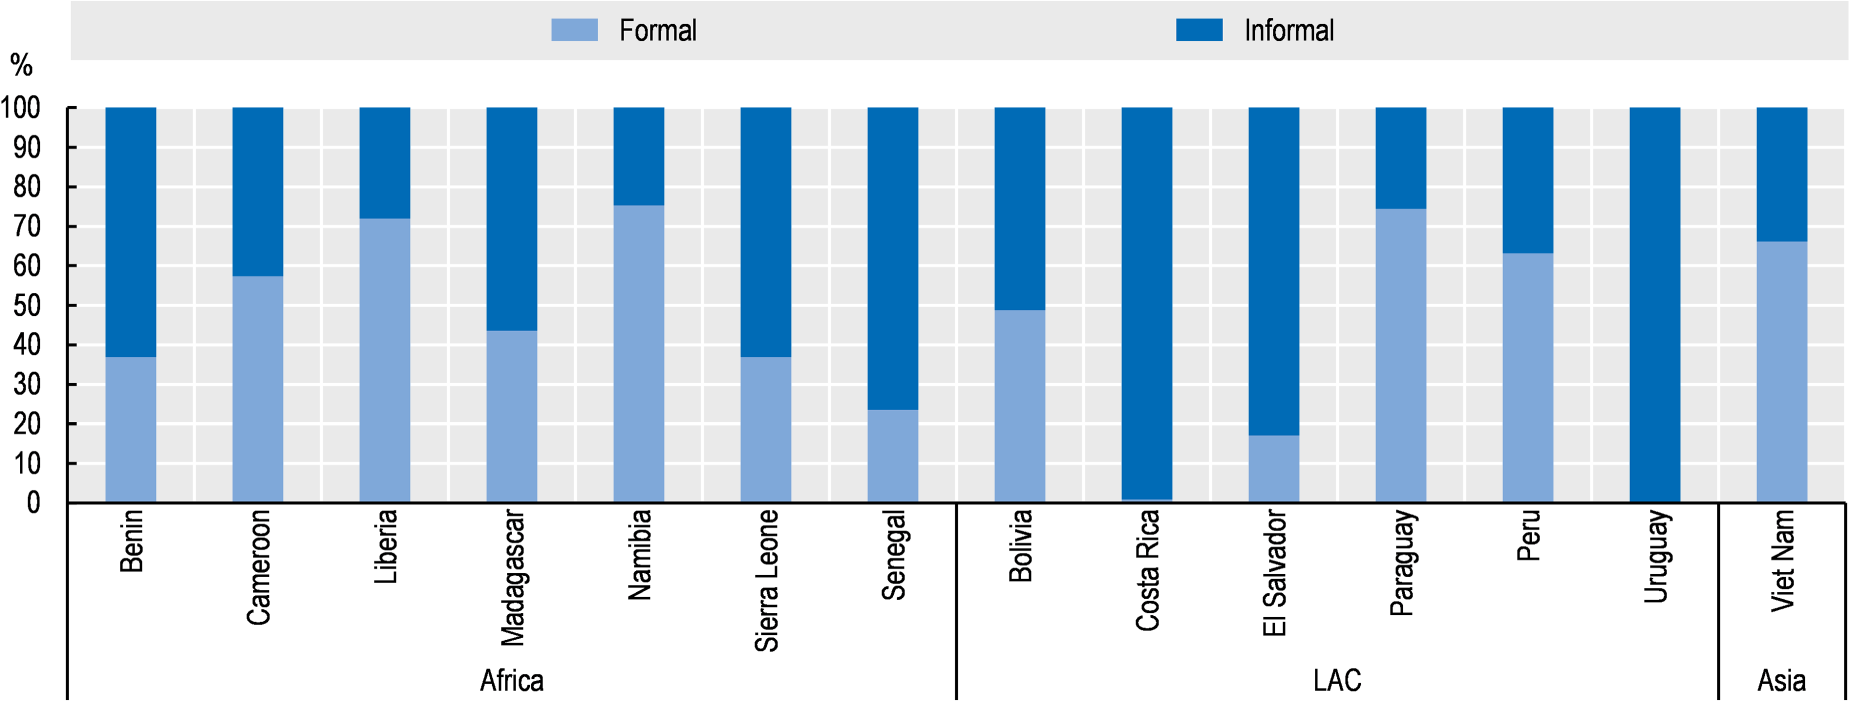
Informal employees can be found in both the informal and formal sector. Distribution of employees who are informal. Source: Authors’ calculations based on KIIbIH (2021).
In principle, a small share of informal workers could benefit indirectly from the social protection coverage provided by formally working household members. About one-fourth of informal workers live in households with other formal workers (about 24.9%, Figure 8) and could a priori be covered indirectly by certain social protection schemes that they would not otherwise have access to (such as health insurance and old-age pensions). In Latin America, for example, certain programmes like survivor pensions are paid for through contributions from the formal workers’ salary but can benefit any informal workers that were part of the household unit once the formal worker has passed away.
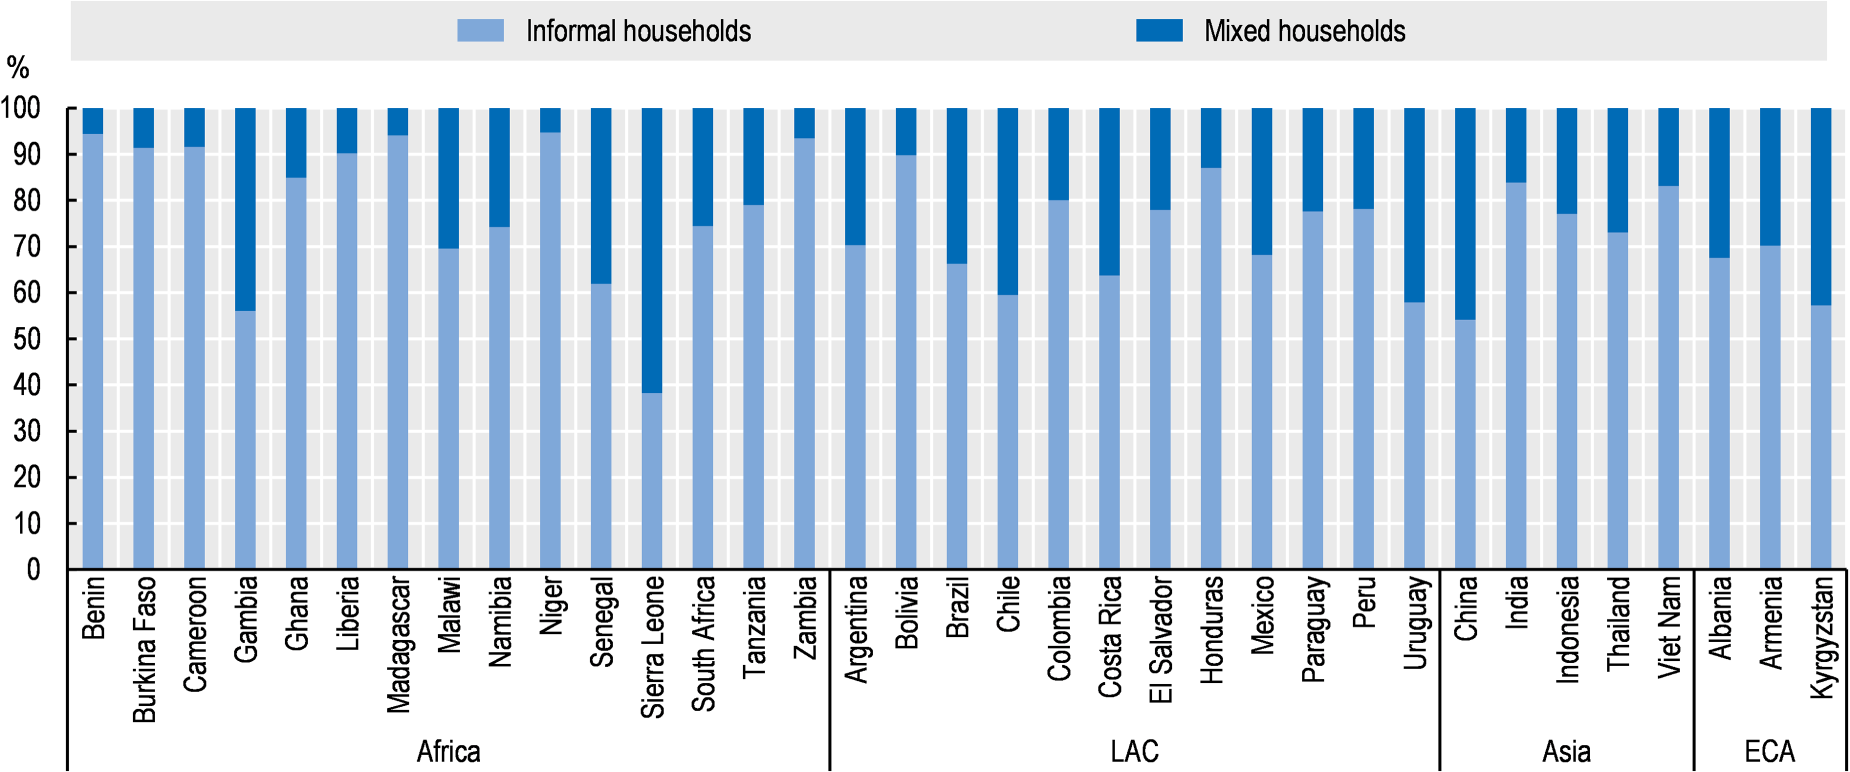
Informal workers are most likely to live with others who work in the informal economy, less so with formal workers. Distribution of informal workers by degree of household informality. Source: Authors’ calculations based on KIIbIH (2021).
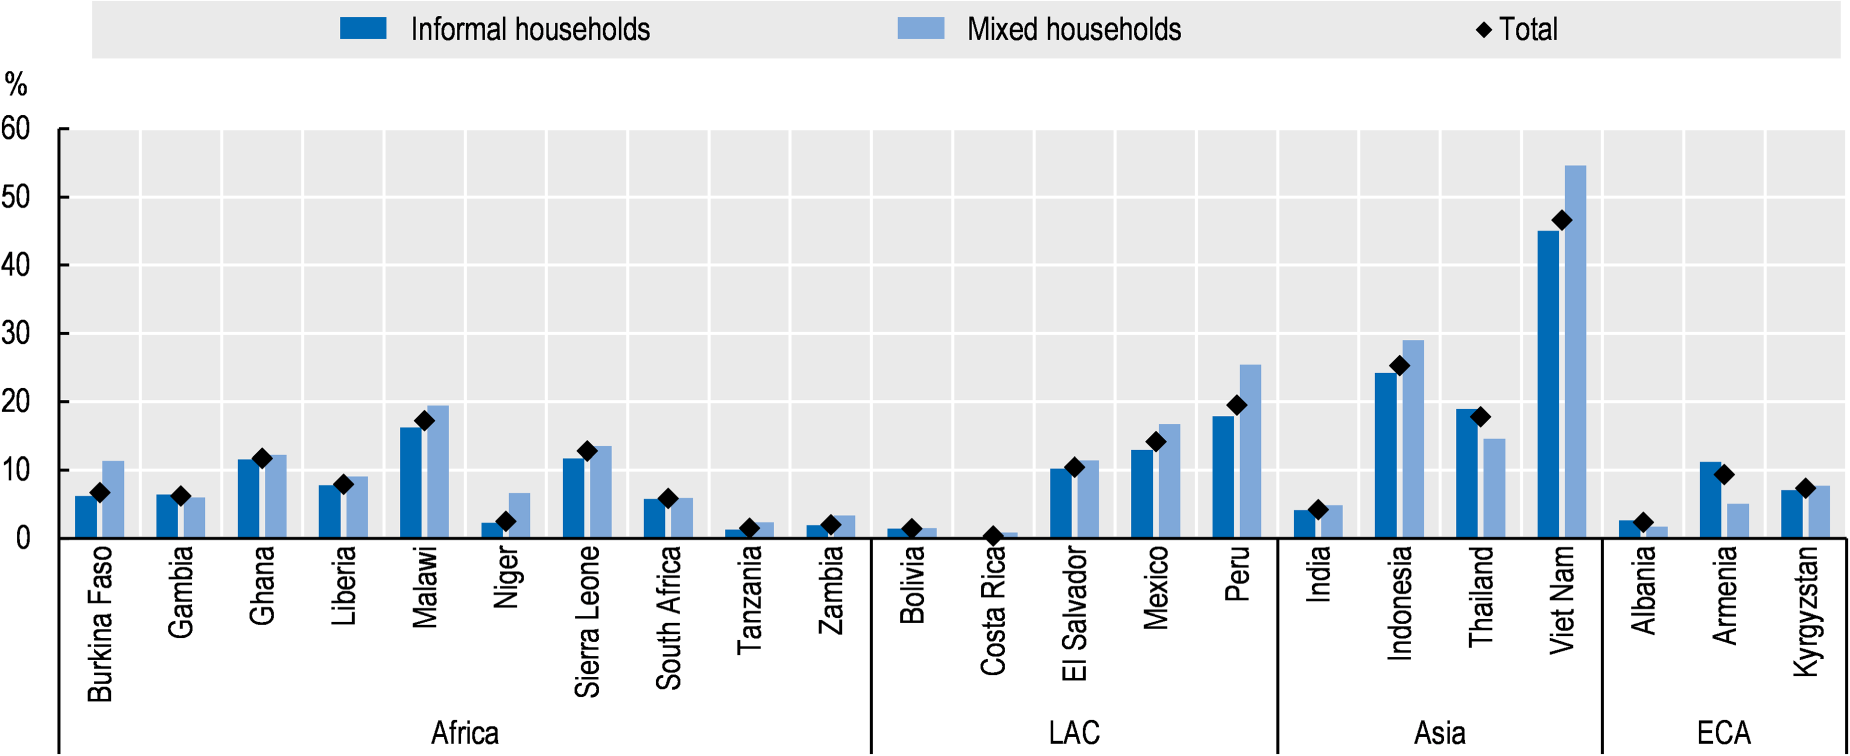
In the KIBIIH dataset, indirect access to social insurance through other formally working household members can be seen for example in health insurance coverage for informal workers. In a few countries, employment-based health insurance allows for formal workers to add household members to their insurance plans, effectively covering them where they might not be entitled to any other insurance (Figure 9). According to KIIbIH data, health insurance coverage of informal workers in mixed households is higher than coverage of informal workers in informal households across many countries: for example, in Argentina, 59.2% of informal workers in mixed households benefitted from some form of employment-based health insurance coverage as opposed to 35% of informal workers in informal households. Likewise for Namibia (8.2% in informal and 10.1% in mixed), Indonesia (2.6% in informal and 7% in mixed) and Kyrgyzstan (33.2% in informal and 44.3% in mixed).
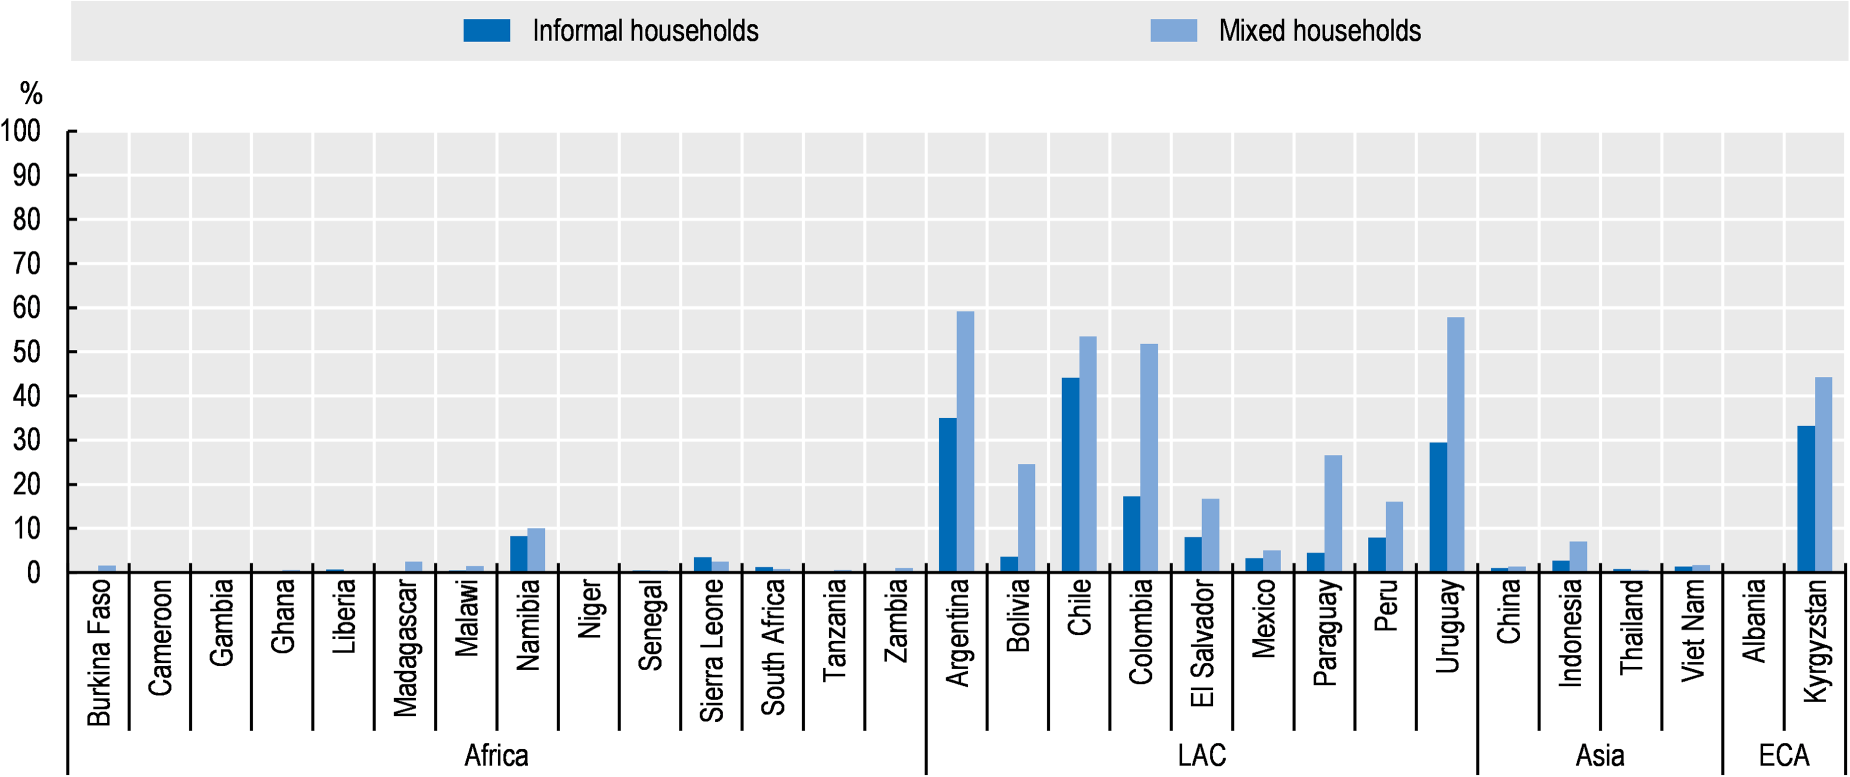
Social protection to formal workers can benefit informal workers in shared households. Percentage of informal workers covered by employment-based health insurance. Source: Authors’ calculations based on KIIbIH (2021).
This paper has sought to describe the compilation of the OECD Key Indicators of Informality based on Individuals and their Household (KIIbIH) database and to illustrate how the KIIbIH can be used for social policy monitoring. The KIIbIH dataset builds upon household surveys to provide comparable indicators and harmonised data on the socio-economic characteristics of informal workers in 50 countries across North and sub-Saharan Africa, Eastern Europe and Central Asia, Asia and the Pacific, and Latin America and the Caribbean. Whereas other publicly available harmonised statistics on informality largely draw upon labour force surveys to estimate the size of informal employment, the KIIbIH uses household surveys to provide more information on the socio-demographic and economic status of workers and their household.
Overall, the database provides useful information for policy makers when developing their formalisation strategy and designing policies to tackle the vulnerability of informal workers considering their household context. As countries look at the different ways to extend social protection to informal economy workers, the KIIbIH allows to portray informal workers within their household context. Monitoring household-level characteristics is essential to provide answers to a range of information needed to develop an effective social protection extension strategy and to tackle vulnerability among groups exposed to informality.
Relevant policy questions that the KIIbIIH allow to address include: How many informal workers belong to poor households and could be a priori covered if poverty targeted programmes were extended to all eligible households? Are child benefits and social pensions effective tools to protect informal workers? How many informal workers live in a household with formal workers and could be potentially covered through them? What is the contributory capacity of informal workers? What is the role of labour law enforcement? What is the scope for employee-employer contributions?
Footnotes
Acknowledgements
The authors would like to thank Mariya Aleksynska (OECD), Justina La (OECD), Ji-Yeun Rim (OECD) Florence Bonnet (ILO), for the support and the valuable guidance in the development of the OECD Key Indicators of Informality based on Individuals and their Household (KIIbIH) database. The overall project was graciously financed by the Swedish International Development Agency (Sida).
The authors would like to acknowledge the insightful comments of colleagues who contributed to improving the quality of the paper: Juan de Laiglesia (OECD), Sebastian Nieto Parra (OECD), Juan Vazquez Zamora (OECD), and all the anonymous reviewers of Statistical Journal of the IAOS for their valuable comments.
Funding
The authors received no financial support for the research, authorship, and/or publication of this article.
Declaration of conflicting interests
The authors declared no potential conflicts of interest with respect to the research, authorship, and/or publication of this article.