
Abstract
Aerobic Training (AT) and Resistance Training (RT) are the two common exercise modalities for weight managing and physical health. AT comprises rhythmic, continuous movement that improves cardiovascular endurance and calorie expenditure, whereas RT focuses on muscle strengthening through measured exercises with weights. There is a need for clear comparison research to guide tailored exercise programs for optimal health results. The research aims to compare the influences of RT and AT on weight reduction and body composition in adult individuals. The research proposed the Adaptive Decision Tree (ADT) to identify patterns in participant response and predict fat loss trends. A total of 40 adults aged 20–40 years, with fluctuating fitness backgrounds, were randomly allocated into two equal groups: one engaged in structured AT, and the other in RT-based routines. The intervention was ten weeks long. Participants charted a supervised protocol scheduled at 5 days/week for 30 min at a moderate intensity of AT exercise for the AT group and a full-body RT (3 days/week) routine with progressive overload targeting major muscle groups for the RT group. Pre- and post-intervention data were composed on lean mass, waist-to-hip ratio, body weight, and body fat percentage. Paired and independent t-tests, descriptive statistics, and Pearson correlation coefficient (PCC) were employed to assess within- and between-group differences. The statistical analysis was executed using SPSS v26, with a significance threshold of p < 0.05.
Results
demonstrated that both groups presented decreased body fat mass and body weight, with the AT group indicating a superior average weight loss (−4.3 ± 1.2 kg) and the RT group showing a greater gain in lean body mass (+1.9 ± 0.8 kg). The ADT model achieved a higher R-squared value of 0.962084, lower RMSE and MAE, indicating strong predictive accuracy for fat loss trends. Overall, the research demonstrated that AT encourages better weight loss than RT training, but RT training affects positive changes in body composition. The shared insights support tailored program design based on individual health goals.
Keywords
Introduction
Body composition is a significant indicator of health, particularly older adult health. More muscle mass is often related with lower risks of physical disability and mortality. More fat within the muscles and a wider waist circumference tends to be connected with greater levels of frailty and death. 1 As obesity and metabolic disorders have become more common, it has encouraged the need for successful exercise-based interventions directing weight loss and improvement of body composition. The exercise modes often related with reducing obesity include Aerobic Training (AT) and Resistance Training (RT). AT exercise is viewed as helpful in reducing body fat and improving cardiorespiratory efficacy, while RT pays to additional lean body mass and enlarged metabolic rate.2,3 In fact, moderate-intensity AT exercise plays a key role in the weight management and diminishes body fat percentage, resulting in a more healthful body composition. 4 RT also delivers additional metabolic health improvements, especially for overweight individuals, by way of increased resting energy expenditure (REE) and insulin sensitivity. RT, as a form of exercise modality, can also enlarge physical strength and functional mobility. 5 Moreover, both AT and RT training can promote a physiological response to exercise but also advance enjoyment and adherence for individuals, which is a vital feature of an individual's long-term outcome with exercise. 6 It is vital to understand how AT and RT exercise affect muscle mass as this should inform the development of exercise guidelines. 7 While both exercise modalities can affect body composition, individual differences in answering to both exercise modalities vary significantly due to differences in genetics, nutrition and adherence. Furthermore, the ideal balance and intensity for optimal weight loss and muscle hypertrophy have not been recognized. To address this issue, the research is intended to observe treatment between the RT and AT on weight loss and the intervention on body composition in individuals. The research proposed the Adaptive Decision Tree (ADT) to identify patterns in participant response and predict fat loss trends.
The organization of the research contains the following subsections: Section 1 discusses the introduction of the research and the related work is discussed in Section 2. The materials and methods utilized for the research are represented in Section 3. The outcome of the research was evaluated and discussed in Section 4. The research's conclusion is presented in Section 5.
Related works
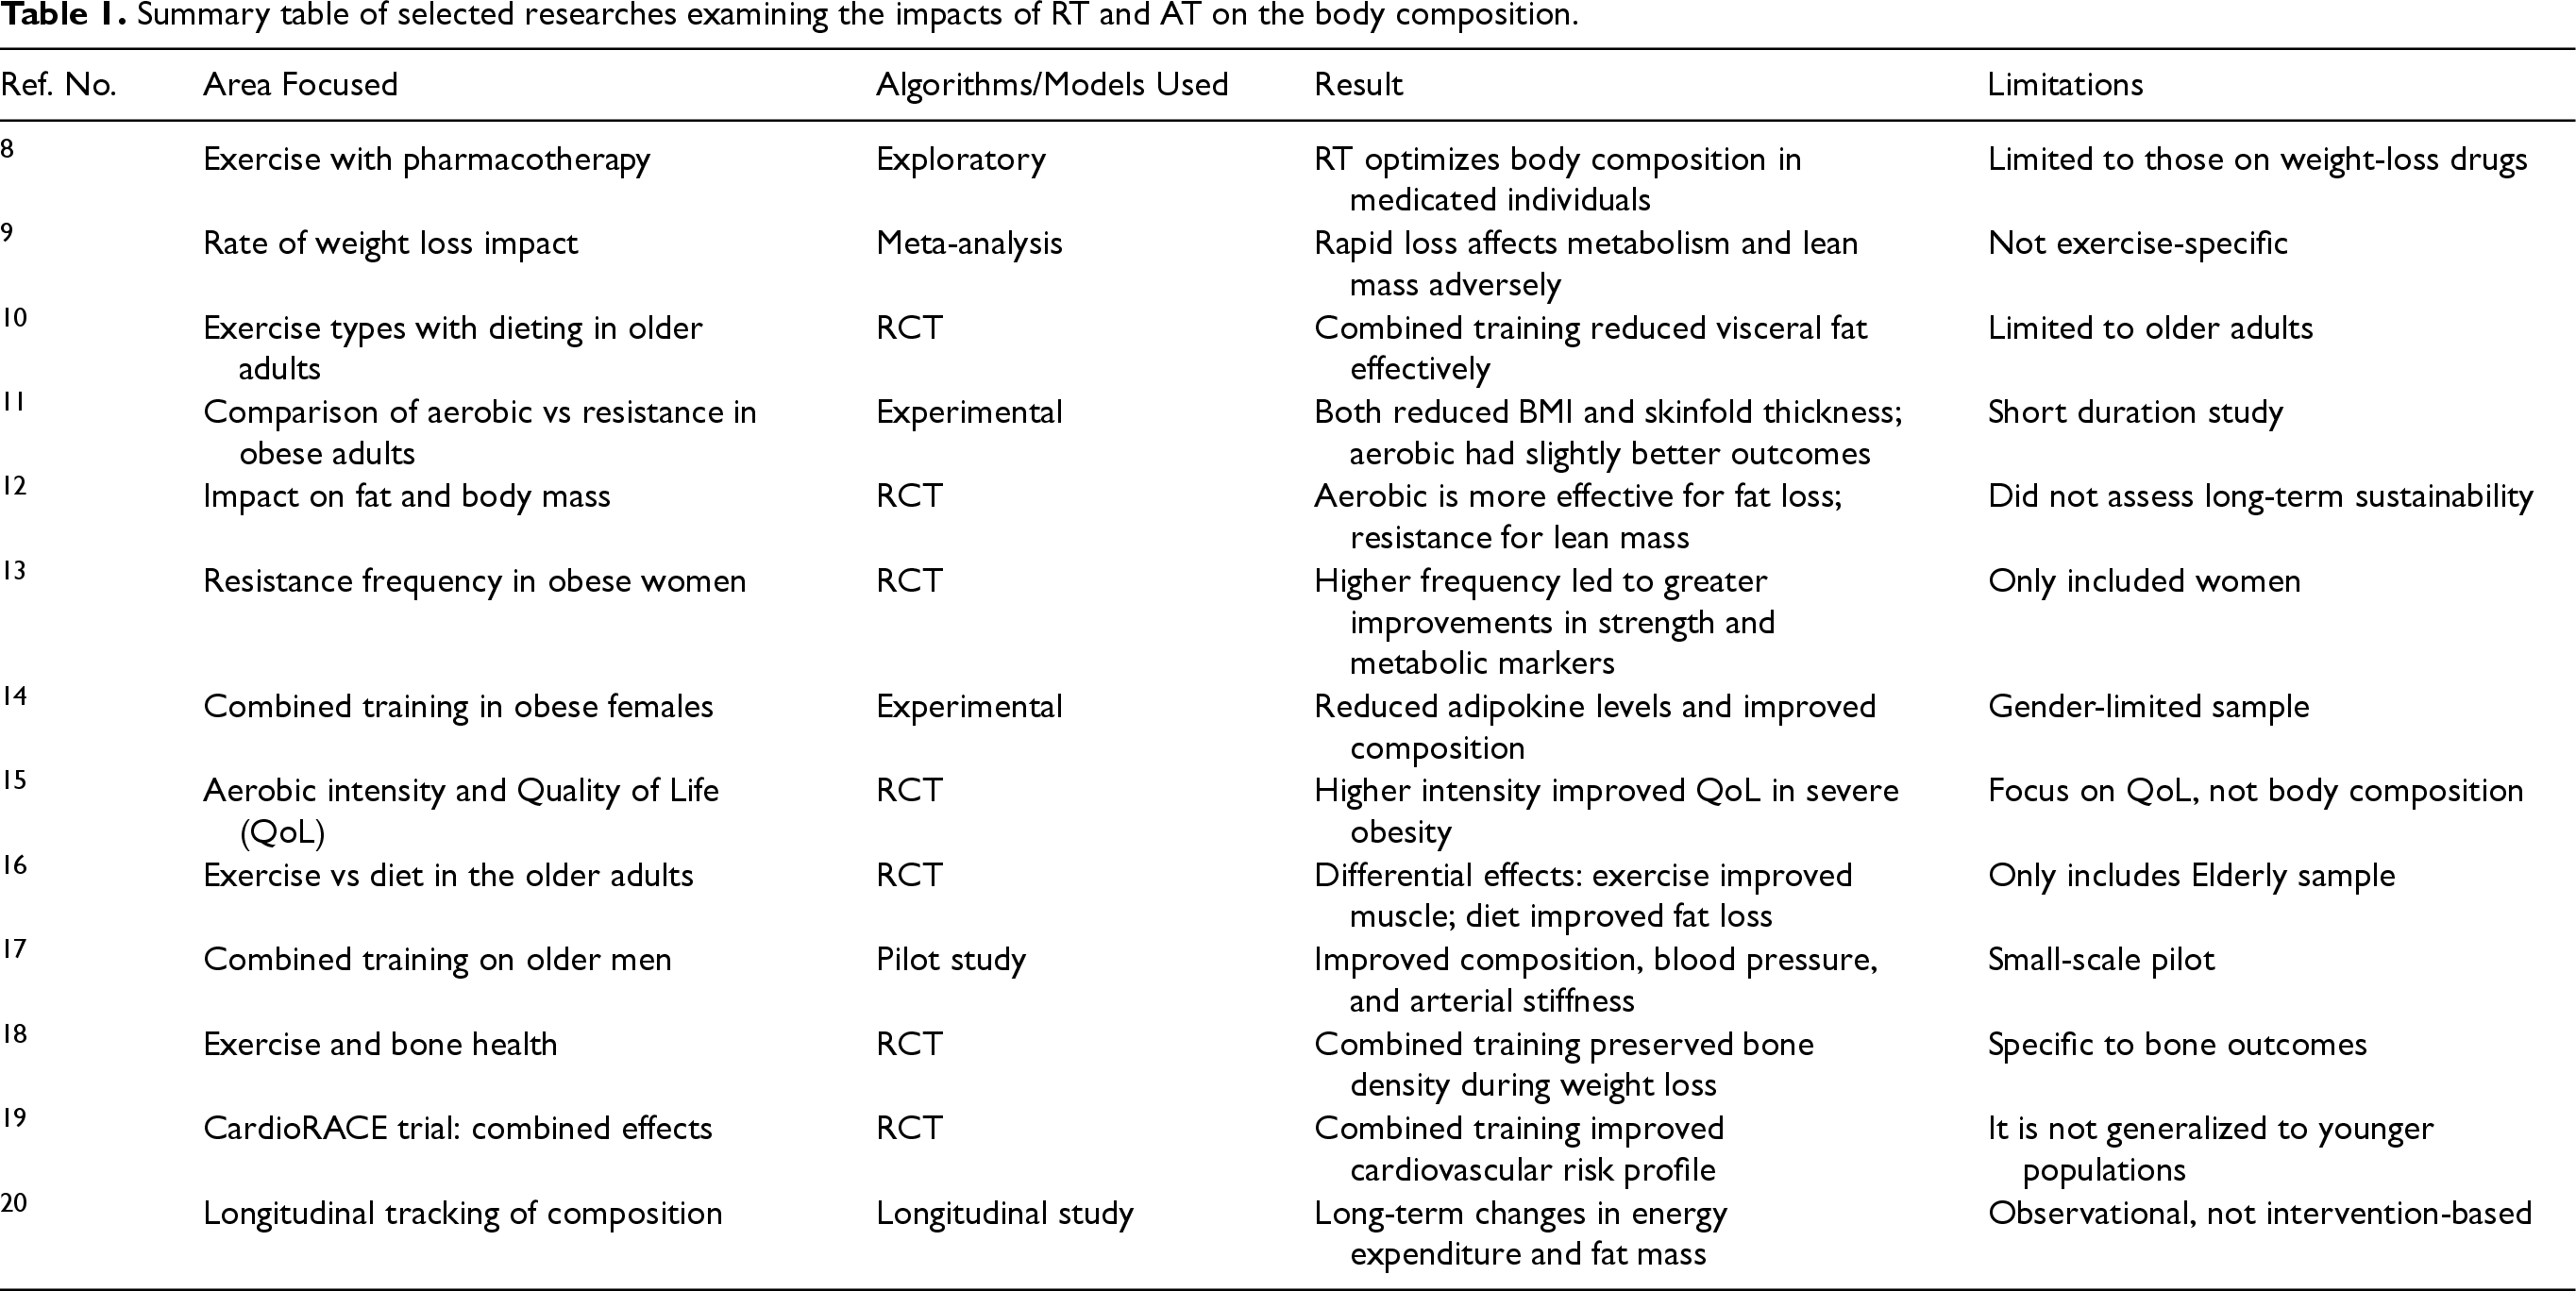
Table 1 summarizes significant research that investigated the impacts of AT, RT, and incorporated training on the body composition and related health outcomes. It highlights each research's specific target areas, techniques, key findings, and observed limitations.
Summary table of selected researches examining the impacts of RT and AT on the body composition.
Material and methods
This section describes the research's design, participants’ selection criteria, and sample demographics. It also describes the intervention protocols for both AT and RT groups, followed by a discussion of the research methodology. Finally, the statistical methods utilized to evaluate the data are described. The research proposed the ADT to identify patterns in participant response and predict fat loss trends.
Research design and participants
A total of 40 healthy adults aged 20–40 with various fitness levels were recruited. Participants must have been in the recommended weight (BMI > 25 kg/m²) and without comorbidity or other medical conditions that could hinder exercise participation. Individuals prescribed weight-loss medications or already engaged in regular exercise were excluded. Following the screening process, participants were randomized into two groups such as AT and RT, within the Randomized Control Trail (RCT) research design to look at the impacts of the AT and RT on the body composition and the weight loss in adults. Each participant was randomly allocated to one of two intervention groups. The two interventions were roughly ten weeks in duration. Pre-intervention and post-intervention data were collected and analyzed in order to find significant differences between and among the groups.
Intervention protocol
The research had two separate intervention groups, such as AT group (n = 20) and the RT group (n = 20), as shown in Figure 1.
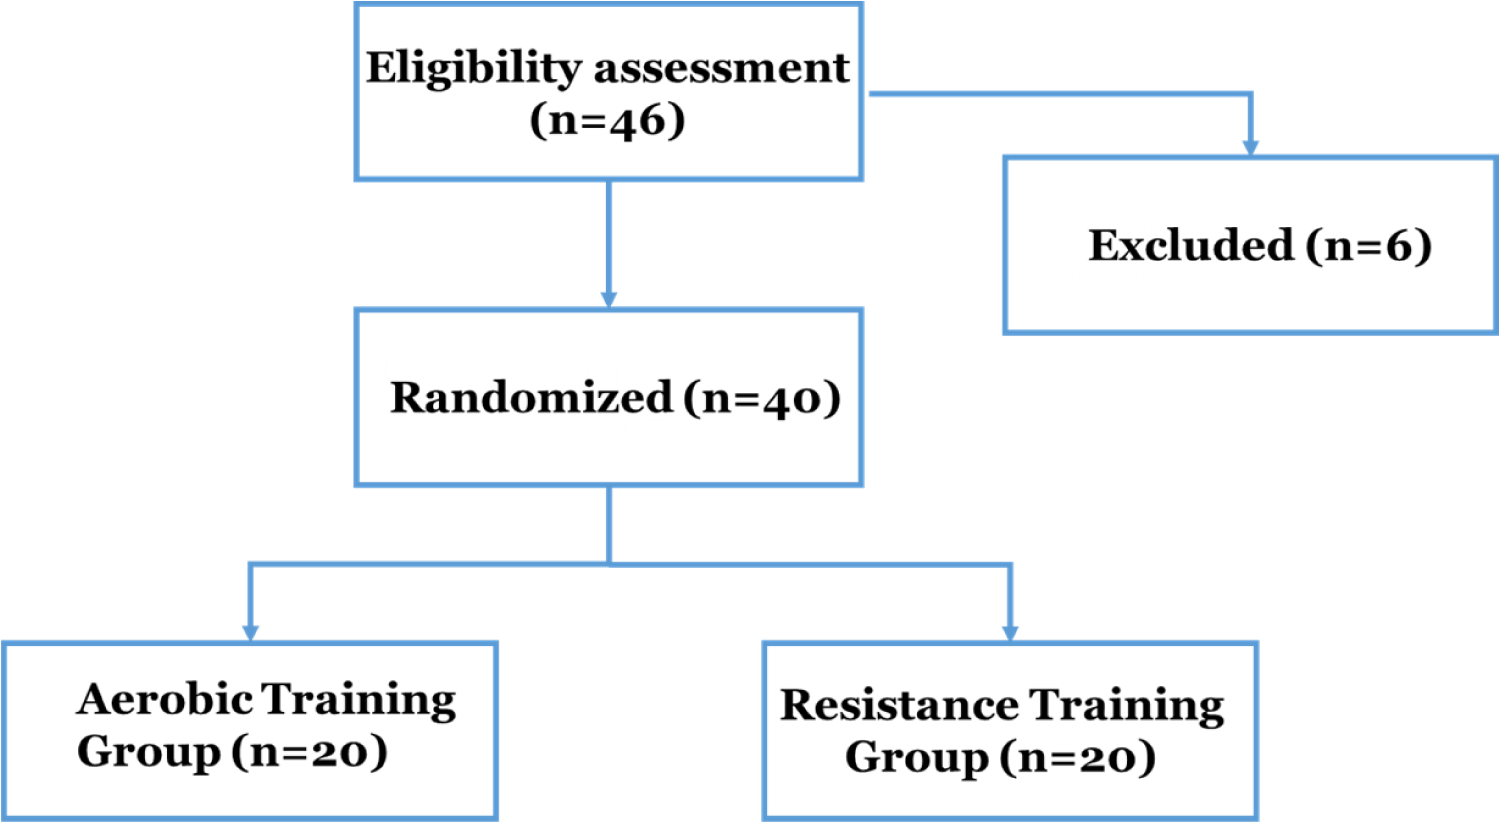
Participant recruitment and randomization process for the AT and RT interventions.
Aerobic training (AT) group
Participants in this group completed a planned moderate (30- 70% (and in some instances, 70–85% max HR)) cardiovascular exercise protocol for 30 min per session, and for a duration of five days per week. Exercise modalities included treadmill walking, stationary cycling, and elliptical exercise. The intensity of the exercise was measured using the target heart rate zone (60–75% max HR) and adjusted each week as required to promote progressive overload.
Resistance training (RT) group
This group engaged in a full-body RT program for three non-consecutive days each week. Exercises including free weights and equipment targeted the major muscle groups.
Statistical analysis
The statistical analysis was performed using the SPSS version 26. The methodology used for statistical analysis included independent t-tests and paired t-tests, along with descriptive statistics, and the Pearson correlation coefficient (PCC) analysis. The paired t-tests evaluated significant increases for each unit of human subjects as a group, while independent t-tests tested the difference between groups. Descriptive statistics were provided as an overview of the baseline body parameters of participants and, and post -intervention body parameters which showed clear and representative trends. The PCC analysis showed both the direction and strength of relationships between the health and fitness variables of interest, and it also conveyed some important interdependencies. The p-value established statistical significance was
Identification of the patterns in participant response and prediction of fat loss trends using the Adaptive Decision Tree (ADT) model
The research proposed the ADT to identify patterns in participant response and predict fat loss trends. This section investigates the use of ADT modeling to determine individual variability in response to aerobic and resistance training interventions. By assessing important body composition metrics, the ADT model identify participant outcomes and anticipate fat loss patterns. Its adaptive nature improves precision, making it an important tool in individualized health and fitness studies.
Decision tree (DT)
A DT is a supervised machine learning method that divides data into branches based on decision rules generated from input attributes, resulting in prediction results. It is admired for its simplicity, interpretability, and ability to handle both numerical and category data, making it suitable for identifying participant replies in health research. However, traditional DTs often exhibit disadvantages such as overfitting, sensitivity to noisy data, and a lack of generalization on small or imbalanced datasets. To address these limitations, the research proposed an ADT model with dynamically adjusted structure and feature selection criteria, which improves prediction accuracy and robustness in predicting fat loss trends among individuals.
Adaptive decision trees (ADT)
ADT is an improved version of traditional DTs which dynamically modify their structure and decision rules based on the complexity and qualities of the incoming data. It identifies participant responses and reliably predicts fat loss outcomes based on training style and body composition. It optimizes splitting criteria, depth, and pruning thresholds during training to increase predictive accuracy and avoid overfitting. This is especially critical when working with restricted or heterogeneous data, such as participant responses in health research. At each decision node, the ADT uses information gain to choose the most informative property for splitting. The dataset's entropy is first estimated using Equation (1).
Where n is the number of classes in dataset Y and 
Where 
Where
Result and discussion
The research aims to compare the influences of RT and AT on weight reduction and body composition in adult individuals. This section discusses the results of the research pertaining to paired t-tests, PCC, independent t-tests and descriptive statistics analysis. It explains the impacts of training on the body composition, and the significant correlations amongst the highlighted health and fitness variables. The research proposed the ADT to identify patterns in participant response and predict fat loss trends. Table 2 displays the comparison about key demographic and behaviours characteristics between the AT and RT Groups. Figure 2 provides a graphical description of the demographic and behavioural characteristics of the AT group with the RT group participants.
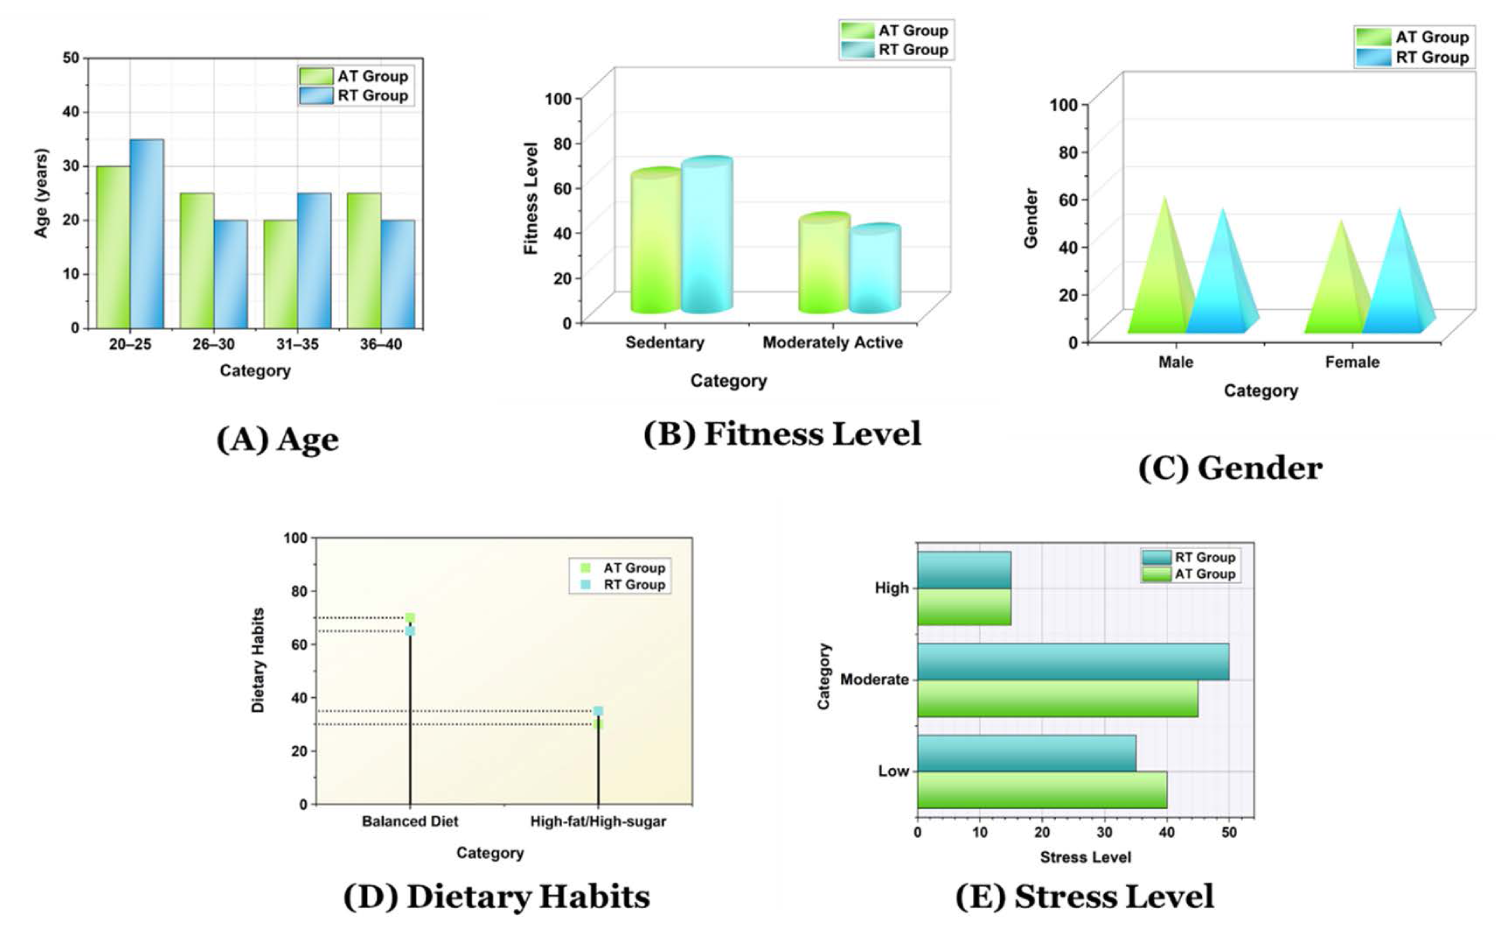
Graphical summary of demographic and behavioral characteristics of AT group with RT group participants.
Comparison of key demographic and behavioural attributes between AT and RT groups.
Among the 40 adults, the age group 20–25 was the most represented with 13 individuals (32.5%), followed equally by the 26–30, 31–35, and 36–40 age ranges (each contributing 22.5%). The sample as a whole was composed of 47.5% girls and 52.5% males. The cohort's BMI is
Evaluation of baseline and post-training body metrics using the descriptive statistics analysis
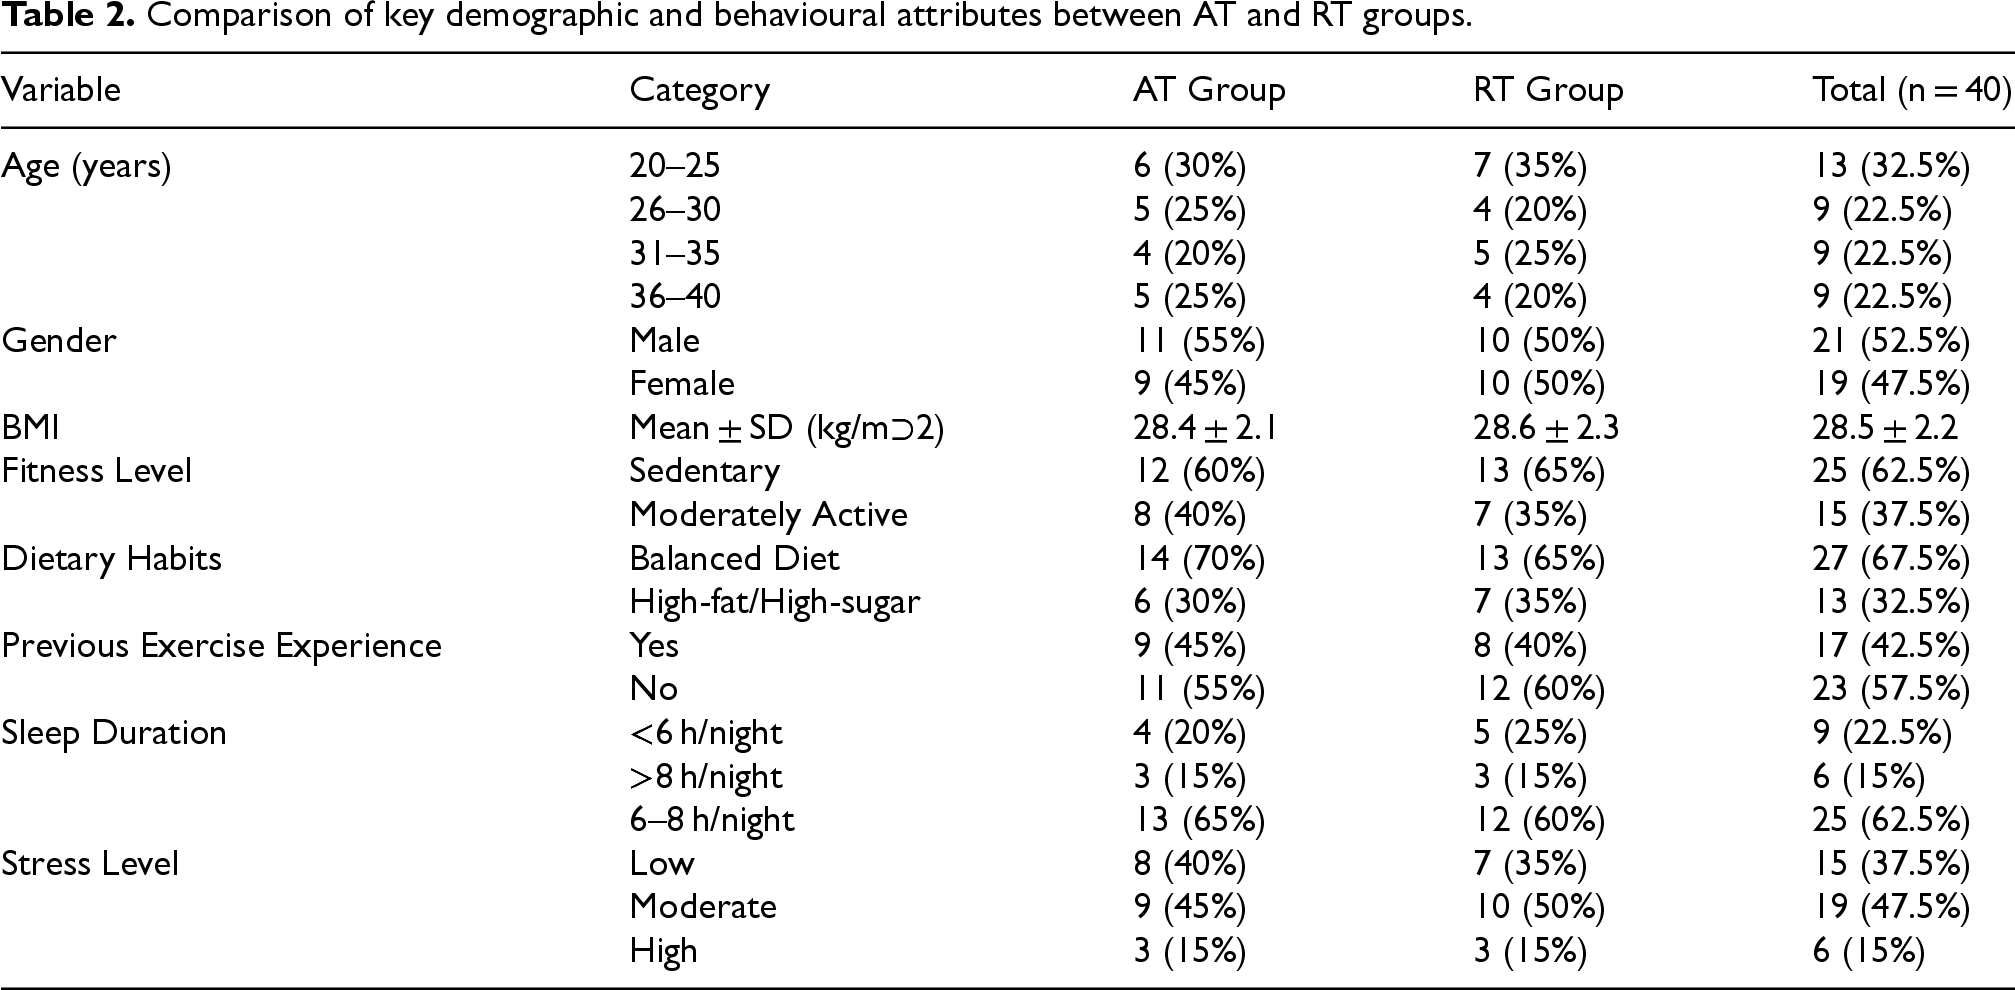
Descriptive statistics provide an overview of the simple features of the dataset, including means, standard deviations, and frequencies. It describes the participants’ baseline characteristics and body composition data before and after the interventions. Table 3 provides descriptive data for the body composition measurements in AT and RT groups.
Descriptive statistics of the body composition measures in RT and AT groups.
The AT and RT groups’ participants were 28.0 ± 5.4 years and 27.5 ± 5.1 years old, respectively. The body weight was comparable between groups (AT: 85.2 ± 10.5 kg; RT: 84.8 ± 11.0 kg). Both groups exhibited identical BMIs (28.4 ± 2.1 kg/m² for AT, 28.6 ± 2.3 kg/m² for RT) and waist-to-hip ratios (0.89 ± 0.06 vs. 0.90 ± 0.07). The average percentage of body fat was 30.1 ± 4.3% (AT) and 29.8 ± 4.0% (RT), with mean values of lean body mass of 55.8 ± 6.2 kg (AT) and 56.1 ± 5.8 kg (RT).
Assessment of pre- and post-intervention effects using paired t-test
The paired t-test examines the means of the two related groups, such as pre- and post-intervention measurements for the same person. The research uses this technique to determine whether each training group experienced significant changes in weight and body composition during the intervention period. Table 4 depicts the pre-intervention and post-intervention mean differences and statistical significance assessed by paired t-test.
Pre- intervention and post-intervention effects evaluation using paired t-test.
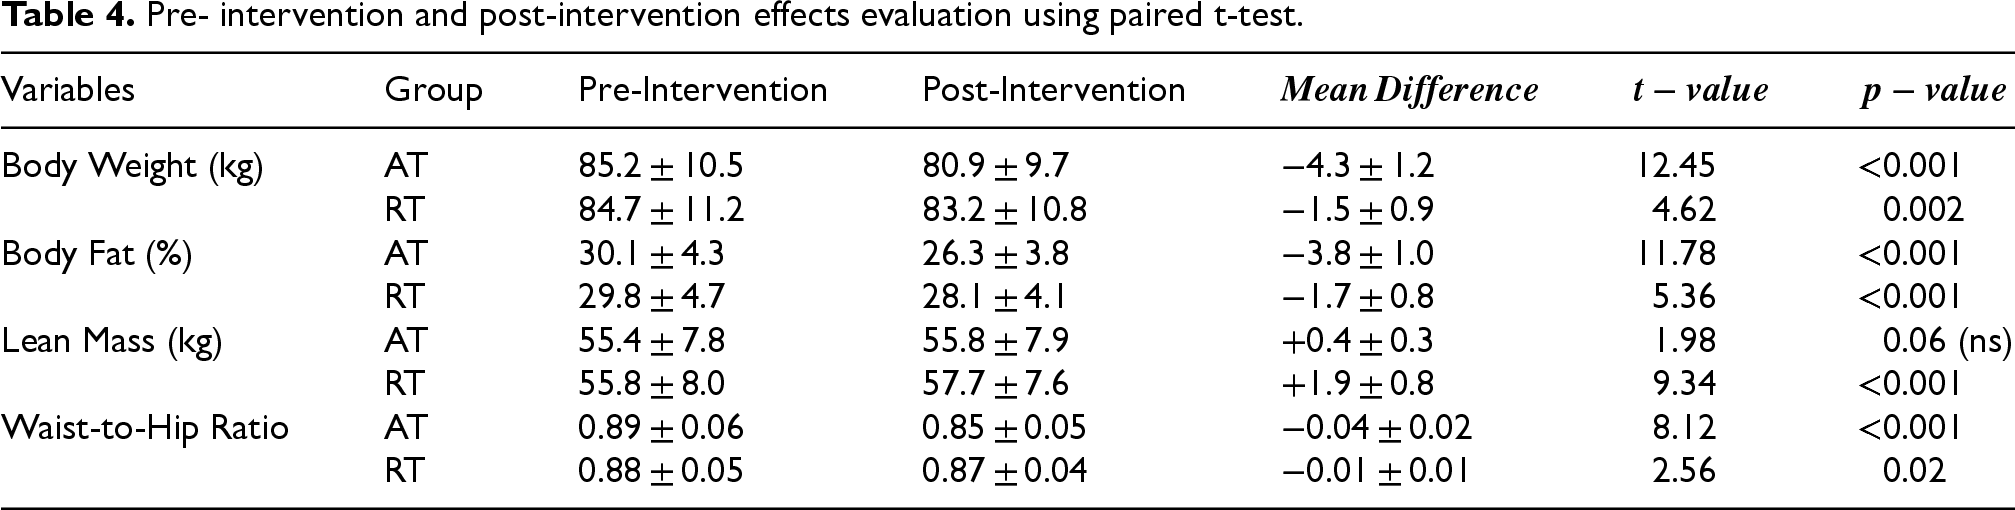
The AT group decreased its weight by −4.3 ± 1.2 kg
Between-Group comparisons of body composition changes using independent t-test analysis
Independent t-tests evaluate mean differences between groups to determine statistical significance. It examines how changes in the body composition differ significantly between the RT and AT groups. This helps to determine which training modality has the greatest impact. Body composition changes are represented with directional values to reflect actual outcomes: negative values for weight, body fat and the waist-to-hip ratio indicate a mean decrease (e.g., −4.3 kg denotes a 4.3 kg weight loss), while positive values for lean mass indicate a mean increase (e.g., + 1.9 kg). Table 5 depicts the summary of independent sample t-test results evaluating differential impacts of the AT with RT on body composition.
Summary of independent t-test results evaluating differential impacts of RT with AT on the body composition.
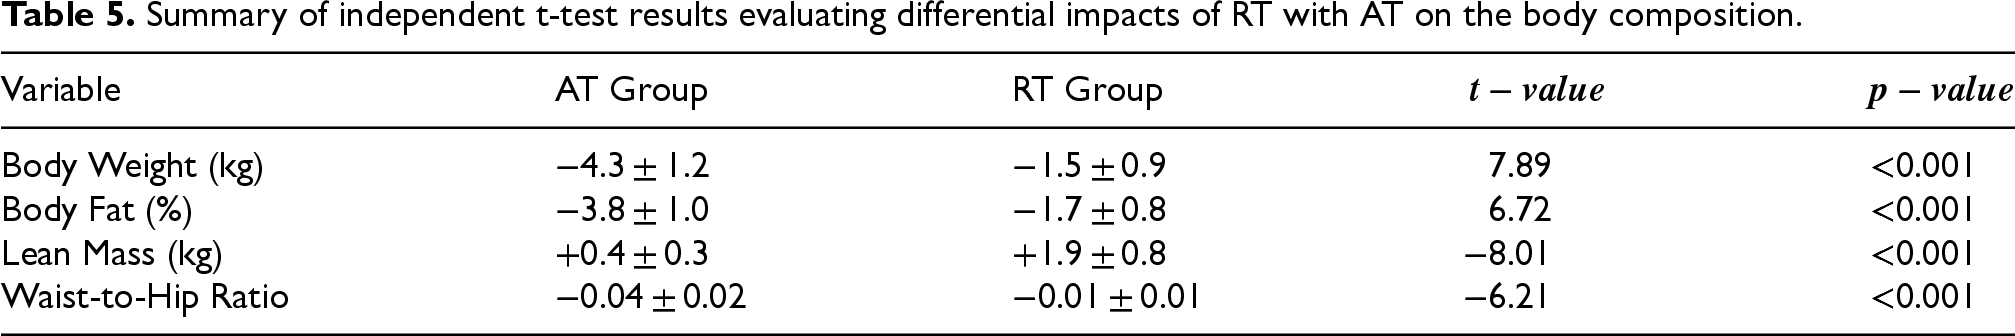
The AT group reduced more body weight (−4.3 ± 1.2 kg) than the RT group (−1.5 ± 0.9 kg), with a statistically substantial difference
Statistical evaluation of Variable interactions using Pearson Correlation Coefficient (PCC) analysis
The PCC analysis measures the direction and strength of the linear connection between the two continuous variables. It is utilized to examine the strength of the relationship between the variables, such as weight loss and fat loss. It allows for the examination of relationships between changes in measures of body composition to better understand the relationships between one another during the intervention. Figure 3 depicts the visual representation of Pearson correlations highlighting key variable interactions. *Significant at p < 0.05.
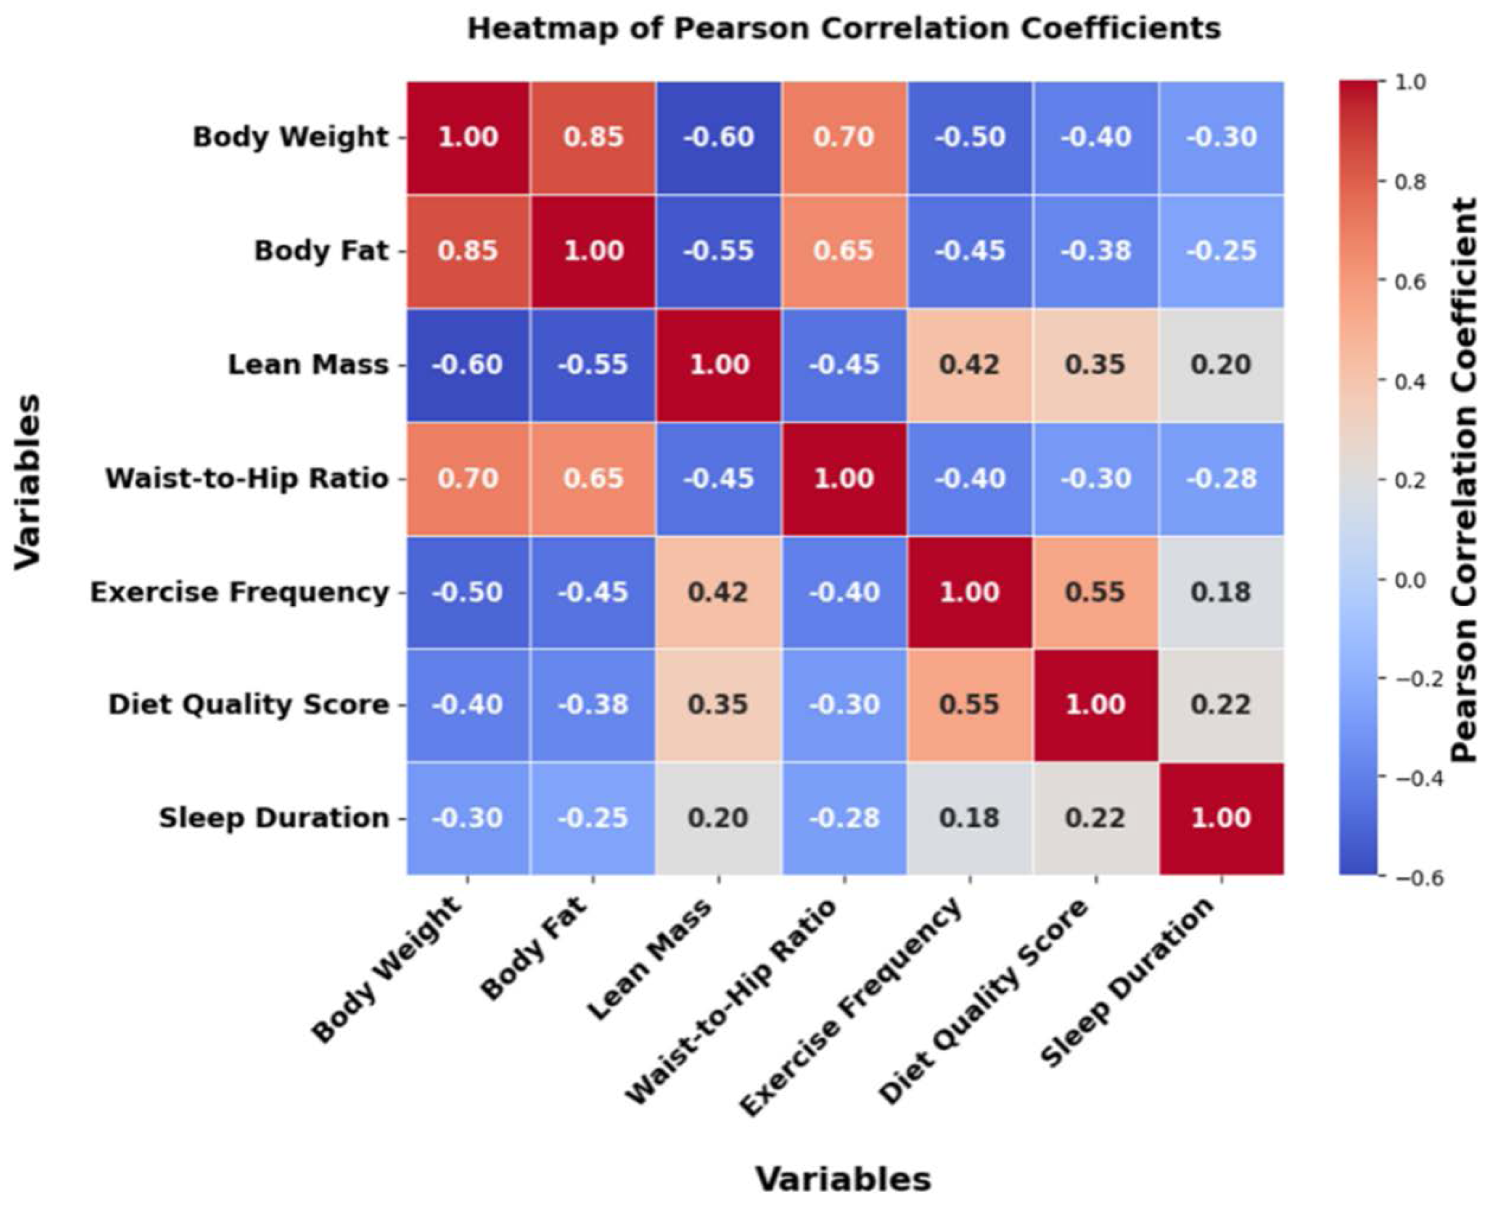
Visual representation of Pearson correlations highlighting key variable interactions.
Table 5 indicates substantial positive relationships between body weight and body fat (
Evaluation of fat loss trends prediction using the ADT model
The research proposed the ADT to identify patterns in participant response and predict fat loss trends. The ADT method was compared with the existing methods such as RF 21 and ANN 21 to predict fat loss trends using the performance metrics such as Mean Absolute Error (MAE), Root Mean Square Error (RMSE) and R-Square (Coefficient of Determination).
RMSE
RMSE is the square root of the average squared difference between expected and actual values. It is calculated by determining the square root of the average squared difference between the expected and actual values. It assesses how effectively the model predicts fat loss trends among subjects. A lower RMSE suggests improved overall prediction performance. Table 6 depicts the RMSE comparison ADT across models evaluating fat loss prediction model accuracy. Figure 4 represents the RMSE scores from different models predicting training effectiveness.
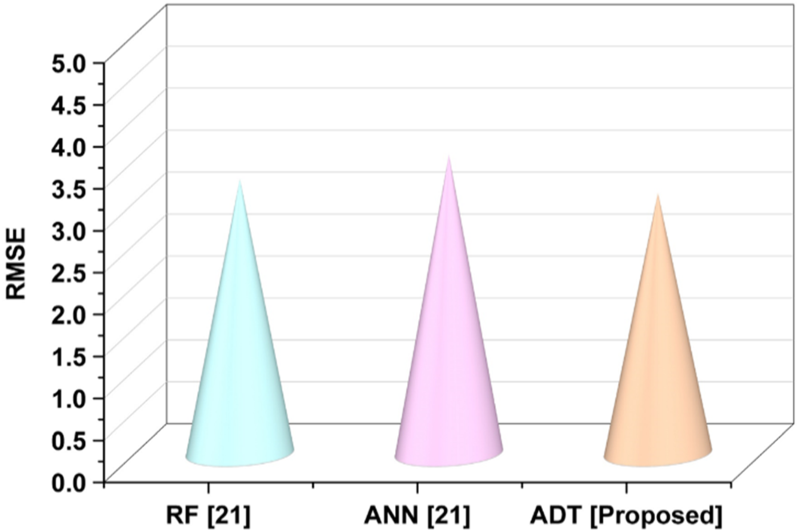
Visualization of RMSE scores from different models predicting training effectiveness.
RMSE comparison ADT across models evaluating fat loss prediction model accuracy.
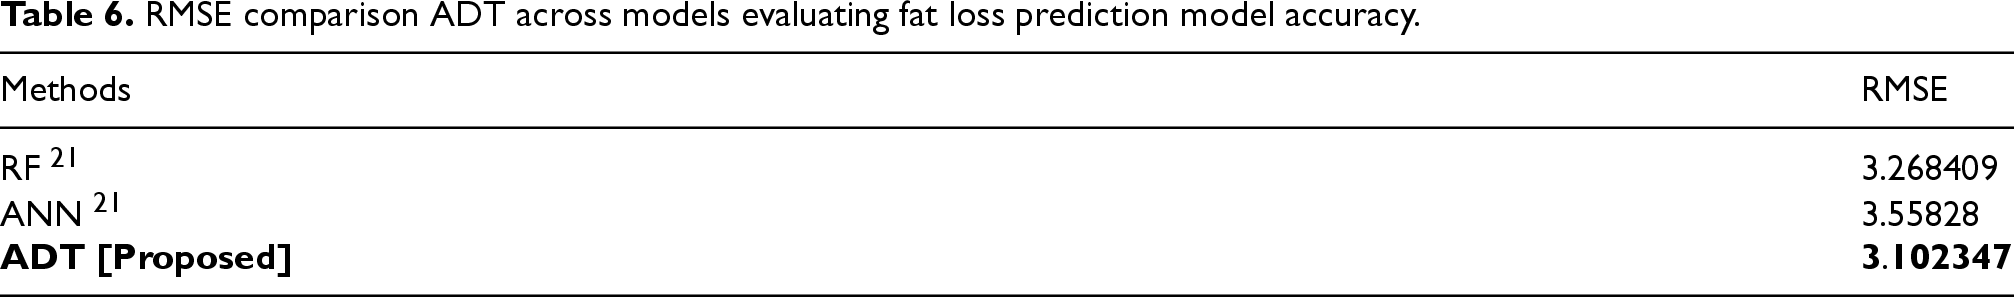
The proposed ADT model has the lowest RMSE of 3.102347, as opposed to 3.268409 for RF and 3.558280 for ANN. This suggests that the ADT model predicted the most accurate fat reduction outcomes overall.
MAE
MAE is the mean of the absolute differences between expected and observed values. It provides a direct considerate of prediction accuracy by treating all errors as equals. It helps to determine how near the expected fat loss figures are to the actual outcomes. A lower MAE indicates a more accurate model for individual-level prediction. Table 7 illustrates the comparison of MAE in existing models and the proposed ADT model. Figure 5 depicts the comparison of the MAE performance of ADT across existing methods.
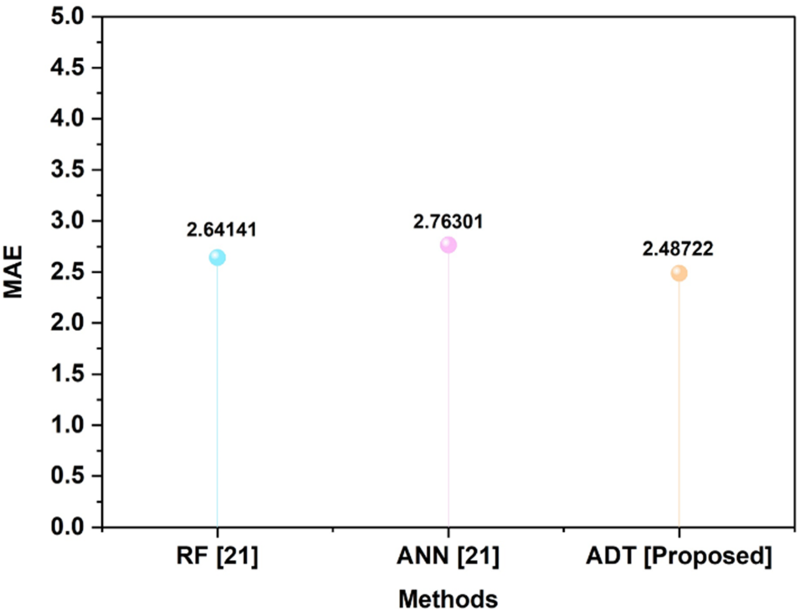
Visual comparison of MAE performance of ADT across an existing method.
Comparison of MAE in existing models and proposed ADT model.
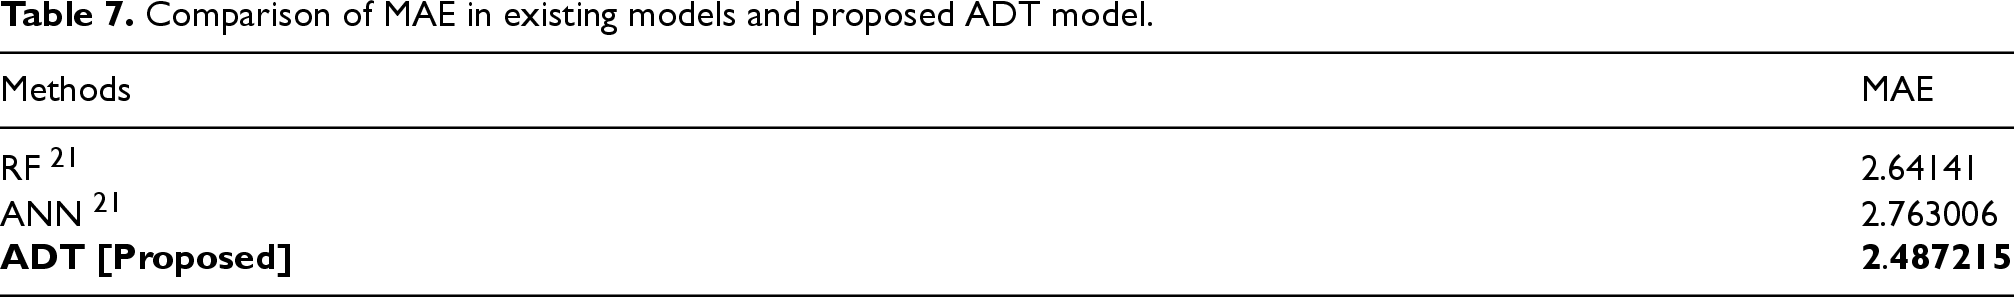
The ADT model had the lowest MAE of 2.487215, outperforming RF (2.641410) and ANN (2.763006). This illustrates ADT's greater stability in forecasting individual fat loss results.
R-squared
The R-squared value is the proportion of variance in the outcome variable that the model explains. It ranges from 0 to 1, with higher values indicating stronger explanatory power. It assesses how effectively the ADT model reflects heterogeneity in fat loss outcomes. A high R-squared indicates that the model is effective at identifying predictors of response. Table 8 represents the comparison of R-squared across classical and advanced predictive modelling. Figure 6 illustrates the comparison of R-squared for regression and classification model types.
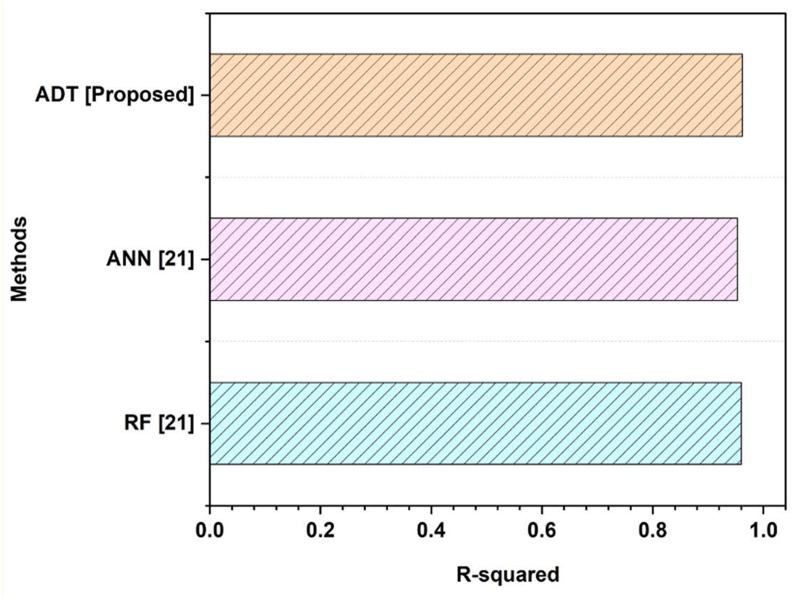
Visual comparison of R-squared for regression and classification model types.
Comparison of R-squared across classical and advanced predictive modeling methods.
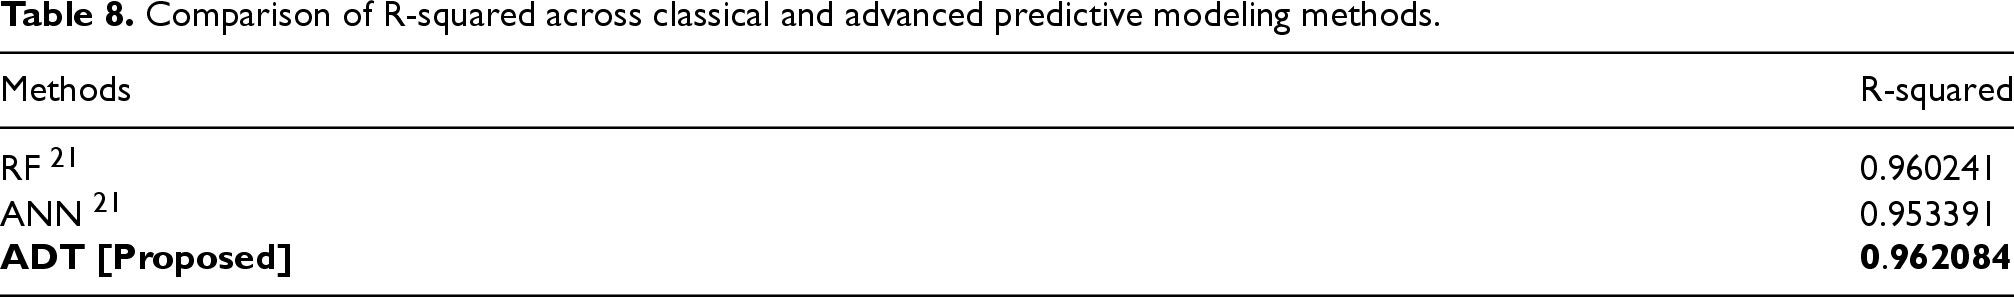
The ADT model has the greatest R-squared score, 0.962084, while RF and ANN had 0.960241 and 0.953391, respectively. This demonstrates that ADT has the highest explanatory power among the methods compared.
Existing methods have specific constraints, such as brief stabilization times and several treatments, 9 constrained intervention periods and variable participant participation, 10 and short exercise durations and varied participation. 14 Small sample sizes and brief intervention periods limit the possibility of generalization and long term efficacy, 15 and single-center methods do not offer long-term follow-up. 16 The drawback of 21 included reliance on short duration data, neglecting long-term change in weight fluctuation trends or behavioral adaptation. Lack of individual variation and inconsistent adherence during the food intervention may have an impact on model performance. Also, it does not include any physical acitivity injections which are necessary for meaningful weight prediction. To overcome these issues, the research proposed the ADT to identify patterns in participant response and predict fat loss trends. The ADT model demonstrated superior accuracy and explanatory power in predicting fat loss outcomes. Its lower RMSE and MAE, along with the highest R-squared value, confirm its effectiveness over existing models. The research provides significant comparative insights into how AT and RT affect weight reduction and body composition, allowing exercise programs to be tailored to individual needs. It emphasized the benefits of AT for fat loss and RT for gaining muscle. The research highlighted the effectiveness of both RT and AT on body composition using evidence-based recommendations that specified person-centred exercise interventions. AT exercise is the most effective on a per-week basis for weight and decrease in fat, RT leads to a major gain in lean muscular mass. Therefore, these outcomes could be used to inform an individual based health program or clinical weight management advice.
Conclusion
The research is designed to compare the impacts of the RT and AT on the weight reduction and the body composition in individuals. A group of 40 adults with diverse fitness levels were assigned to two groups and evaluated using paired and independent t-tests in SPSS v26, with the implication level at
Footnotes
Funding
The author received no financial support for the research, authorship, and/or publication of this article.
Declaration of conflicting interests
The author declared no potential conflicts of interest with respect to the research, authorship, and/or publication of this article.