
Abstract
This study investigates the extent to which labor market dualization polarizes preferences on redistribution between formal and informal sector workers in Latin America and the Caribbean. Differences in welfare state costs and benefits for these labor market groups are likely to fuel diverging incentives regarding welfare consumption. The article tests whether or not informal workers are driven mainly by economic self-interest to increase gains from public welfare goods. The study employed a hierarchical model on pooled survey data from the Latin American Public Opinion Project (LAPOP) 2008 and 2010 to analyze the risk exposure of formal and informal workers and, subsequently, their preferences on redistribution. The analysis reveals that while economic self-interest is an influential factor for formal workers, it is (unexpectedly) much less so for informal workers. Also, an increased economically insecure environment, reflected by high unemployment rates, does not motivate informal workers to an exceptional degree to turn towards the state for redistribution, despite greater exposure to economic risk. Labor market dualization does not translate into polarization at the individual level regarding redistributive preferences in Latin America and the Caribbean.
Introduction
In terms of social policy, the Latin American public is not a homogeneous entity with monolithic preferences. Serious income inequalities have created unhappy cleavages that run vertically through society, and there is also a central horizontal structural divide among the working population: that between formal and informal employment. Latin American and Caribbean (LAC) countries foster a stratified labor market: insiders (formals) contribute to the welfare state via payroll taxation, while outsiders (informals) may be able to free-ride on certain public welfare goods, but remain excluded from employment-related social services and do not pay income tax. Both formals and informals often share short-term horizons regarding their employment situation in LAC, but their costs and benefits differ (e.g. Loayza and Rigolini 2011). Drawing upon insider-outsider theory (Lindbeck and Snower 1986), which considers how labor market institutions can create or reinforce dualization of the labor market in advanced industrial states (Saint-Paul 1996; Rueda 2006; Häusermann and Schwander 2012; Rueda, Wibbels, and Altamirano 2015), it is important to scrutinize whether dualization – and, consequently, polarization between significant labor market groups in terms of the scope of social policies that they prefer – is also taking place in low- and middle-income democracies.
As Häusermann and Schwander (2012: 28) emphasized, “welfare states may compensate for labor market segmentation, but – conversely – they may also perpetuate labor market inequalities or even reinforce occupational divides.” This situation can potentially lead to social cleavages, polarization between the labor market participants, and political mobilization. While insiders can rely on social protection, outsiders lack the support required to cope with adverse life effects and the loss of income in old age. As Rueda (2006: 367) argued, labor market insiders and outsiders in advanced industrial states have different social policy preferences due to distinguishable costs and benefits. Burgoon and Dekker (2010) supported this intuition, illustrating that flexible employment induces higher demand for social policies that increase unemployment benefits in contrast to secure employment. Therefore, the question is whether informal sector workers in developing countries have different preferences for redistribution than their formal counterparts. Do informals as potential outsiders have a different take on the welfare state? Can we transfer insights from the insider/outsider debate of advanced industrialized nations to the context of less developed democracies?
As I show in this paper, 1 the level of preferred redistribution does not – surprisingly – vary decisively between formal and informal wage earners. The attitudes of these workers toward redistribution are similarly high, despite their differences regarding cost and benefits, economic risk, dependency on family networks, and exposure to public institutions. This study further explores why this is the case. If we can detect differences in motivation toward the welfare state, we will also learn more about the design of social policies, voting behavior, and political competition in LAC. The present study is one of the first to systematically examine redistributive preferences of informal and formal sector workers as two distinguishable groups for a cross-section of Latin American and Caribbean countries (see also Castañeda-Angarita and Doyle 2015; Berens 2015). Accordingly, I will start with a comparison of differences and similarities in terms of the socio-economic aspects and study the individual economic insecurity of these labor market participants, before analyzing the redistributive preferences of the two groups.
Acknowledgments: I am grateful to the Latin American Public Opinion Project (LAPOP) and its major supporters (the United States Agency for International Development, the United Nations Development Program, the Inter-American Development Bank, and Vanderbilt University) for making the data available, and I thank the anonymous reviewers for helpful suggestions and comments.
A classical point of departure in political economy research on re-distributive preferences is economic self-interest, referring to the Meltzer-Richard (MR) model (1981). From a rational choice perspective, one would expect that economic self-interest plays a more fundamental role for informal wage earners because they have the opportunity to free-ride on certain public welfare goods that are non-contributory in nature. However, as Dion and Birchfield (2010) have demonstrated, economic self-interest matters less in low- and middle-income countries than in advanced industrial states. A second branch of research emphasizes the relevance of income insecurity and risk for social policy preferences (Moene and Wallerstein 2001; Rehm 2009; regarding Latin America: Carnes and Mares forthcoming). If informals face higher vulnerability, as suggested by case study evidence and statistics (Perry et al. 2007) and as tested in the regression framework below, an increasingly insecure environment illustrated by higher unemployment rates should further stimulate their preferences for redistribution more strongly than the formals’, when the concept of insiderness is applicable to the latter.
To test the theoretical framework, I analyze preferences for redistribution based on pooled survey data from the Latin American Public Opinion Project (LAPOP) 2008 and 2010 with hierarchical modeling techniques. I demonstrate first that informal workers are significantly more likely to be at economic risk than their formal counterparts. However, formals and informals are not decisively polarized in their social policy preferences, which speaks against an insider/outsider divide regarding redistribution. In addition, informals do not have exaggerated expectations on redistribution. The analysis reveals that, in contrast to theoretical expectations from rational choice, informal sector workers are not driven by short-term economic self-interest. Also, an increased economically insecure environment, reflected by higher unemployment rates, does not exceptionally motivate informals to turn towards the state for redistribution. Contrary to theoretical expectations, the insecure labor market position of informals is not translated into preferences for redistribution.
The remainder of the paper is structured as follows. Section 2 introduces the institutional setup in LAC by drawing attention to the concept of informality and elaborating on the welfare system. Section 3 presents the theoretical argument regarding the preference structure of formal and informal wage earners. Section 4 explains the empirical strategy, data structure, and the model followed by descriptive statistics of key characteristics of the two labor market groups. Finally, results and robustness tests are presented, followed by a discussion of the finding's implications and the conclusion.
According to Portes and Hoffman (2003), the informal sector presents one of the largest groups in the Latin American class structure. It is also a politically active group (see Thornton 2000) despite the possible lack of collective action capacity (Tanaka 2010). The academic debate has produced several definitions of the informal economy; these range from Hart (1973), who defined informality by the labor market status of self-employment, to more fine-grained definitions that include the regulatory framework (see Gerxhani 2004: 269). The International Labour Organization (ILO) classifies informal wage earners as those who are “not recognized or protected under the legal and regulatory framework” and who face “a high degree of vulnerability” with regard to job security, representation, or property rights (ILO 2002: 3). 2 Considering this definition, we can apply the insider/outsider framework to the group of informal and formal sector workers, as recently emphasized by Rueda, Wibbels, and Altamirano (2015).
Cross-country data does not enable us to apply this very demanding definition of informal labor. I concentrate the analysis on individuals who indicate self-employment on the one hand, returning to Hart's (1973) definition and more recent work of Loayza and Rigolini (2011), and, on the other hand, on self-employed individuals who also lack health insurance from an employer (for a further discussion, see Section 4).
Informal workers present a very heterogeneous group of individuals (see Portes and Hoffman 2003; Perry et al. 2007). Even though many of them belong to the low-income group, some informal workers also have above-average income. However, their extra-legal status in the economy means they face higher risks and vulnerability since they cannot legally enforce contracts. Employment-related protection such as unemployment insurance or severance pay is practically non-existent for informals, and the former is also negligible for formal workers in LAC. 3 There are no long-term perspectives regarding the employment situation; consequently, informals are much more exposed to risk than formals. Nevertheless, despite lower levels of social protection for informal workers, Perry et al. (2007: 181) noted that informal workers also pursue “private risk management strategies” such as relying on family networks to ‘insure’ themselves against hardship, and withdrawing children from school to use their additional workforce to support the household income, even though such strategies can lead to long-term economic setbacks. In contrast, formal workers benefit from employment related social security and health care and restrictive labor market regulations such as severance pay (see Murillo, Ronconi, and Schrank 2011; Christensen and Wibbels 2014; Rueda, Wibbels, and Altamirano 2015). The analysis below seeks to explain, first, whether informals perceive their status as risk-prone compared to formals and, second, whether they turn towards the state in times of need or whether they rather withdraw from the state turning towards private, informal insurance options.
According to Murillo, Ronconi, and Schrank (2011: 796) unemployment insurance in Latin America is only available in Argentina, Brazil, Chile, Colombia, Ecuador, Uruguay, and Venezuela. Access is usually limited to formal workers and replacement rates are very low.
A brief overview on the welfare systems in Latin America and the Caribbean is needed in order to embed the theoretical framework into context. Taking into account the debate on policy feedback, the level of welfare provision is influential for preference formation and vice versa (e.g., Brooks and Manza 2007). Social policy preferences are affected by the status quo of the welfare system and also the type of social services (see Holland 2014 for Latin America). Welfare systems in LAC are regressive in nature and redistribute with an upward bias (cf. Lindert, Skoufias, and Shapiro 2006; Goñi, López, and Servén 2011). Welfare policy in Latin America started with the development of social security contributions (Haggard and Kaufman 2008), particularly with regard to pension systems, so social security contributions still comprise a large share of welfare effort. Figure 1 gives an overview of per capita expenditures on health care and social security by country (CEPAL 2012) – the main social policy fields of social protection – and how they relate to preferences for redistribution at the aggregated level.
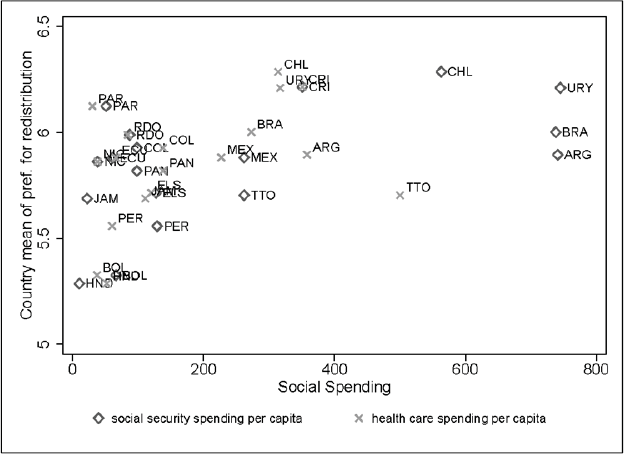
Social Expenditures by Country and Average Preferences for Redistribution (for 2010)
The relationship is not clear-cut, which suggests the need to further differentiate the character of welfare state expenditures regarding access to benefits. The welfare system in LAC is frequently labeled as “truncated” (or “hyphenated”, which also means that formal employment has become less protected in recent times; see Barrientos (2009)). This is because benefits and social protection schemes are often based on formal employment, which manifests in a gap between formal and informal workers. Social security follows a Bismarckian style in most Latin American countries; benefits are linked to employment-related contributions (see Huber and Stephens 2012; OECD, IDB, and The World Bank 2014). However, in order to respond to the problem of coverage, most LAC states have introduced social assistance programs in recent decades, such as conditional cash transfers (CCTs), which provide non-contributory social services for the poor, supporting them with health care and education (Lindert, Skoufias, and Shapiro 2006) and non-contributeory pensions (Carnes and Mares 2014). CCTs are more progressive in nature than social security programs and they also reach the informal labor force, but the level of these benefits is still too low to reduce income differences (Goñi, López, and Servén 2011).
As Holland (2014) and Berens (2015) have illustrated, social policy preferences are affected by the inclusiveness or exclusiveness of the welfare state and also the size of the informal sector, which means that the character of welfare policies must also be considered.
State-led welfare provision and redistribution aims to treat social risks. Individual preferences on the scope and size of welfare provision depend on the individual's status in the economy (Rehm 2009). Redistribution is a focal tool that states use to reduce income inequality (Meltzer and Richard 1981), which is why it is appealing for low- and middle-income groups (as long as the median income is below the mean, regarding the middle-income group). However, redistribution also creates insurance by providing employment-related social services such as unemployment compensation, pensions, employee leave benefits, or occupational disability insurance. Hence, the need for insurance can be as equally important as pure monetary cost-benefit calculations, especially for higher-income earners, which can make this group supportive of redistribution, according to Moene and Wallerstein (2001).
From a rational choice perspective, demand for redistribution should be higher among informal sector workers as it comes at a much lower cost because of income tax evasion. 4 These workers can also potentially benefit by ‘free-riding’ on public welfare goods or specific non-employment-related programs such as CCTs. Moreover, assuming that informals are at greater risk because of their lack of legal contracts and means to enforce rights (for example, the ability to demand employment-related protection such as severance pay when laid off), one can easily expect that informal sector workers have a greater demand for redistribution and welfare benefits (for example, health care, schooling, etc.) than formal sector workers. Put simply, informal wage earners’ redistributive preferences should outperform formal workers’ social policy preferences in terms of level when considering both the cost-benefit ratio and the actual need for benefits and insurance, conceiving the groups as insiders and outsiders.
Not only income tax is evaded; consumption tax such as value-added taxation (VAT) is also much easier to circumvent in the informal sector.
Preferences for redistribution are higher among informal workers.
Next to this general difference in levels, we can disaggregate redistributive preferences of the two groups according to the individuals’ socio-economic status. Building on seminal political economy theories on redistribution and social policy preferences from the OECD context, it can be assumed that individual preferences for redistribution are driven by several individual-level factors, including income (see Meltzer and Richard 1981; Finseraas 2009), education (Iversen and Soskice 2001; Cusack, Iversen, and Rehm 2006), age, political ideology (Huber et al. 2006), uncertainty (Mares 2005), ethnicity (Alesina and La Ferrara 2005), and religion (Scheve and Stasavage 2006). Some of these factors are considerably more relevant for formals than for informals. Following the classical insights from political economy theory, economic self-interest should be the main driver for social policy preferences. Economic self-interest aims at the individual's “economic utility” (Dion and Birchfield 2010: 317) that follows from public policies, which influence the amount of post-tax income. Hence, income at the household or individual level is the common proxy for economic self-interest (e.g., Corneo and Grüner 2002; Finseraas 2009, but less explicitly), next to the level of education, as in Dion and Birchfield (2010). Higher education is linked with higher earnings and usually reduces preferences for redistribution, just as higher income. Individuals are considered to be rational actors in this school of thought (e.g., Corneo and Grüner 2002).
Drawing on the classical median voter theorem of Meltzer and Richard (1981) (hereafter, MR model), the low-income formal wage earners should favor a larger welfare state as they are its direct beneficiaries. 5 Preferences for redistribution should decrease with increasing income so that high-income earners oppose redistribution. They should also oppose it from an insurance perspective, as they have private means for insurance, which are usually less costly in LAC than the public solution. Because of the high rate of income inequality in LAC, one can assume that the middle-income group is closer to the low-income group, suggesting that the former would also favor increased welfare provision and greater redistribution, not only to reduce income differences, but also to provide insurance against hardship. In contrast, this reasoning also suggests that informal sector workers should favor increased welfare provision and redistribution across all income groups as it comes at much lower cost. High-income informals do not have to fear redistribution because they avoid taxation. It is therefore possible that informal workers pursue a utility maximizing rationale in order to receive maximum gains from redistribution. This is unlikely to be the case for formal workers given that an exaggerated demand, which means support for levels of redistribution that lead to distortion and economic stagnation due to massive taxation, harms the system in the long run. As formal workers invest in the system with tax contributions, they are more likely to follow not only a utility-maximizing rationale, but also a welfare-maximizing rationale, which supports redistribution only up to a ‘reasonable’ degree. Subsequently, disaggregating social policy preferences by income group and following the MR rationale, I propose the following hypothesis:
Shortcomings in the MR model have been abundantly discussed in political economy research, relating to the macro mechanism of income inequality and welfare spending (cf. Kenworthy and McCall 2008). However, the relevance of income, among other factors, for redistributive preferences has so far been supported in the literature (see Corneo and Grüner 2002; Finseraas 2009).
Being part of low- and middle-income groups fosters a positive attitude toward redistribution of both formal and informal workers. The income effect should be stronger for informal workers and across all income groups.
Along with the important role of income for social policy preferences, a second branch of research advocates the explanatory power of risk exposure for preference formation (Moene and Wallerstein 2001; Rehm 2009; Cusack, Iversen, and Rehm 2006; Carnes and Mares forthcoming). Informal employment lacks legal means to enforce contracts and liabilities, which means that transaction costs are considerably higher for informal workers than for their formal counterparts (see Feige 1990). Bur-goon and Dekker (2010) demonstrate that, in advanced industrial democracies, flexible employment increases job and income insecurity at the individual level (see also Cusack, Iversen, and Rehm 2006). Welfare preferences are not only based on immediate costs and gains reflecting a short-term perspective; considerations about future risks (such as employment loss) can also play a role. While individuals who work in the formal sector can rely on working contracts and labor market regulations such as severance pay, and eventually a pension, informals cannot fall back on any of these options. If individual risk is the main driver of the social policy preferences of informal wage earners, demand for redistribution should remain high despite increasing levels of income or education due to their vulnerable situation in the labor market. If informal workers also perceive their economic situation as more risk-prone, we can expect them to have a higher demand for redistribution. The more risky the environment, the higher is the need for insurance via redistribution.
A simple indicator for risk exposure is the unemployment rate, as it increases pressure on the labor market when labor becomes more abundant. Such a development can put informals at increased risk compared to formals because informal workers lack any forms of formal labor protection, such as employment contracts, and can therefore be laid off easily. Increasing problem pressure should induce higher demand for redistribution of both groups, but most strongly for informals who are more exposed to risk (see Christensen and Wibbels 2014 on labor regulation and inequality in labor-abundant countries). As Barber, Beramendi, and Wibbels (2013) have shown, however, it is difficult for individuals to disentangle the redistributive and insurance effects of social policies, due to the complexity of the issue; consequently, it is unclear at what point redistributive concerns rule out insurance motives or vice versa. Both rationales might apply and the theoretical framework elaborated here does not claim to adjudicate between the two motives. Along with the impact of income, risk exposure should also motivate the informals’ redistributive preferences.
A more economically insecure environment increases preferences for redistribution. The effect should be stronger for informal workers.
The proposed influence of economic risk and self-interest depends on the type of welfare policy in place. A generous universal welfare state that supports individuals in need, independent of prior contributions, would mitigate the need for informals, while a very exclusionary system based on employment-related contributions 6 should stimulate the welfare needs of labor market outsiders, as represented by informal workers.
Employment-based social security is still the most frequent system in Latin America, despite a recent trend towards non-contributory systems (see Carnes and Mares 2014; Carnes and Mares forthcoming; Huber and Stephens 2012).
Before moving to the empirical part, two caveats need to be addressed. The proposed theoretical model is a simplified and static version. The transitions between formal and informal sector and dual-employment in both informal and formal sectors are not specified because of a lack of information in the survey used to study the proposed argument – even though this may be relevant for the empirical investigation and theoretical considerations. Formal and informal employment is permeable in Latin America and the Caribbean (see Schneider and Karcher 2010). Workers in LAC are able to switch between formal and informal employment over their life cycle. When formal workers assume that an imminent switch to informal working is highly likely, homogenized preferences can be expected. However, a recent World Bank study by de la Torre, Messina, and Pienknagura (2012) noted that the labor markets in Latin America have become much less volatile in recent years and that individuals have longer job durations. As the data does not allow us to identify ‘swing’ workers, the labor market status of the respondents at one particular point in time is measured, which needs to be kept in mind for theoretical and empirical implications.
A further aspect that needs consideration is the path that leads to informal employment. It is likely that the reasons for informalization also influence social policy preferences (see Saavedra and Tommasi 2007). Tax evasion and discontent with public services might provide motivation for ‘going underground’ (see Torgler 2005) but this is probably only the case for informals who have the means to make such a free choice about the sector of employment. I assume these reasons have lower priority than motives such as survival when considering the entire group of informals.
I start the analysis by using a hierarchical varying intercept varying slope model with pooled survey data from the Latin American Public Opinion Project (LAPOP), 7 which was conducted in 24 Latin American and Caribbean countries in 2008 and 2010. I have used a hierarchical model because individuals are nested in countries, which means that observations lack independence. The hierarchical model is also effective at managing different groups sizes, which is the case in the sample used here. Furthermore, a part of the research agenda is based on the understanding of contextual effects on social policy preferences. I have used the survey from 2008 and 2010 because these two waves contain the items used to operationalize the dependent and independent variables. 8 As a robustness test, I have added a fixed effects model with clustered standard errors to address a possible omitted variable bias at the macro level. Regarding case selection, only those years that are classified as 5 or higher at Marshall's Polity IV scale (Marshall, Jaggers, and Gurr 2010) for a country are included, so that only democracies are part of the sample. 9 Only democracies are considered because the logic of redistributive preferences does not apply in the same way to authoritarian states.
LAPOP conducted the survey in the following 24 countries: Mexico, Guatemala, El Salvador, Honduras, Nicaragua, Costa Rica, Panama, Colombia, Ecuador, Bolivia, Peru, Paraguay, Chile, Uruguay, Brazil, Venezuela, Argentina, Dominican Republic, Haiti, Jamaica, Guyana, Trinidad and Tobago, Belize, and Suriname. Due to the absence of data at both macro and micro levels, Guyana, Trinidad and Tobago (no party ideology and social assistance coverage information), Haiti, and Suriname (no social assistance coverage information) were removed from the sample in the analysis of redistributive preferences so that N Level 2 is reduced (Table 3).
Average Income and Years of Education by Labor Market Group
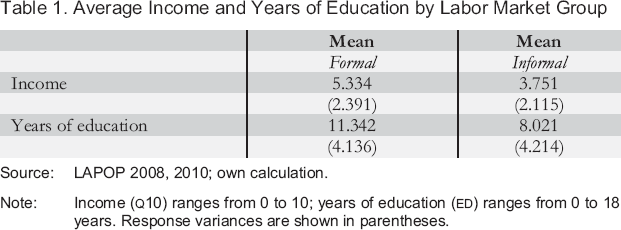
Source: LAPOP 2008, 2010; own calculation.
Note: Income (Q10) ranges from 0 to 10; years of education (ED) ranges from 0 to 18 years. Response variances are shown in parentheses.
Logistical Hierarchical Varying Intercept Varying Slope Regression: Economic Insecurity and Employment Loss Experience
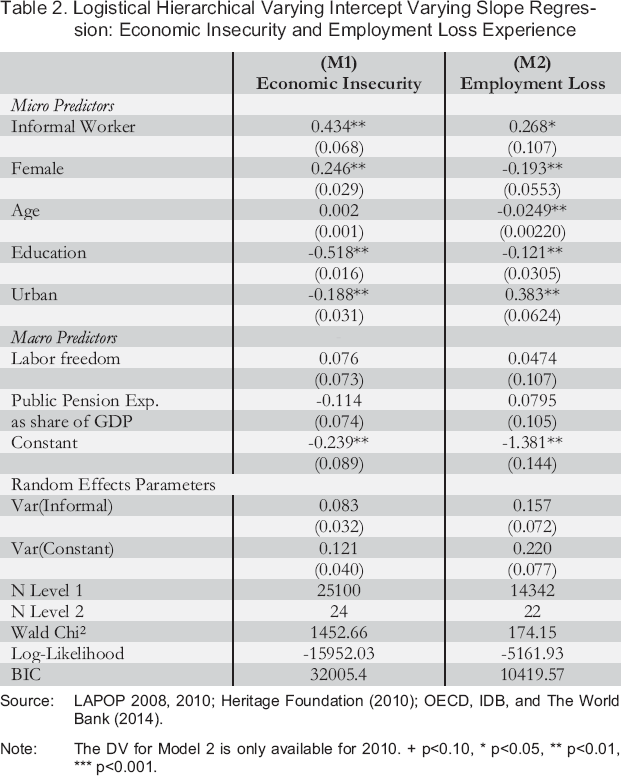
Source: LAPOP 2008, 2010; Heritage Foundation (2010); OECD, IDB, and The World Bank (2014).
Note: The DV for Model 2 is only available for 2010. + p<0.10, * p<0.05, ** p<0.01, *** p<0.001.
Hierarchical Linear Varying Intercept Regression: Preferences for Redistribution by Labor Market Group
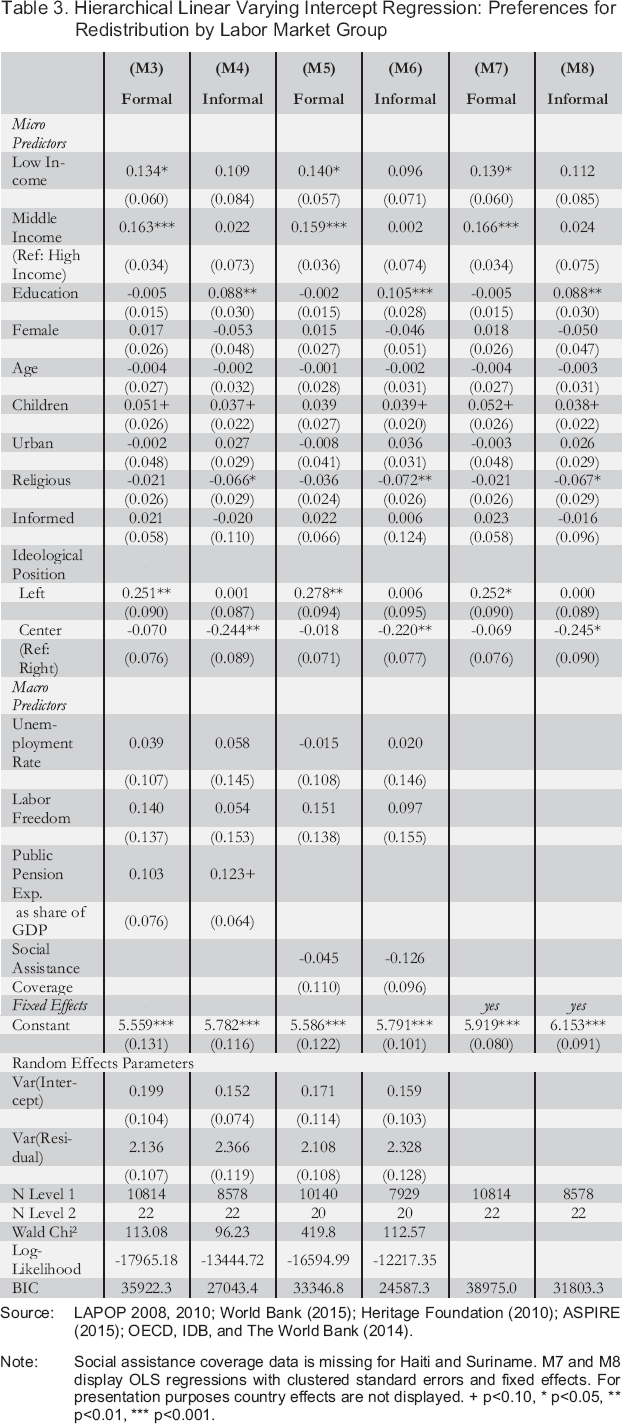
Source: LAPOP 2008, 2010; World Bank (2015); Heritage Foundation (2010); ASPIRE (2015); OECD, IDB, and The World Bank (2014).
Note: Social assistance coverage data is missing for Haiti and Suriname. M7 and M8 display OLS regressions with clustered standard errors and fixed effects. For presentation purposes country effects are not displayed.
p<0.10,
p<0.05,
p<0.01,
p<0.001.
The DV (ROS4) was added in 2008. The independent variable income (Q10) was readjusted regarding the income brackets in the 2012 LAPOP.
I relax the recommendation of Marshall, Jaggers, and Gurr (2010) to use a threshold value of +6 due to data constraints. The survey year 2010 for Venezuela and Haiti is excluded since the country was ranked −3 and 0 on the Polity2 scale; that is, those countries were not democratic. Ecuador, Suriname, Venezuela in 2008, and Haiti 2008 are on the verge of still being considered democratic, with a Polity value of 5. I have included the country years ranked with 5 in the analysis, as observations at level 2 are needed.
I started by testing whether informal workers are at greater economic risk than formal wage earners, which is a prerequisite for the theoretical framework to work, using economic insecurity and experience with employment loss as dependent variables (DV). Next, turning towards the analysis of redistributive preferences, I examined whether labor market status significantly influences redistributive preferences using the entire sample of formal and informal workers with a varying intercept varying slope regression model. Finally, I contrasted the social policy preferences of the two groups, studying the factors that drive their preference formation with separate regression analyses.
Economic insecurity is measured using the question of whether or not individuals have sufficient salary to make savings, and the degree to which this affects the respondent negatively, on a range from 1 to 4 (LAPOP Q10D). I recode the variable to a dummy with 1 (values 3–4) reflecting a perception of the economic situation as troubling and 0 (values 1–2) reflecting that the salary is sufficient to make savings. Additionally, I test economic insecurity with the experience of employment loss (see Carnes and Mares forthcoming), which should be higher among informal workers (1 reflects employment loss in the last two years, 0 no employment loss). 10 I use the LAPOP item ROS4 to measure preferences for redistribution: “The […] government should implement firm policies to reduce income inequality between the rich and the poor”. The scale ranges from 1 to 7, with higher values signaling higher levels of support. The item is frequently used in the welfare state literature that studies redistributive preferences (Alesina and La Ferrara 2005; Finseraas 2009; Rehm 2009, for the OCED context; Holland 2014 using LAPOP; Dion and Birchfield 2010 using a large set of surveys). The item illustrates redistributive preferences, as income redistribution by the state is the primary means of addressing income inequality. Redistribution creates winners and losers as it adjusts the pre-tax income structure by means of taxes and transfers so that the post-tax income distribution becomes smoother. The concept captures a central dimension of social policy regarding equity in the distribution of income.
The item has been added to LAPOP in 2010.
The clandestine nature of informality means that measuring informal employment is a delicate matter. Schneider and Enste (2000) reviewed different measures of the informal economy, emphasizing the difficulty of the endeavor and showing that it is not possible to declare one method superior to the others. To identify informal wage earners in the survey, I rely on the item OCUP1A, which asks respondents which type of occupation they pursue. I follow the identification strategy of the World Bank researchers Loayza and Rigolini (2011), who have contributed seminal insights to the study of the informal economy (see also Loayza 1996), using the survey category ‘self-employed’ to indicate informal employment. I also added an additional restriction based on the possession of employment-related health insurance. Arguably, self-employment is an incomplete measure as Loayza and Rigolini (2011: 1508) have discussed at length. Informals who are salaried employees are not considered. However, the authors also noted that “in most countries there is a strong association between self-employment and informal activity, as most self-employed workers tend to be low-skilled and unregistered workers” (Loayza and Rigolini 2011: 1508). Furthermore, the authors ran several robustness tests to scrutinize the reliability of this measure, coming to a positive conclusion. The other categories of the item OCUP1A from which the respondent can choose are public employee, private employee, “owner or partner in a business,” or “unpaid worker” (LAPOP, OCUP1A). Hence, we can assume that professionals choose the category “owner or partner in a business” when they run their own company in the formal economy rather than choosing the category “self-employed”. In order to increase the reliability of the measure, I have only classified as informal those respondents who are not only self-employed but also lack health insurance. 11 Only formal workers have occupation-based insurance (see Perry et al. 2007). Working individuals who indicate that they have health insurance were coded as formal workers. I excluded all respondents from the sample who are non-employed (such as housewives, students, retirees) in order to fully concentrate the analysis on formal and informal wage earners.
The health care insurance question differs in the 2010 survey (SAL2). The respondents indicated whether they have a health insurance plan through social security, through the government, or a private plan or both (coded as 1 for having health insurance).
Economic self-interest is proxied by household income. The survey item Q10 measures income deciles by indicating fixed income ranges to the respondent. I created income dummies for the low-, middle-, and high-income groups (reference category: high income). The low-income group is coded to range from no income to the fourth decile, while the middle-income group ranges from the fifth decile to the seventh, and the eighth to tenth deciles represent the high-income group. Categories are not equal in size, as the low-income category contains more income deciles. I adopted this conservative approach in order to capture only the very rich in the highest category, and to include only the sound middle-income workers in the middle-income category, given the skewed income distribution in Latin America.
I have used the unemployment rate to capture insecurity and problem pressure at the context level (World Bank 2015). Becoming unemployed means an immediate income loss and thus presents a serious threat to most people (see Rehm 2009: 863). As discussed above, increasing unemployment leads to an abundance of labor. In particular, when unemployment rates among the low skilled individuals rise, labor costs decline because wages can be lowered. Hence, the employment situation of informals can become particularly precarious as the level of unemployment rises.
At the micro level, I controlled for a set of socio-demographic variables that have become common in studies on social policy preferences. These include gender (female), age, number of children, education (years of schooling), urban, political ideology (left, center; right-wing serves as reference category), 12 and religiosity (on the latter, see Scheve and Stasavage 2006). I controlled for level of information as more informed individuals might develop a more sophisticated account of which social policies are in their interest. I created a dummy variable, with 1 indicating that someone is well informed because of higher media attention. I also included control variables at the macro level. However, as there are only 24 observations at the country level, the number of degrees of freedom is considerably small, which means that the number of parameters at the macro level is limited. 13 Therefore, a fixed effects model with clustered standard errors is used as robustness test to rule out the chance that findings at the micro level could be biased by unobserved heterogeneity at the country level.
Values from 1 to 3 are coded as left, 4 to 7 illustrates a center preference, and values from 8 to 10 represent a right-wing party preference. The approach is conservative, creating a larger category for the center so that left and right capture slightly more extreme positions.
A variable for the survey year 2010 was added to test whether the time period of the survey affects the outcome variable. As the variable is not significant in all models, it was dropped to save degrees of freedoms at level two.
Additionally, the scope of the welfare state has to be factored in when studying social policy preferences, as discussed above. Therefore, I included information on public pension expenditures as a share of GDP from the recent OECD, IDB, and The World Bank (2014: Pensions at a Glance) report. I also used information on social assistance coverage for the total population from the ASPIRE dataset of the World Bank (ASPIRE 2015; as used in Holland 2014). 14 The measure contains information about coverage by social assistance programs in contrast to social insurance, but it lacks observations for many Caribbean states. 15 I added a control for labor market rigidity using the “labor freedom” index from the Heritage Foundation (Heritage Foundation 2010). The index is based on information on minimum wage, severance pay, firing policies, rigidity of hours, hindrance to hiring additional workers, and the notice period (Heritage Foundation 2010). Higher values reflect a more flexible labor market (scale 0–100). Additional robustness tests were conducted on further macro controls, such as the level of income inequality (Gini index), trade openness to account for liberalization and economic pressure, and severance pay (data from the World Bank Doing Business report 2013); these are provided as supplementary material. 16 Several observations are missing because some questions (such as political orientation) were not asked in some countries and some items had low response rates (see fn. 7). An overview of the variables used in the models can be found in Table A (Appendix).
The data has some limitations regarding comparability across countries so that we need to interpret the findings with care.
Moreover, as a robustness test I also employed social security and health care spending per capita provided by CEPAL (2012); this is provided as supplementary material.
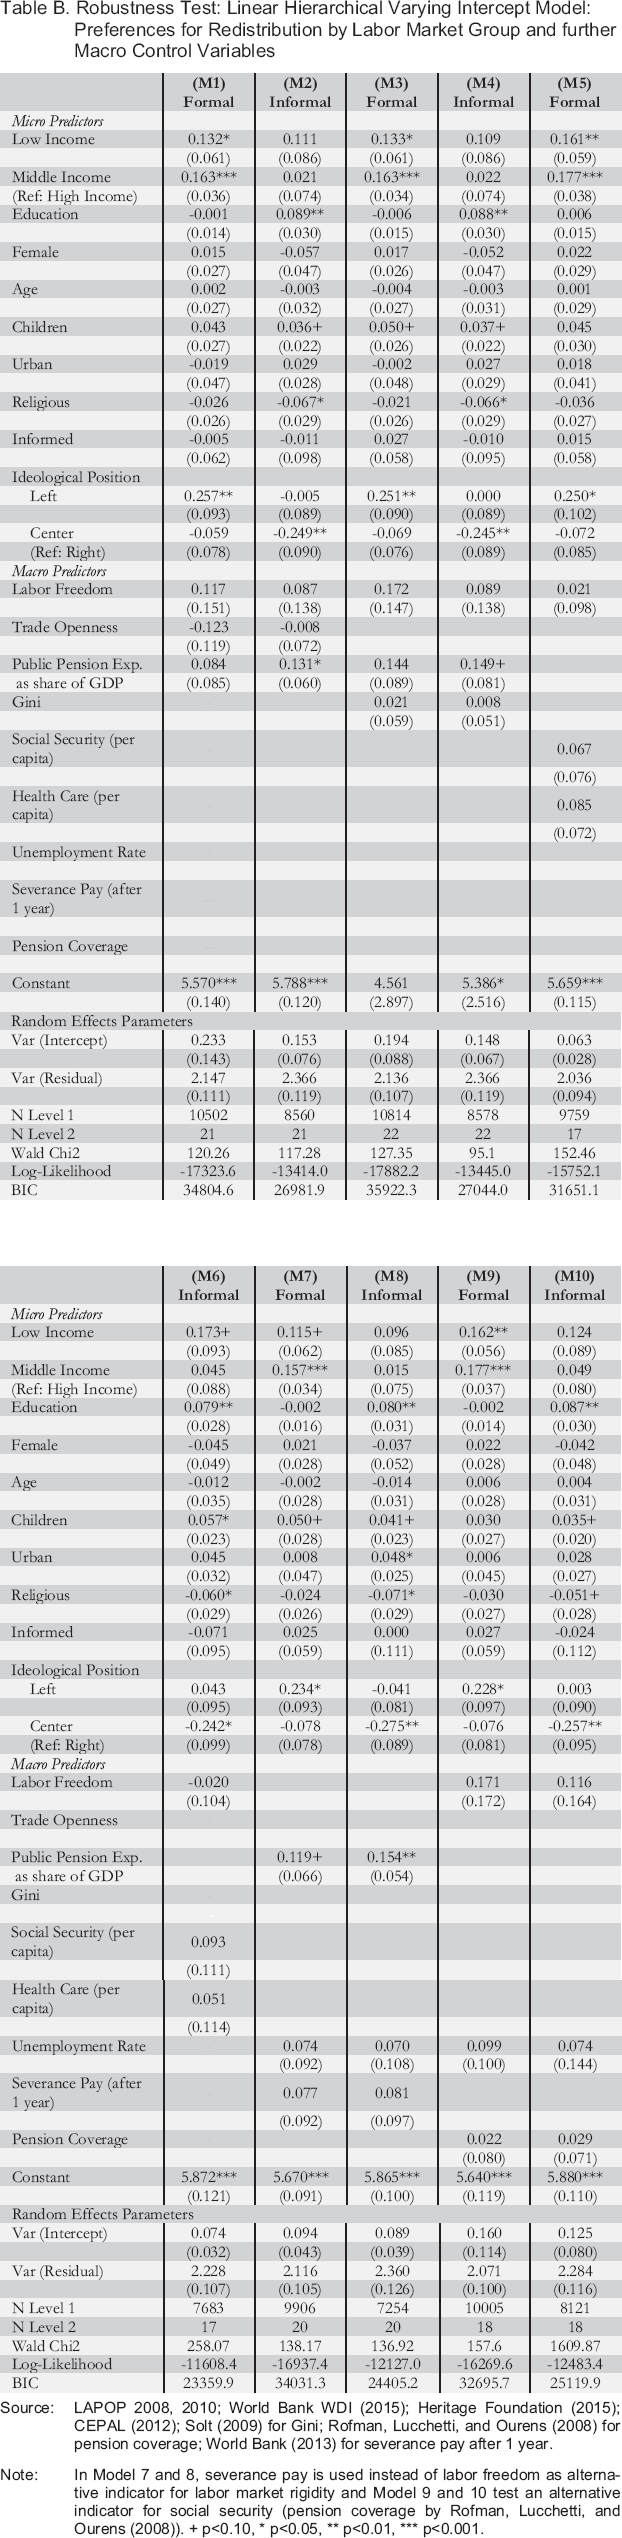
Inequality, trade openness, and labor market regulations did not significantly affect the redistributive preferences of the two labor market groups. The estimation table is displayed in the Appendix Table B.
As Steenbergen and Jones (2002) emphasized, the nested structure of the data means that the hierarchical model is required in order to receive correct standard errors. The intercept is not constrained, so that it may vary according to country. Furthermore, I let the labor status informal worker vary by country as random slope. The theoretical framework proposes, in H1, that redistributive preferences of formals and informals depend on their status in the respective economy involving differences in access to welfare benefits and exposure to risk, so that a varying intercept varying slope model needs to be applied. I relax the assumption of a latent variable structure, resulting from the categorical structure of the dependent variable, by using a linear model and treating y as a continuous variable to reduce complexity. 17 In accordance with Gelman and Hill (2007), the varying intercept varying slope equation is specified as follows 18 (for i=1,… N (individuals) and j=1,… J (countries)):
To test the robustness of the findings, I use an ordered probit model, which takes into account the categorical structure of the dependent variable (the distance between the categories are not necessarily equal (Long 1997)). Findings for the ordered probit model for the variables of interest do not strikingly deviate from the findings presented above, so that the more intuitive model is chosen for the presentation of results. Estimation results are available on request.
As the DVs for economic insecurity are dichotomous variables, a logistic hierarchical varying intercept varying slope regression will be applied in section 6.1 before I proceed with the linear model in the main part of the analysis.
The vector X includes a set of individual level predictors, as discussed in section 4.3, and U represents macro level controls. I grand mean standardized variables that are not dichotomized in the model in order to enable reasonable comparisons between the models (cf. Gelman and Hill 2007) and I made use of survey weights. The intra-class coefficient (ICC) Q for the DV is QDV_redist.=0.09, which means that country-level differences explain 9 percent of the variance in the DV. Since most variation in individual-level attitudes is explained by individual-level factors, the relatively low value is not surprising.
In order to unpack preferences for redistribution of formal and informal workers in LAC, I start with a brief overview on descriptive statistics on income, levels of education, and political orientation of the two labor market groups and the preference differential regarding redistribution. The income distribution of informal wage earners is much more skewed towards the lower ends than it is for their formal counterparts. While the income distribution in LAC is already highly unequal (de Ferranti et al. 2004), a further divide is established within the labor market, distinguishing formals and informals by the level of income. The average informal worker is situated in the fourth decile, while the average formal worker is located in the fifth (see Table 1). Besides the tendency toward lower earnings, some informal workers also have above-average income. As Perry et al. (2007) emphasized, informal sector workers are relatively disadvantaged in terms of their opportunities to gain education. Governments in LACs have increased their efforts to invest in education, and therefore human capital development, by means of social assistance programs such as CCTs, which are non-contributory in nature. However, the distribution is more left-skewed for formal wage earners and right-skewed for informals, as illustrated in Table 1. It must be noted, though, that these general statistics disguise variation in the income distribution of the groups across countries.
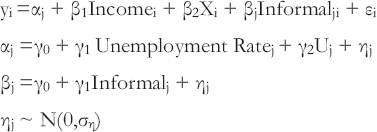
Moving toward political orientation of the two labor market components, the picture becomes more diverse. Respondents are asked to place themselves on the left–right scale with regard to their political orientation (1 meaning far-left, 10 referring to the far-right). Individuals in LAC use the classical left–right scale to express their political orientation (see Wiesehomeier and Doyle 2012 on the left–right dimension in LA; Harbers, de Vries, and Steenbergen 2013 on self-placement on the left–right scale in LA), even though there is variation in the meaning that individuals apply to the left–right semantic (Zechmeister 2006). There is a general tendency to cluster in the center of the ideological spectrum in Latin America, so that high values for the center are not surprising. Keeping in mind the OECD literature on insider–outsider politics (e.g., Rueda 2006), one could expect that informals (the potential outsiders) tend further to the left as leftist parties might increase the level of welfare services. However, this also depends on the party strategies of leftish parties, which can also include incentives to promote the status of insiders only (see Rueda 2006; Häusermann and Schwander 2012). Right-wing parties could be also very appealing to outsiders as they usually pursue deregulation of the labor market, which, in the following, facilitates access to formal employment for informals. I display the distribution of political orientation in Figure 2.
Average Self-placement on Party Ideology Scale (1 = left to 10 = right) of Informal and Formal Workers by Country
Formals do not have a constantly stronger left-wing political orientation (which presumably fosters their insider status), nor do informals generally place themselves on one end of the spectrum. On average, informals hold a more right-wing position in El Salvador, Nicaragua, Colombia, Ecuador, Peru, Chile, Uruguay, Brazil, Haiti, Jamaica and Suriname.
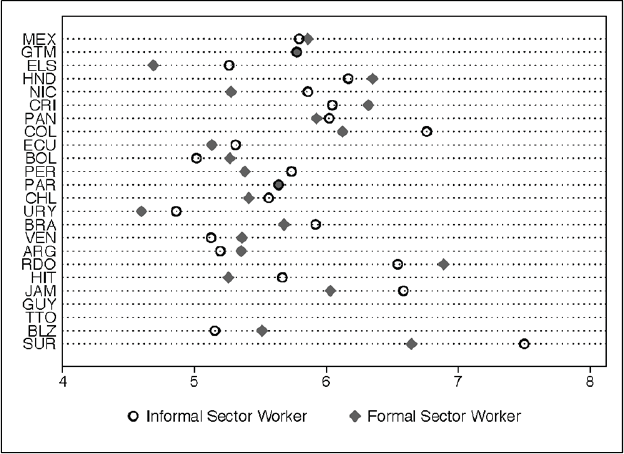
Finally, I illustrate descriptive statistics on redistributive preferences of the two groups to show the degree of polarization. Figure 3 shows averages for the survey item “preferences for redistribution”. Given differences in welfare state costs and benefits for both labor market groups, it is surprising that the preference differential between formals and informals is low, as can be seen in Figure 3. However, it varies by country. Informal sector workers (dashed bars) have marginally lower preferences for redistribution in countries such as Chile, Suriname, Colombia, Brazil, Guatemala, and El Salvador, while their demand is higher compared to the formal worker groups’ (grey bars) in Uruguay, Paraguay, Haiti, Costa Rica, and Nicaragua.
Average Preferences for Redistribution by Labor Market Group and Country
No pattern can be discerned from the descriptive statistics with regard to welfare regimes in these countries. According to Huber and Stephens (2012), Argentina, Brazil, Chile, Costa Rica and Uruguay have the most developed welfare systems, but redistributive preferences are not lower in these countries and the demand from informals is not constantly higher. To sum up, informal workers, on average, are poorer and have lower levels of education than formal workers. Political ideology varies by country, but does not show a clear group pattern. According to these results, one could expect that informal workers have a greater demand for redistribution because their status in the economy appears to be more risk-prone, but this is not the case according to descriptive evidence shown in Figure 3. The next section tests whether these apparent findings also hold in a regression framework.
Economic Insecurity: Who is at Risk?
In the OECD literature, outsiders are defined by the level of vulnerability and uncertainty that this labor market group encounters (Häusermann and Schwander 2012; Rueda, Wibbels, and Altamirano 2015). These two features ‘travel’ well to informal wage earners in low- and middle-income economies. If informal employment resembles this understanding of labor market outsiderness, then we should also find higher income insecurity of informal workers. Controlling for gender, age, education, labor freedom and social protection (expenditures on public pensions as share of GDP is used as proxy) in a hierarchical varying intercept varying slope logistic regression (the DVs are dummy variables), I found a significantly higher likelihood to perceive higher income insecurity and to have experienced employment loss for informal workers (see Table 2).
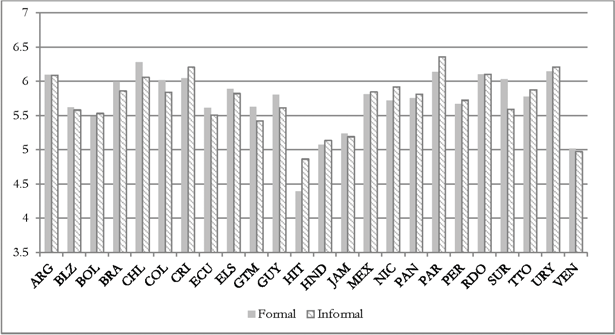
I have illustrated the average marginal effect of labor market status as predicted probabilities of perceiving the personal income situation as insecure (Figure 4). There is a 53 percent probability that informal workers will evaluate the personal income situation as precarious, while the likelihood is significantly lower for formal workers (approximately 43 percent) at the 0.1 percent level of significance. Nevertheless, even though informals have a significantly higher probability of economic insecurity, the likelihood for formal sector workers is also not negligible, demonstrating the generally high labor market risks for both groups. As illustrated in the second plot in Figure 4, it is also more likely that informal workers will have an interrupted employment history. In this latter case, however, the differences are less striking. The confidence intervals overlap to some degree, which shows that the groups are less significantly different from each other. Both groups have unstable employment histories.
Predicted Probabilities for DV Insecure Economic Situation and Experience with Employment Loss (95 percent CIs)
Having shown that employment insecurity is significantly higher for informals than for formals, I then tested H1; that is, whether being either an informal or formal worker significantly varies redistributive preferences on a country-by-country basis. I did this using a hierarchical varying intercept varying slope model, allowing the variable informal worker to vary according to country. However, the average variance of the random effect (informal worker) and the coefficient are both insignificant for redistributive preferences. Labor market status does not significantly affect preferences for redistribution, refuting hypothesis 1. The average marginal effect is 5.687 for informals and 5.692 for formals. Moving from the labor market status formal to informal reduces redistributive preferences by 0.005. The marginal effect is not significant. Both formals and informals hold a very similar preference for redistribution, on average. Moreover, the Likelihood-Ratio test, which tests whether a random slope for labor market status needs to be applied, is not significant, 19 which means there is no significant variation between countries. Despite greater risk exposure and possibilities for informals to benefit from public non-contributory welfare goods (increasingly available in several countries, see Carnes and Mares 2014) that come at much lower costs to them regarding the lack of income taxation, informals do not turn more strongly towards the state for redistribution. Instead of displaying the regression table, I have shown the finding graphically by displaying the random slopes for labor market status for the DV redistributive preferences where small variation of the random slope, though not significant, can be visualized. Figure 5 uses exact estimates for each country for the fully specified model 20 (with 95 percent confidence intervals).
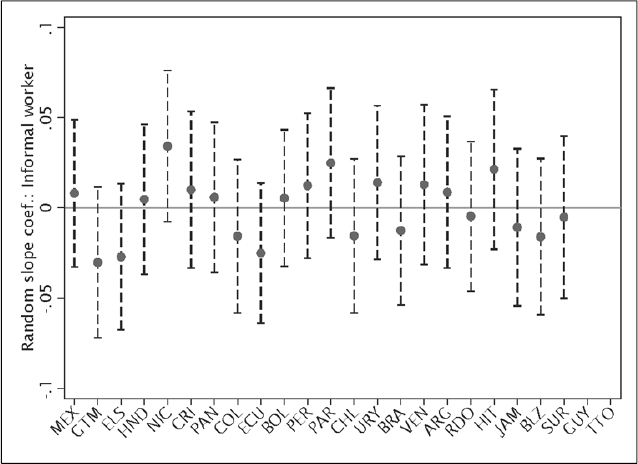
Random Slope of Informal Worker on Preferences for Redistribution
The varying intercept model outperforms the more complex varying intercept varying slope model.
The model is based on 22 countries and follows the same specification as in the models shown in Table 3 with an additional random slope for informal worker. Estimation tables are provided on request.
The surprising lack of social policy polarization between the two labor market groups could be explained by the growing precariousness of both groups in Latin America. As Barrientos (2009: 96) emphasizes, reforms of the welfare state in the 1990s and the focus on liberalization have “eroded the premium attached to formal employment” to some extent so that formals and informals have moved closer together. Consequently, we need to ask whether formals and informals are also motivated by the same factors in their social policy preferences. The next section addresses the black box of preference formation among the formally and informally employed, unpacking the factors that drive redistributive preferences of each group separately. The subsequent section proceeds with a simpler varying intercept and a fixed-effects model for each labor market group to test whether preferences for redistribution are determined by different factors as proposed in H2 and H3.
Contrary to the theoretical expectations expressed in H2, the positive impact from low-income and middle-income earners on preferences for redistribution is only observable for the formally employed (see Table 3). Being in the lower or middle-income category fuels formal workers’ demand for redistribution, supporting the Meltzer-Richard rationale (keeping high rates of income inequality in LAC in mind). However, even though informal workers are more likely to belong to lower income groups and to be exposed to greater need than formal workers, low or middle income is not a driver of their redistributive preferences as it is for formal sector workers. Both coefficients are not significant (M4).
In contrast, model 4 displays a positive education effect for redistributive preferences of informal workers. Higher levels of education fuel preferences for redistribution at the 1 percent level of significance among informal workers. A standard deviation increase of education raises preferences for redistribution by 0.09 units for informals. This finding is interesting, given that one would expect less-educated people to express greater demand for redistribution, since they are the ones more in need. One could argue that this finding supports H2, as higher levels of education symbolize higher earnings, so that better educated informals support redistribution in order to increase gains. However, investing in higher education is more risky for informal workers than for formals because the informals lack the legal means to enforce their rights, and therefore their investment does not necessarily pay back. Hence, investing in education also increases informal workers’ risk exposure, despite greater employability with higher levels of education; therefore, the positive education effect might reflect the insurance needs of these informals. The missing effect following from income levels and the positive education effect alludes to a long-term self-interest in terms of insurance for informal sector workers when education attainment is higher. The results for the micro-level findings are supported by the fixed-effects regression models (M7 and M8), which control for unobserved heterogeneity at the country level. Therefore, H2 cannot be supported regarding the expectations for informals.
Finally, left-wing ideology positively influences the redistributive preferences of the formally employed and does not affect informal workers. Religiosity has a robust negative effect on social policy preferences for informals, as Table 3 shows. Religiosity might be an indicator for stronger network ties and, thus, a hint toward the assumption that informal workers more strongly rely on social and family networks, and therefore turn less toward the state for welfare provision. However, this claim needs further empirical investigation.
Turning toward macro-level components, greater uncertainty at a context level does not, surprisingly, push informal workers to turn towards the state for increased redistribution (M4 Table 3). Therefore, H3 cannot be supported either. An economically risky environment, reflected by the unemployment rate, does not, on average, significantly influence redistributive preferences of informals. This finding is surprising given the risk-prone status of informals in the economy and the above-mentioned hint towards insurance needs when education is higher. Regarding the influence of welfare policies in place, we can detect a positive effect following from public expenditures on pensions as share of GDP, albeit only at the 10 percent level of significance. The more the state spends on public pensions, the higher the preferences for redistribution among informal workers. However, expenditures on public pensions include both contributory and non-contributory programs that either exclude or include informal workers; therefore, we cannot derive a clear explanation for this finding. Informals might become more supportive of redistribution as the state spends more on social protection programs that are non-contributory in nature. However, increased social assistance coverage – a measure that explicitly considers programs that are available for informals – does not significantly affect the informals’ preferences for redistribution. Further robustness tests (available as supplementary material) that take into account the Gini index, social security and health care expenditures, an alternative measure for pension coverage, trade openness and labor market regulations (severance pay) were added one at a time. These tests do not show significant effects and leave the main findings substantially unchanged (see Table B in the Appendix).
Discussion
The fact that we did not observe the expected effect according to income and risk exposure via increased unemployment for informals may be a consequence of several factors. Firstly, informal workers present a heterogeneous group involving voluntary and involuntary members who may have different interests when it comes to redistribution and the welfare state. The insider/outsider divide might only appear among a particular group of informal workers. A further disaggregation of data is needed, which is not feasible unless the appropriate individual level data is available. Second, we have so far lacked information about household composition. A household composed of informal and formal sector workers should lead to homogenized preferences, as a formal worker should have less polarized preferences toward an informally working spouse and vice versa. Third, an exaggerated demand for welfare provision and redistribution harms the welfare state in the long run. The likelihood that informals might be employed in the formal labor market in the future could explain why informal workers do not follow a utility maximizer rationale. Therefore, the temporal aspect also needs consideration. We also need panel data to analyze ‘swing’ workers, who frequently switch between formal and informal labor market, as such changes might also affect redistributive preferences. Fourth, as pointed out above, liberalization of the labor market and privatization of social services in the last two decades have undermined the privileged status of formal workers to some extent. The above analysis illustrates that interrupted employment histories are common for both formals and informals. Therefore, both insiders and outsiders have a relatively high need for welfare provision.
Conclusion
The Latin American working population cannot be treated as homogeneous entity and must be separated into its essential strata in order to analyze social policy preferences: formal (more secure) and informal (more vulnerable) employment. Taking into account the relationship between dualized labor markets and welfare systems of the OECD context, the present article has explored the extent to which labor market segmentation also leads to polarization of the two labor market groups with regard to distributive politics. However, in contrast to what we expected from the insider/outsider debate, informal and formal sector workers have similar redistributive preferences. While formal wage earners are influenced by a mixture of factors that are also common to political economy theories, such as economic self-interest and left-wing ideology, what matters for informal wage earners produces a different picture. Contrary to expectations, informals are not driven by short-term economic self-interested, reflected by income.
The study shows that informal workers are not exceptionally motivated by economic utility reasons that aim for pure short-term benefit accumulation. Education positively influences preferences for redistribution of informal workers. The positive finding could allude to the insurance needs of informals with higher levels of education, keeping in mind that informal workers have higher education costs because of their vulnerable status in the economy. More generally, however, a more risky environment does not particularly encourage greater welfare expectations of the informally employed. The fact that informal workers are not exceptional in turning toward the state for redistribution – that is, a lack of an insider/outsider divide on the issue of redistribution – is surprising, given the opportunities to benefit from public welfare goods and an increased trend to provide non-contributory welfare services by the state. The lack of polarization into an insider/outsider distinction might be a consequence of the porousness of formal employment and the declining ‘premium status’ of formals (see Barrientos 2009). But the puzzling finding might also indicate difficulties in identifying ‘real’ outsiders in the group of informals. The lack of strong income-related motives for social policy support by informal workers is a crucial aspect for party competition, analysis of socio-economic cleavage structures, and the design of social policies in LAC, especially since the classical class cleavage has been retreating in Latin America in recent decades (Roberts 2002). More fine-grained analysis is needed in order to tackle welfare expectations of informals, involving a disentangling of this very heterogeneous group that contains voluntary and involuntary ‘members’. Future research should observe preference formation over time that takes into account switches between formal and informal labor market and household composition to fully unpack long-term perspectives of formal and informal workers. Research should also look at the causes for entering the informal sector, as some of these reasons might be related to the poor performance of the state to provide an adequate welfare system.
Footnotes
Appendix
Robustness Test: Linear Hierarchical Varying Intercept Model: Preferences for Redistribution by Labor Market Group and further Macro Control Variables
| (M1) Formal | (M2) Informal | (M3) Formal | (M4) Informal | (M5) Formal | |
|---|---|---|---|---|---|
| Micro Predictors | |||||
| Low Income | 0.132 * (0.061) | 0.111 (0.086) | 0.133 * (0.061) | 0.109 (0.086) | 0.161 ** (0.059) |
| Middle Income (Ref: High Income) | 0.163 *** (0.036) | 0.021 (0.074) | 0.163 *** (0.034) | 0.022 (0.074) | 0.177 *** (0.038) |
| Education | -0.001 (0.014) | 0.089 ** (0.030) | -0.006 (0.015) | 0.088 ** (0.030) | 0.006 (0.015) |
| Female | 0.015 (0.027) | -0.057 (0.047) | 0.017 (0.026) | -0.052 (0.047) | 0.022 (0.029) |
| Age | 0.002 (0.027) | -0.003 (0.032) | -0.004 (0.027) | -0.003 (0.031) | 0.001 (0.029) |
| Children | 0.043 (0.027) | 0.036 + (0.022) | 0.050 + (0.026) | 0.037 + (0.022) | 0.045 (0.030) |
| Urban | -0.019 (0.047) | 0.029 (0.028) | -0.002 (0.048) | 0.027 (0.029) | 0.018 (0.041) |
| Religious | -0.026 (0.026) | -0.067 * (0.029) | -0.021 (0.026) | -0.066 * (0.029) | -0.036 (0.027) |
| Informed | -0.005 (0.062) | -0.011 (0.098) | 0.027 (0.058) | -0.010 (0.095) | 0.015 (0.058) |
| Ideological Position | |||||
| Left | 0.257 ** (0.093) | -0.005 (0.089) | 0.251 ** (0.090) | 0.000 (0.089) | 0.250 * (0.102) |
| Center (Ref: Right) | -0.059 (0.078) | -0.249 ** (0.090) | -0.069 (0.076) | -0.245 ** (0.089) | -0.072 (0.085) |
| Macro Predictors | |||||
| Labor Freedom | 0.117 (0.151) | 0.087 (0.138) | 0.172 (0.147) | 0.089 (0.138) | 0.021 (0.098) |
| Trade Openness | -0.123 (0.119) | -0.008 (0.072) | |||
| Public Pension Exp. as share of GDP | 0.084 (0.085) | 0.131 * (0.060) | 0.144 (0.089) | 0.149 + (0.081) | |
| Gini | 0.021 (0.059) | 0.008 (0.051) | |||
| Social Security (per capita) | – | 0.067 (0.076) | |||
| Health Care (per capita) | – | 0.085 (0.072) | |||
| Unemployment Rate | - | ||||
| - | |||||
| Severance Pay (after 1 year) | |||||
| - | |||||
| Pension Coverage | |||||
| Constant | 5.570 *** (0.140) | 5.788 *** (0.120) | 4.561 (2.897) | 5.386 * (2.516) | 5.659 *** (0.115) |
| Random Effects Parameters | |||||
| Var (Intercept) | 0.233 (0.143) | 0.153 (0.076) | 0.194 (0.088) | 0.148 (0.067) | 0.063 (0.028) |
| Var (Residual) | 2.147 (0.111) | 2.366 (0.119) | 2.136 (0.107) | 2.366 (0.119) | 2.036 (0.094) |
| N Level 1 | 10502 | 8560 | 10814 | 8578 | 9759 |
| N Level 2 | 21 | 21 | 22 | 22 | 17 |
| Wald Chi2 | 120.26 | 117.28 | 127.35 | 95.1 | 152.46 |
| Log-Likelihood | -17323.6 | -13414.0 | -17882.2 | -13445.0 | -15752.1 |
| BIC | 34804.6 | 26981.9 | 35922.3 | 27044.0 | 31651.1 |
| (M6) Informal | (M7) Formal | (M8) Informal | (M9) Formal | (M10) Informal | |
|---|---|---|---|---|---|
| Micro Predictors | |||||
| Low Income | 0.173 + (0.093) | 0.115 + (0.062) | 0.096 (0.085) | 0.162 ** (0.056) | 0.124 (0.089) |
| Middle Income (Ref: High Income) | 0.045 (0.088) | 0.157 *** (0.034) | 0.015 (0.075) | 0.177 *** (0.037) | 0.049 (0.080) |
| Education | 0.079 ** (0.028) | -0.002 (0.016) | 0.080 ** (0.031) | -0.002 (0.014) | 0.087 ** (0.030) |
| Female | -0.045 (0.049) | 0.021 (0.028) | -0.037 (0.052) | 0.022 (0.028) | -0.042 (0.048) |
| Age | -0.012 (0.035) | -0.002 (0.028) | -0.014 (0.031) | 0.006 (0.028) | 0.004 (0.031) |
| Children | 0.057 * (0.023) | 0.050 + (0.028) | 0.041 + (0.023) | 0.030 (0.027) | 0.035 + (0.020) |
| Urban | 0.045 (0.032) | 0.008 (0.047) | 0.048 * (0.025) | 0.006 (0.045) | 0.028 (0.027) |
| Religious | -0.060 * (0.029) | -0.024 (0.026) | -0.071 * (0.029) | -0.030 (0.027) | -0.051 + (0.028) |
| Informed | -0.071 (0.095) | 0.025 (0.059) | 0.000 (0.111) | 0.027 (0.059) | -0.024 (0.112) |
| Ideological Position | |||||
| Left | 0.043 (0.095) | 0.234 * (0.093) | -0.041 (0.081) | 0.228 * (0.097) | 0.003 (0.090) |
| Center (Ref: Right) | -0.242 * (0.099) | -0.078 (0.078) | -0.275 ** (0.089) | -0.076 (0.081) | -0.257 ** (0.095) |
| Macro Predictors | |||||
| Labor Freedom | -0.020 (0.104) | 0.171 (0.172) | 0.116 (0.164) | ||
| Trade Openness | - | ||||
| - | |||||
| Public Pension Exp. as share of GDP | - | 0.119 + (0.066) | 0.154 ** (0.054) | ||
| Gini | - | ||||
| Social Security (per capita) | 0.093 (0.111) | ||||
| Health Care (per capita) | 0.051 (0.114) | ||||
| Unemployment Rate | - | 0.074 (0.092) | 0.070 (0.108) | 0.099 (0.100) | 0.074 (0.144) |
| Severance Pay (after 1 year) | - | 0.077 (0.092) | 0.081 (0.097) | ||
| Pension Coverage | - | 0.022 | 0.029 | ||
| (0.080) | (0.071) | ||||
| Constant | 5.872 *** (0.121) | 5.670 *** (0.091) | 5.865 *** (0.100) | 5.640 *** (0.119) | 5.880 *** (0.110) |
| Random Effects Parameters | |||||
| Var (Intercept) | 0.074 (0.032) | 0.094 (0.043) | 0.089 (0.039) | 0.160 (0.114) | 0.125 (0.080) |
| Var (Residual) | 2.228 (0.107) | 2.116 (0.105) | 2.360 (0.126) | 2.071 (0.100) | 2.284 (0.116) |
| N Level 1 | 7683 | 9906 | 7254 | 10005 | 8121 |
| N Level 2 | 17 | 20 | 20 | 18 | 18 |
| Wald Chi2 | 258.07 | 138.17 | 136.92 | 157.6 | 1609.87 |
| Log-Likelihood | -11608.4 | -16937.4 | -12127.0 | -16269.6 | -12483.4 |
| BIC | 23359.9 | 34031.3 | 24405.2 | 32695.7 | 25119.9 |
Source: LAPOP 2008, 2010; World Bank WDI (2015); Heritage Foundation (2015); CEPAL (2012); Solt (2009) for Gini; Rofman, Lucchetti, and Ourens (2008) for pension coverage; World Bank (2013) for severance pay after 1 year.
Note: In Model 7 and 8, severance pay is used instead of labor freedom as alternative indicator for labor market rigidity and Model 9 and 10 test an alternative indicator for social security (pension coverage by Rofman, Lucchetti, and Ourens (2008)).
p<0.10
p<0.05,
p<0.01,
p<0.001.