
Abstract
Purpose:
The conditions leading to growth rebound after hemiepiphysiodesis are still poorly understood. This article analyzes the radiographical outcomes after guided growth with tension band plating, using plates in idiopathic genu valgum patients and attempts to generate a predictive model of growth rebound.
Methods:
Patients with idiopathic genu valgum deformity who received tension band plating were selected for evaluation. We only analyzed coronal plane deformities. Only patients with a long-standing X-ray before tension band plating surgery, a long-standing X-ray at tension band plating removal, and a long-standing X-ray at the latest follow-up after tension band plating removal were considered for this study. The change of mechanical axis deviation between the tension band plating removal and the last follow-up was evaluated for rebound, and ordinal logistic regression was performed to determine the relevant variables for predictive modeling rebound growth.
Results:
Overall, 100 patients (189 legs) were analyzed. The mean mechanical axis deviation at tension band plating removal was 8.4 mm in varus direction, and the mean mechanical axis deviation at the last follow-up was −3.4 mm (p ≤ 0.001). However, 111 legs (59%) showed rebound growth, 57 (30%) stayed stable, and 21 (11%) showed a continuous correction. Six significant factors significantly influencing rebound were isolated which are clinically relevant: sex, age, baseline mechanical axis deviation, mechanical lateral distal femoral angle, and mechanical medial proximal tibial angle, and mechanical axis deviation correction rate. Mechanical axis deviation correction rate had the highest odds ratios. The machine learning classification model for predicting rebound growth built from the study data showed a misclassification rate of 39%.
Conclusion:
There was a high rate of rebound growth in this cohort, especially for patients at a young age at implantation. The highest risk factors for rebound growth were male sex, and high correction rates, such as found during peak growth spurt. The proposed classification model needs more data to improve its predictive power before it can be used in clinics.
Level of evidence:
Level III.
Purpose
Axis deformities of the lower limbs are a very common clinical picture in children. Pathologic genu valgum (bowleg) is defined by an intermalleolar distance of more than 7 cm. 1 It is the result of an imbalance growth rate in the epiphyseal plate. The underlying causes are not always identified, but factors such as injuries, infections, and specific drugs can contribute to unbalanced growth.2,3 Unevenly distributed loads found in malaligned legs can lead to premature degenerative changes, such as osteoarthritis. 1
Correction of pathological leg axes aims to straighten mechanical leg axis and even loads within the joint. Corrective osteotomy is the classic solution in adults; 4 however, it has disadvantages such as long immobilization, hospitalization, and pain. In adolescents, guided growth is preferred since it is less invasive. In guided growth, one side of the growth plate is temporarily constrained to limit its growth rate while the other side continues to develop, thus balancing the mechanical axis.
At present, four guided growth techniques are mainly used: the open epiphysiodesis by Phemister, which is permanent; stapling by Blount; transphyseal screws by Metaizeau; and the tension band plating (TBP) by Stevens, 5 which we use in our clinic with a two-hole non-locking plate and two screws. It offers the same safety and low complication rates as stapling but without the drawbacks such as breakage, extrusion, and difficult tissue-damaging removal. 6
The tissue response to guided growth is not immediate, and leaving the implant for the ideal duration is crucial to avoid under- or overcorrection. Determining the ideal duration is complicated by a phenomenon known as rebound growth, where growth resumes after metal removal, either immediately or later on.7,8 Rebound growth believed to be caused by overstimulation of the compressed growth plate side, varies in incidence and intensity. 9 It may lead to a recurrence of angular deformity, even up to the original deformity. Rebound growth lacks a consensus definition, with Kang, Ramazanov, and Rae Ko defining it as a recurrence of joint orientation angles by 3–5°,9 –11 while Farr et al. 7 defined it as a change of mechanical axis deviation (MAD) of 3 mm or more toward the original deformation.
No treatment exists to prevent rebound growth, so anticipating rebound growth, some surgeons remove the TBP only after overcorrecting the leg.4,6 This empirical approach has limited data and no guidelines, and overcorrection should be approached with caution, as a deviation of 10° from the ideal mechanical axis can cause prearthrotic deformity, anterior knee pain, and instability. 12 In addition, if anticipated rebound growth does not occur, the overcorrection will remain. Radiological monitoring is necessary to estimate the optimal TBP removal time, but radiation dose limits monitoring frequency. Due to limited information, a universal algorithm for determining the ideal implant duration is still absent from the literature. Further understanding of rebound dynamics and predisposing factors is needed to improve decision-making in guided growth procedures. This retrospective study aims to identify factors associated with rebound growth and develop a clinically useful predictive model.
Methods
Patients screening, inclusion, and exclusion
This is a radiographic, single-center retrospective study. Ethical approval of the study protocol and a waiver of informed consent were granted by the Cantonal Ethics Commission (2022-01237). Adolescents with a pathologic genu valgum leg axis deformity requiring correction who received one or more TBP (Tifix barbell plate 2204026T and 2204028T, Litos, Germany) between January 2007 and December 2018 at our institution were considered for the study. Both unilateral and bilateral cases were included. Patients were eligible if they had at least one preoperative X-ray, at least one post-operative X-ray with the plate(s), and at least one X-ray after hardware removal. They were excluded if they refused the general consent for further use of data for research; the hemiepiphyseal material was not plates (staples, etc.); they had abnormal anatomy (bone deformities); they had additional synthetic material; in case of a closed physis; or if the quality of the X-ray was too poor for quantitative measurements. The cases were reviewed in random order until 100 cases were complete.
Data collection
Data were collected and managed using Research Electronic Data Capture (REDCap). 13 The following patient parameters were retrieved from the clinical information system (CIS): height, weight, gender, age at implantation, age at screw removal, location of the plates (femoral or tibial), and complications at and after surgery.
Radiographic data were measured in all available long-standing anteroposterior full-length radiographs (Figure 1). First, the following landmarks were defined manually in the Picture Archiving and Communications System client JiveX (VISUS Health IT GmbH, Germany, JiveX Diagnostic 5.3.0.7): the middle point of the proximal tibia, the middle point of the distal femur, the center of the femoral head, center of the ankle joint, then the bone axes, and mechanical axes. From these landmarks, the following parameters were measured: mechanical axis length (MAL, mm), proximal tibia width (PTW, mm), mechanical lateral distal femoral angle (mLDFA, °), mechanical medial proximal tibial angle (mMPTA, °), MAD (mm), and screw deviation angle (SDA, °). Based on the study of Farr et al., 7 a change of MAD after plate removal superior or equal to 3 mm in the reverse direction from the correction was defined as rebound growth.
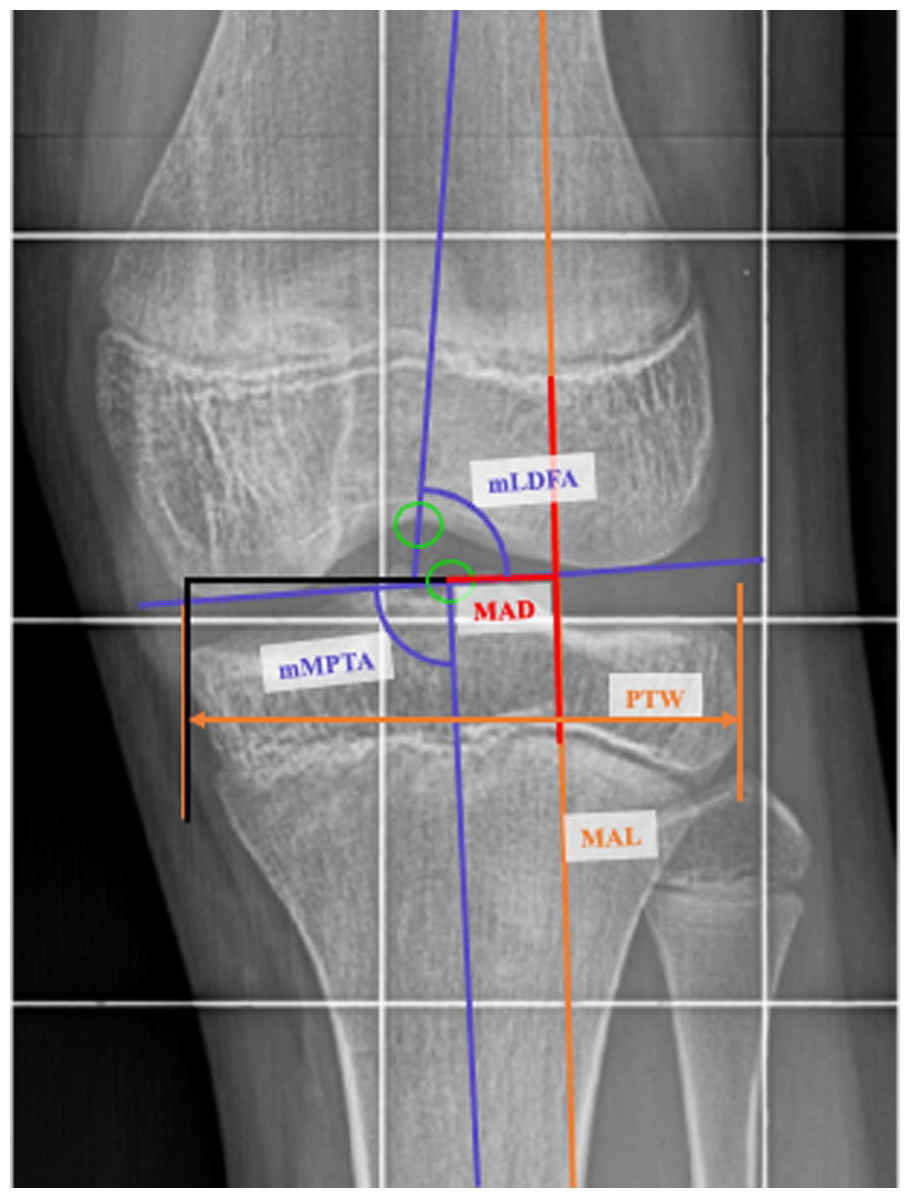
Radiographic measurements. First the landmarks were defined (middle point of the proximal tibia, middle point of the distal femur, center of the femoral head, center of the ankle joint). From the MAL (mm); PTW (mm); mLDFA (°); mMPTA (°); MAD (mm); SDA (°) were measured.
Analysis
All statistical analyses were carried out using R 14 and the packages lme4, MASS, ipred, gtsummary, and e1071.15 –18 For the evaluation of the measurement protocol reproducibility, three operators from the research group measured the same 15 radiographs, and one operator measured the same radiographs twice. Intra- and inter-observer reliabilities were evaluated using the intraclass correlation coefficient (ICC) (3,1) as a reliability parameter for repeated measurements of continuous variables.19,20 Our results indicate a small measurement error (coefficient value 1.93 mm) and high reproducibility (ICC values 0.98 for intra- and 0.95 for interrater reliability).
Next, we evaluated the measurement accuracy for the parameter MAD as the standard error of measurement (SEM) using the formula
The knee joint mechanical axis was categorized into three zones according to Madoki et al.: 21 the first zone is from the center of the knee ± 25% of the tibia width; the second zone is the outer 25% of the tibia width on each side of Zone 1, and the third zone is everything outside the tibia width. A knee is considered aligned if the mechanical axis goes through the first zone, so that forces are physiologically distributed in the joint. In our clinic, an additional indication for the correction was a MAD deviation of more than 10–15 mm from the middle of the knee joint, so some patients were treated even if their mechanical axis was in the first zone.
Linear mixed-effect regression (lmer) modeling was used to evaluate the associations between baseline demographics, anatomy, and post-removal rebound growth value. Lmer was chosen to account for repeated measurements in bilaterally operated patients. The models were evaluated once with only baseline data, representing the pre-treatment clinical situation, and then with baseline and data at removal, representing the situation during treatment. The pre-treatment models included leg alignment angles, and demographics (age at implantation, sex, and BMI) as covariates. The during treatment models included additionally the treatment details (number and location of plates) and the rates of change of the radiographic variables. The implant duration was not included in the models; since clinically it depends on the expected outcomes, it is also why the rates of change were deemed as more appropriate. Clinically relevant factors were investigated with stepwise backward elimination, and p-values of less than 0.05 were considered statistically significant. The statistically significant variables identified in the lmer models were used in ordinal logistic regression analysis to test them as predictors for the ordinal outcome of correction (rebound, stable, and continuous). In addition, the odds ratios with 95% confidence intervals were calculated from the ordinal logistic regression as the exponential from the models’ coefficients to determine the influence of each parameter individually. Only BMI data were missing for some patients. We used the default listwise deletion approach for handling it.
For the predictive model, the dataset was randomly divided into 80% training data and 20% validation data, and a prediction model was built using a bootstrap aggregating (bagging) with 150 classification trees with all the significant influential factors from the regression models, with the training dataset. Using a single decision tree tends to suffer from high variance, while bootstraping uses multiple individual decision trees and aggregates them into model with much lower test error rate.22,23 Once the model was fitted, we used the validation dataset to assess its performance by measuring the misclassification error rate. Finally, the importance of each variable for the aggregated tree model was quantified using the mean decrease in impurity method. 24
Results
Cohort demographics
In total, 452 patients were identified (1046 treated growth plates) who matched the possible inclusion/exclusion criteria (Figure 2). Of those 452 patients, 201 cases were reviewed, and 101 were excluded until the study cohort finally consisted of 100 patients (49 male and 51 female), with mean age at implantation of 12.87 years (min: 9.45, max. 16.2) (Table 1). However, 89 patients underwent bilateral TBP, meaning a total of 189 legs were included, all with valgus malalignments (Table 1). Out of the 100 patients, 9 had adverse events: 4 patients reported pain at the implant location which disappeared with time and 5 patients suffered a broken screw (two during removal), which was not extracted. Patients with broken screws were not followed up specifically because they did not report any problems. These 9 patients were included in the study.
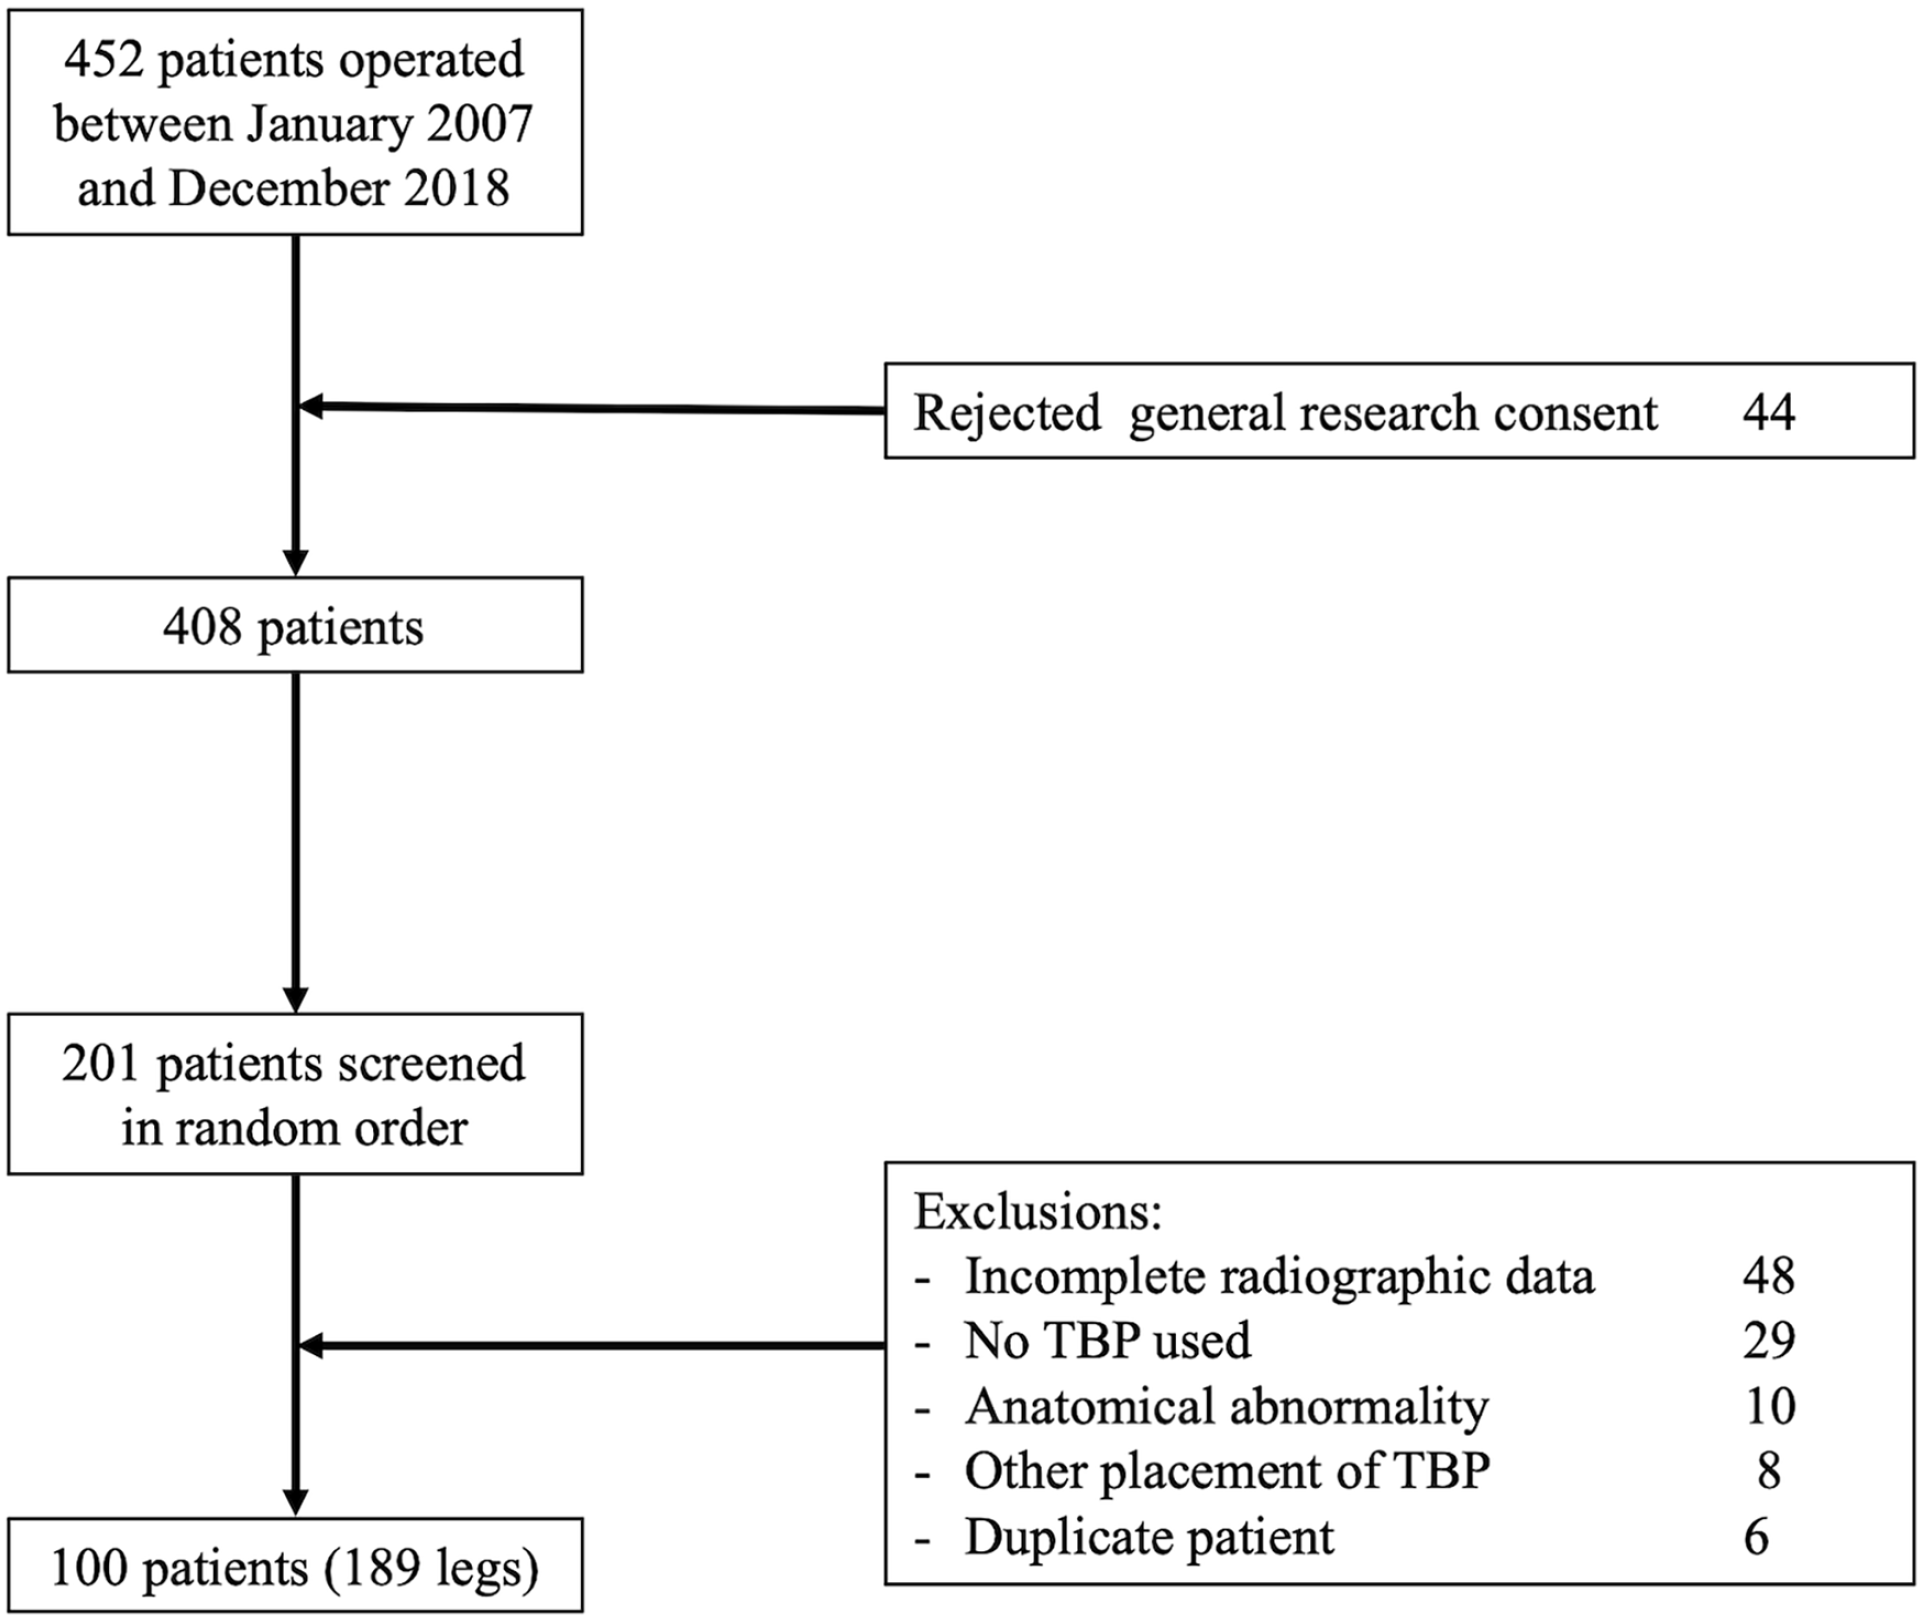
Inclusion/exclusion flowchart. A total of 452 patients were identified, and they were reviewed in a random order until 100 patients were complete.
Baseline cohort demographics overall and by sex, by patient, or by leg, as appropriate.
N; n (%); M (SD).
Pearson’s chi-square test; Welch two-sample t-test.
N; n (%).
Pearson’s chi-square test.
Evolution of radiographic parameters
There were significant changes in MAL, MAD, mLDFA, and mMPTA between the TBP implantation and TBP removal, and between TBP removal and the last follow-up after removal (p < 0.001) (Table 2). On average, after TBP removal, there was a significant change in the MAD in this cohort. Frequencies for the outcome of correction were 111 legs (59%) with rebound growth, 57 legs (30%) were stable, and 21 legs (11%) with continuous correction after removal.
Evolution of variables by timepoints, at implantation, removal, and last follow-up (FUP).
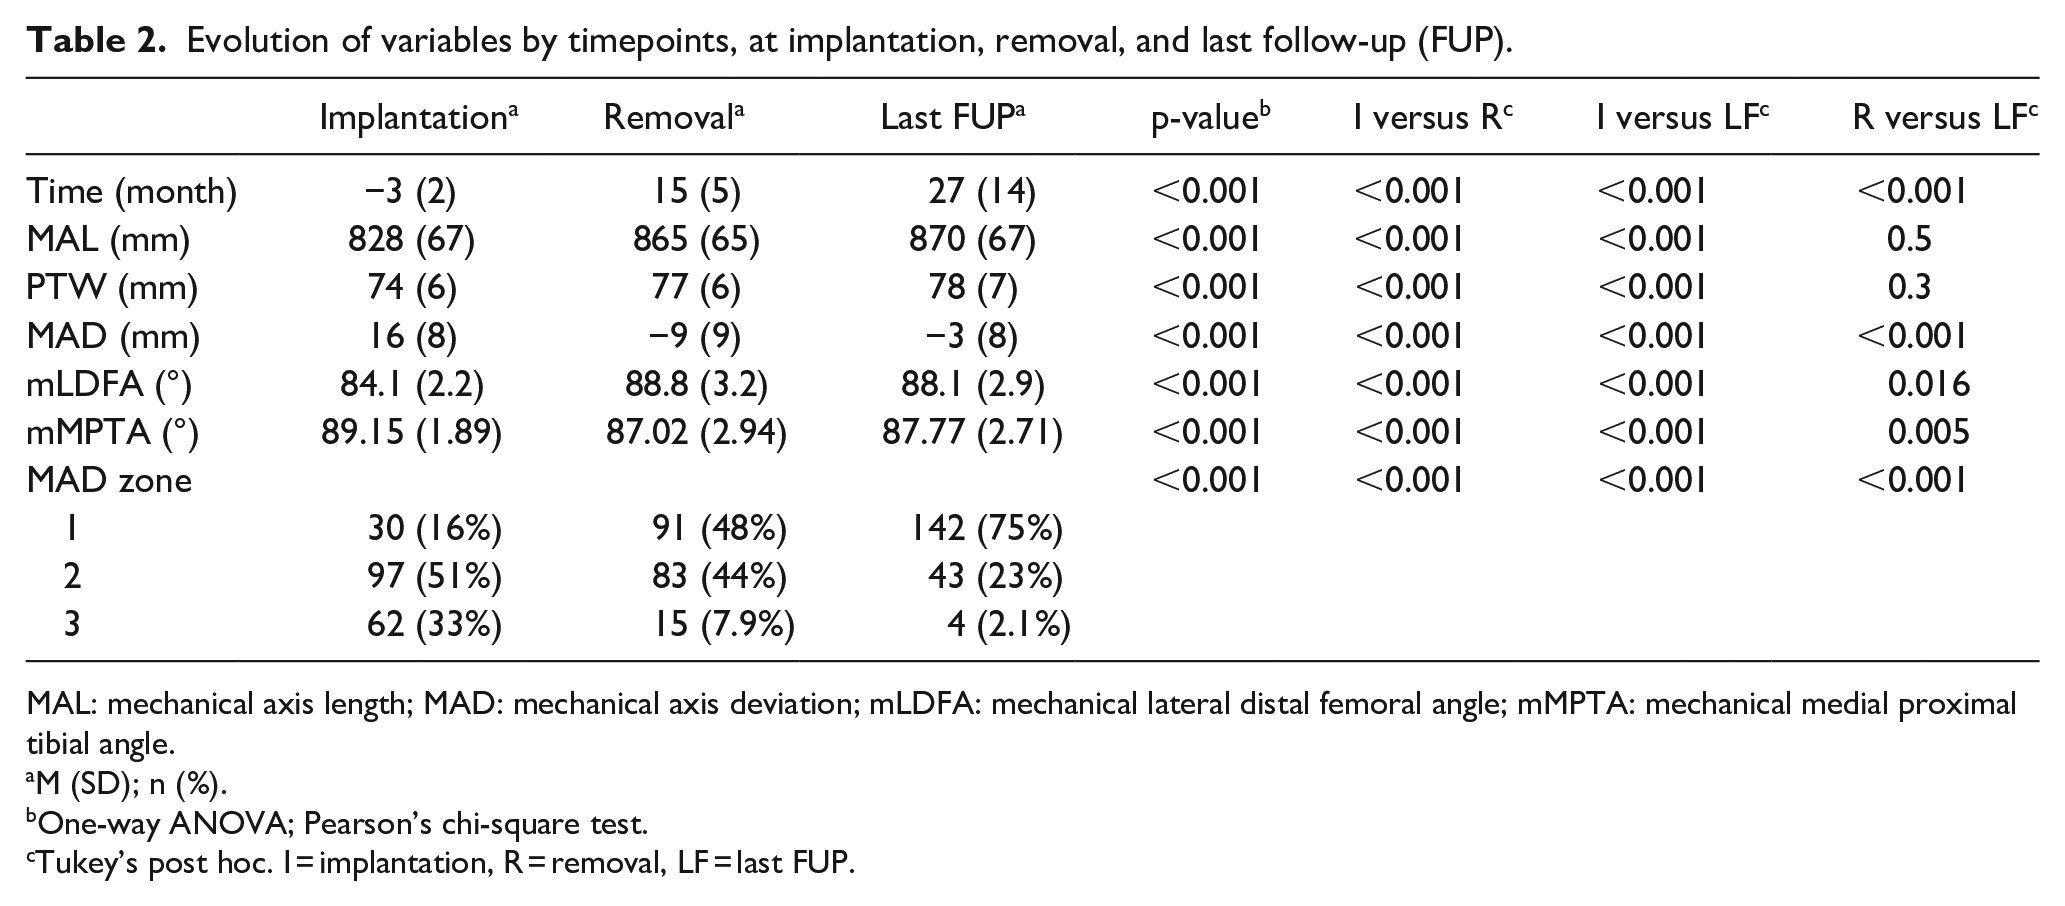
MAL: mechanical axis length; MAD: mechanical axis deviation; mLDFA: mechanical lateral distal femoral angle; mMPTA: mechanical medial proximal tibial angle.
M (SD); n (%).
One-way ANOVA; Pearson’s chi-square test.
Tukey’s post hoc. I = implantation, R = removal, LF = last FUP.
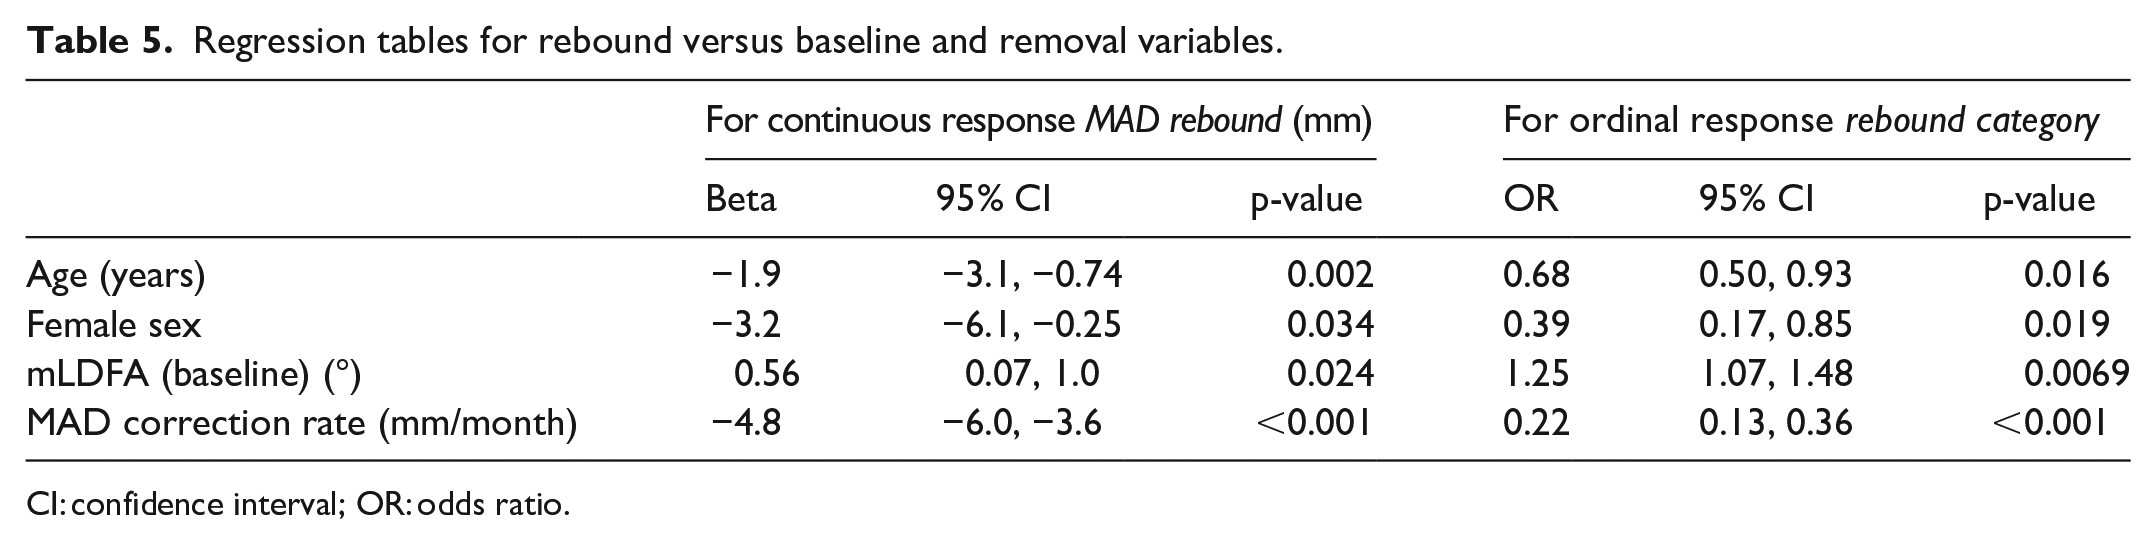
Differences between outcome groups
Each knee was categorized as “stable,” “rebound” or “continued” growth based on the change of MAD between the removal and last follow-up (Figure 3). There were no demographic or anatomical differences between these groups at baseline, but at removal, the MAL and MAD change rates and SDA angles and SDA change rates were significantly different between groups (Table 3).
OR for rebound, stable, or continued growth relative to implant duration, MAD correction rate, and BMI.
Comparison of variables between stable, continue, and rebound groups.
MAL: mechanical axis length; MAD: mechanical axis deviation; mLDFA: mechanical lateral distal femoral angle; mMPTA: mechanical medial proximal tibial angle; SDA: screw deviation angle.
N; n (%); M (SD).
Pearson’s chi-square test; one-way ANOVA; Fisher’s exact test.
Tukey’s post hoc tests. C = continue, S = stable, R = rebound.
Regression models
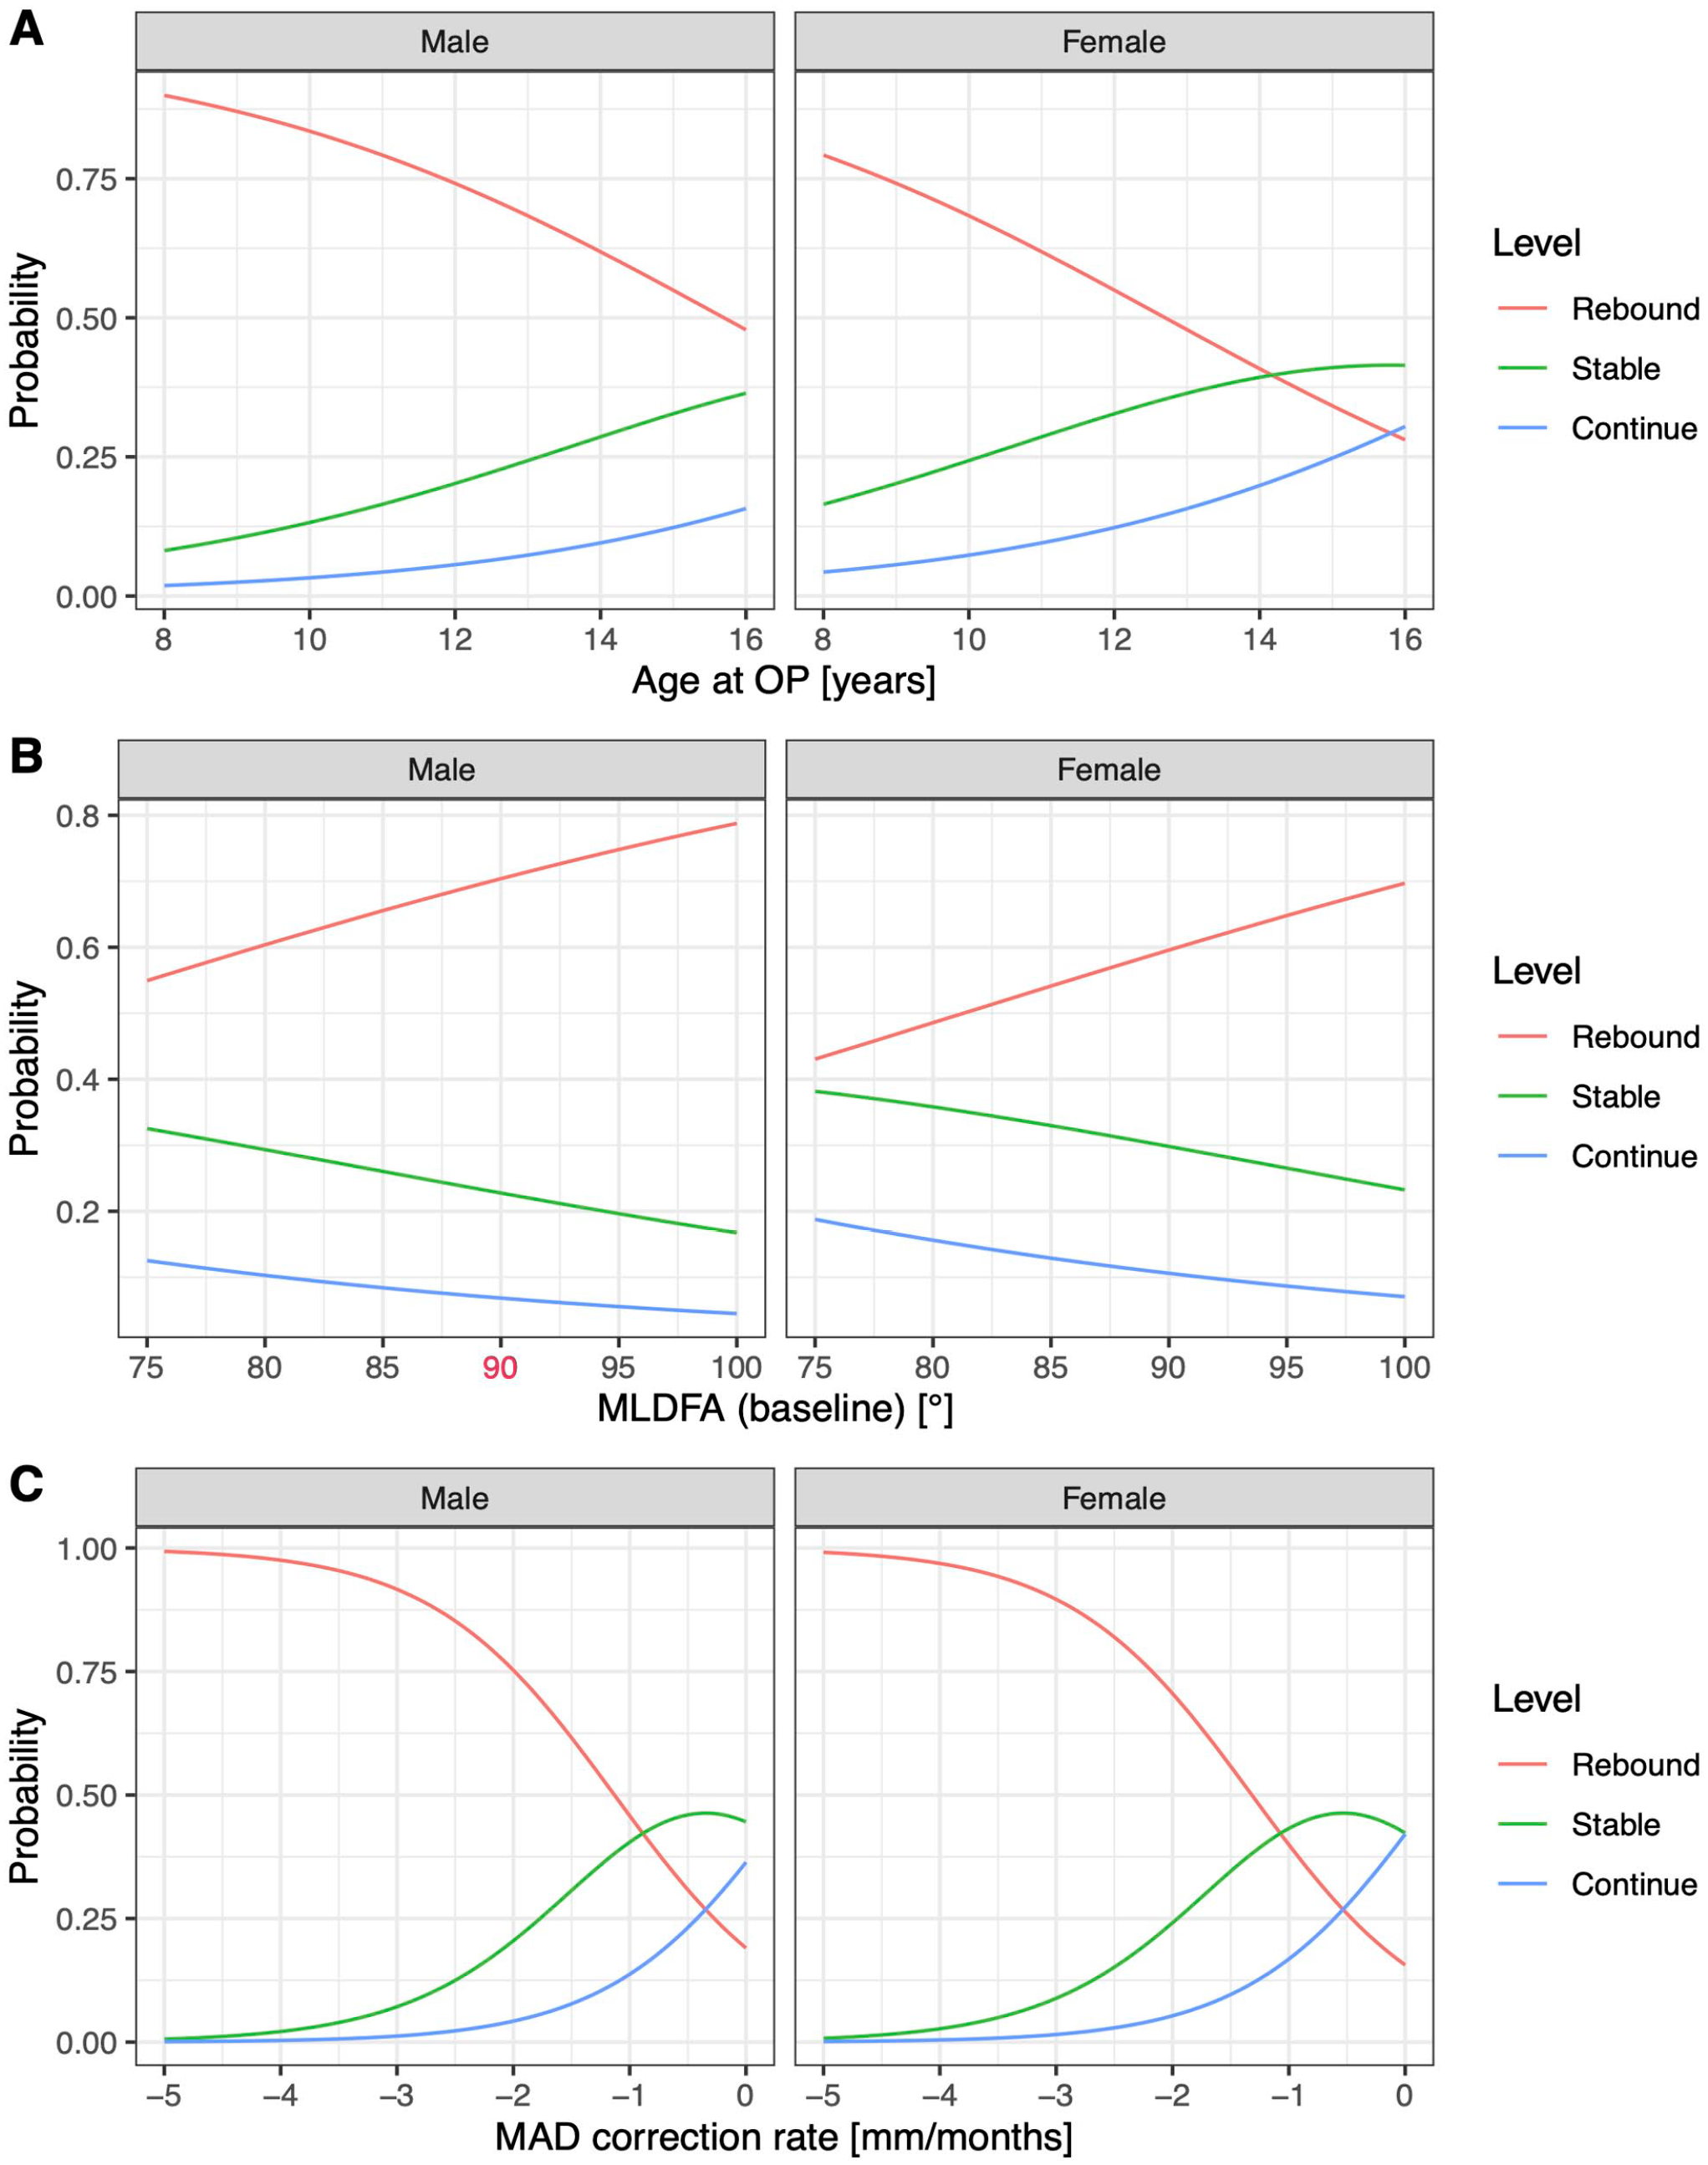
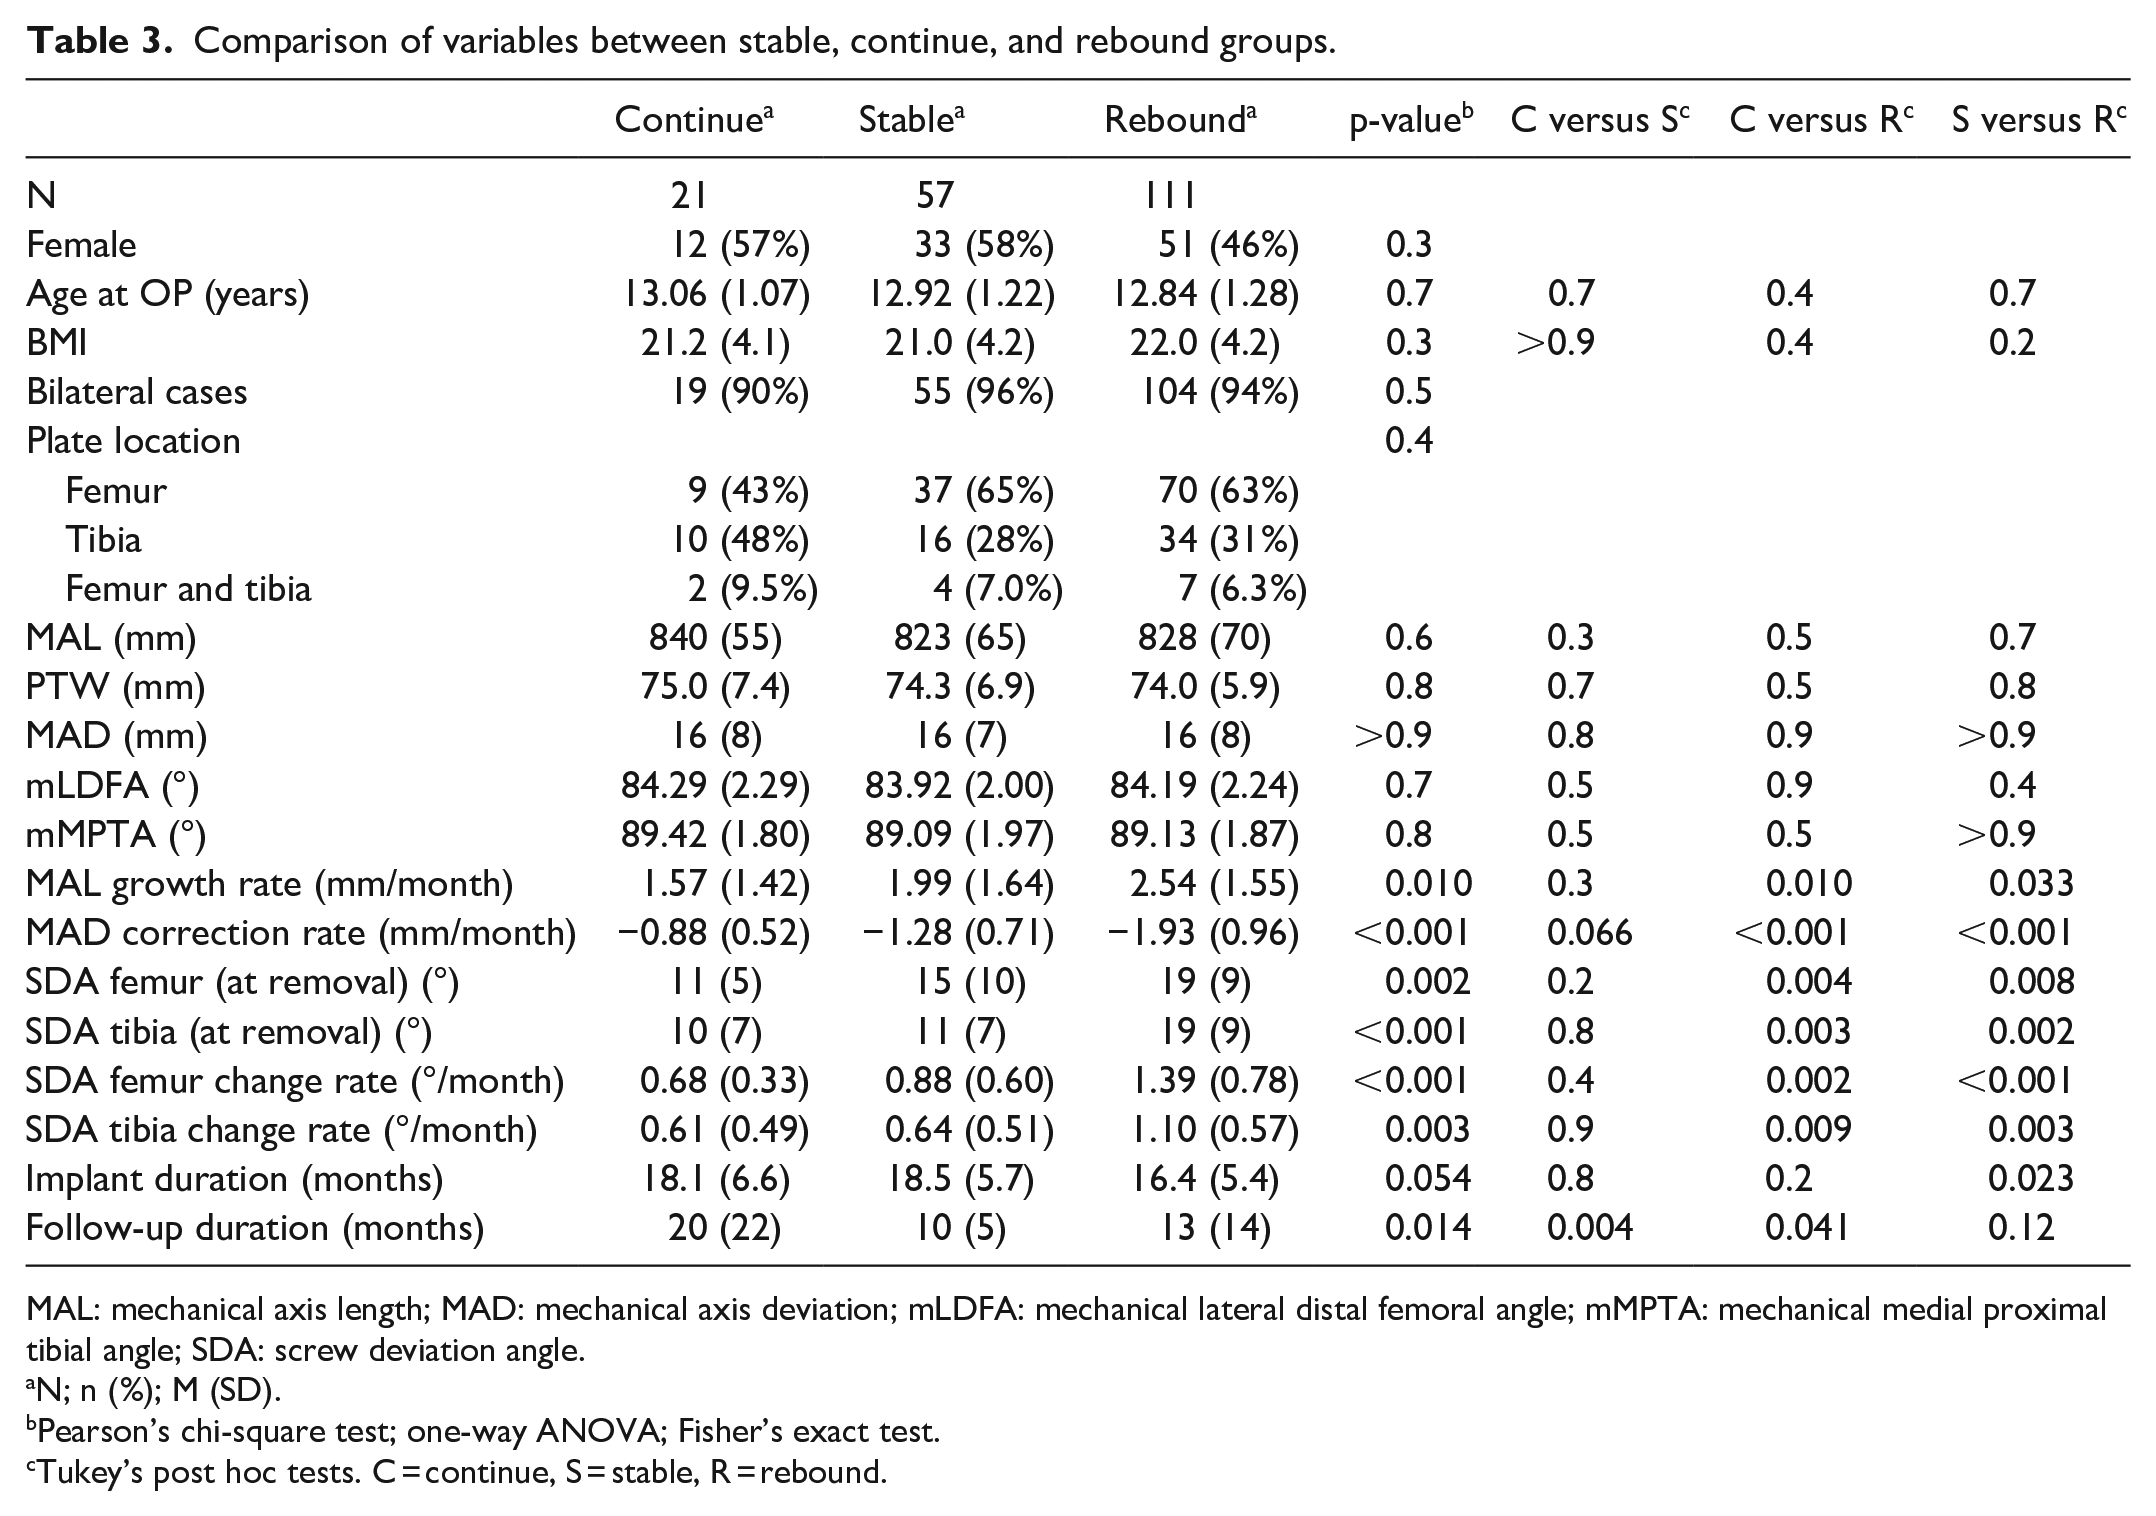
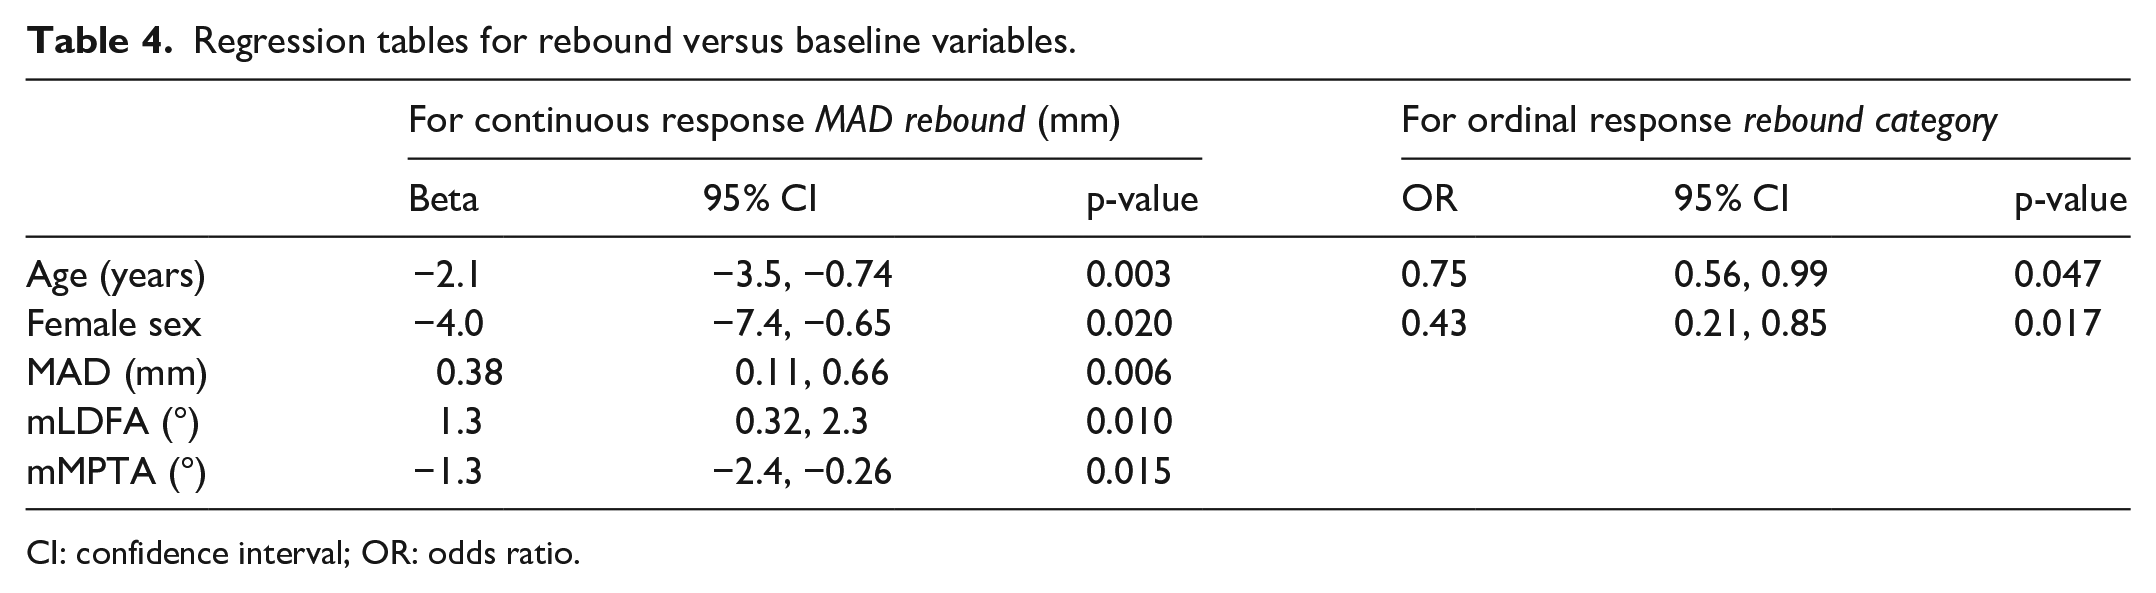
For the pre-treatment clinical situation, lmer modeling of the post-removal growth with baseline demographics showed significance of age, sex, MAD, mLDFA, and mMPTA, but in the ordinal regression model, only age and sex were significant (Table 4). Once adding data obtained at removal for the within-treatment situation, age at operation, sex, mLDFA at baseline, and MAD correction rate were the significant factors of both the continuous and ordinal models (Table 5).
Regression tables for rebound versus baseline variables.
CI: confidence interval; OR: odds ratio.
Regression tables for rebound versus baseline and removal variables.
CI: confidence interval; OR: odds ratio.
Bootstrap aggregation prediction model
The bagged prediction model was performed with 150 trees. First with the five significant variables from baseline, the prediction accuracy was only 50% on validation data (misclassification of 50%). Then with the significant variables from baseline and removal, the precision increased, as misclassification decreased to 39%. In addition, the importance of each variable for the aggregated tree model was quantified, and MAD correction rate was the most important predictor, while sex was the least important (Figure 4).
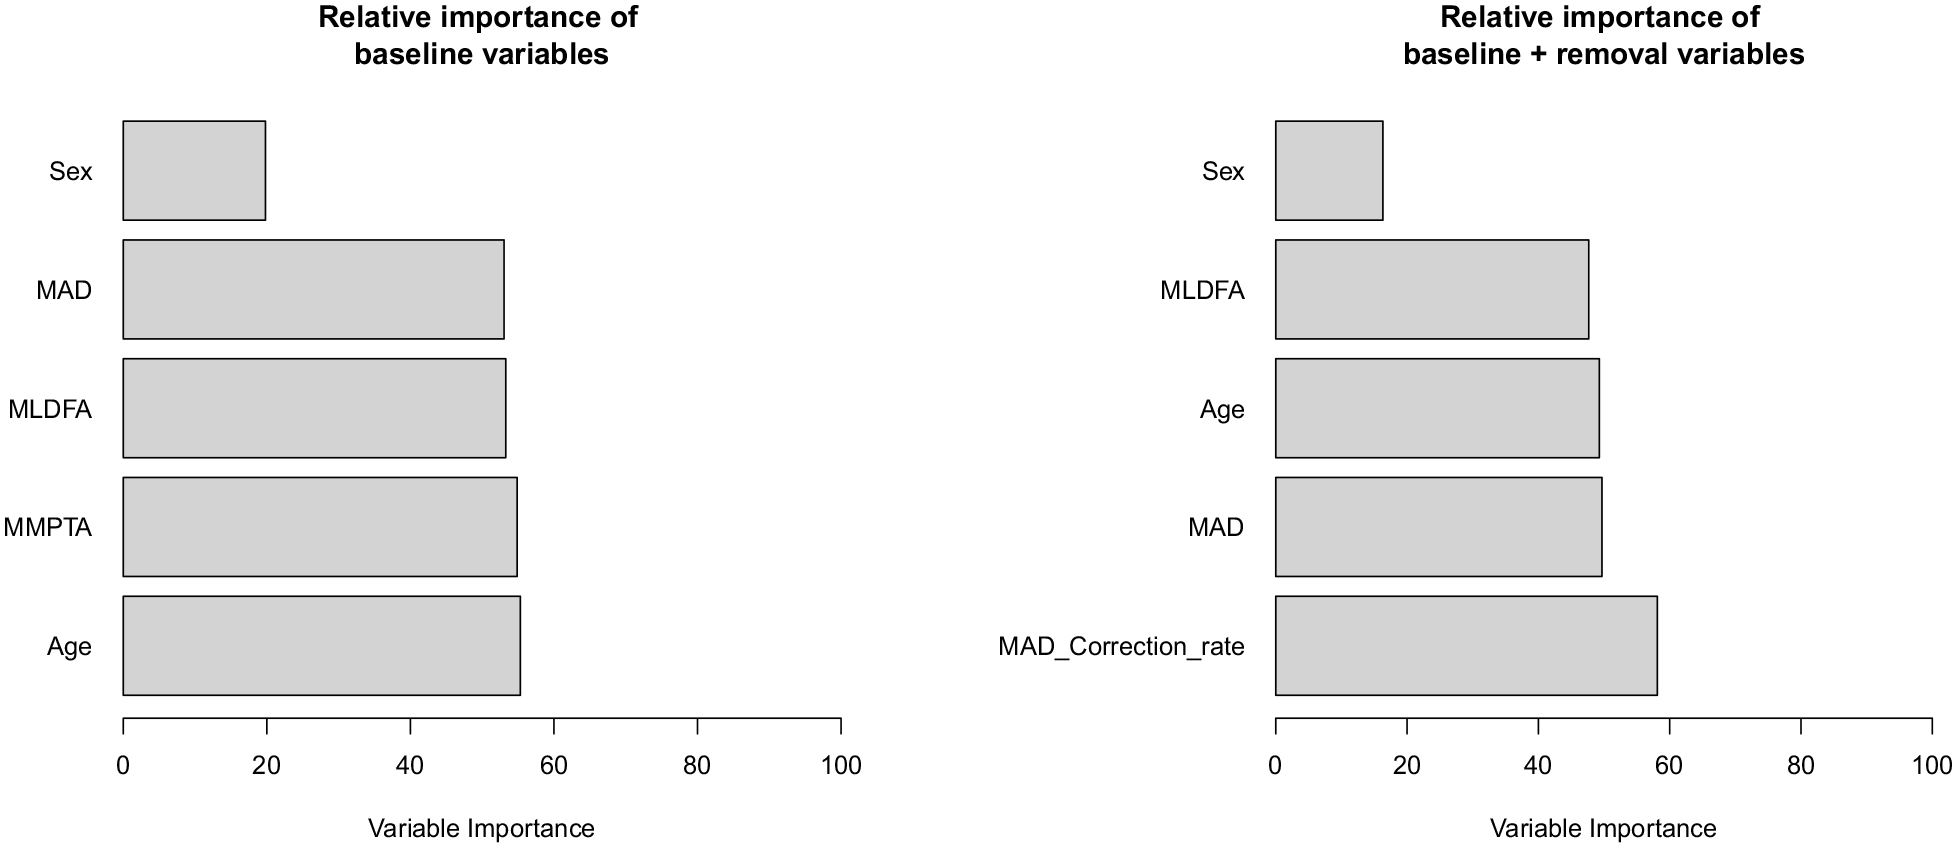
Relative importance of each variable in the bagged prediction model calculated from the total reduction in residual sum of squares (RSS), averaged overall trees. The larger the value, the more important the predictor. Together these variables explained about 46% of the variance.
Discussion
Rebound growth after guided growth is a well-known problem, but the causes are still largely unclear. The aim of this study was to identify the significant influencing factors associated with rebound growth after correction of coronal axis deformity using tension band plates. After the inclusion/exclusion criteria, we analyzed only the first 100 patients.
Using regression analysis, we found multiple factors that were predictive for rebound growth. These factors were sex, age at implantation, MAL at implantation, mLDFA, mMPTA, and MAD correction rate. Using a bootstrap aggregating decision tree model, the most important factor for predicting rebound growth was MAD correction rate. A faster correction per month suggests a more active growth plate and could lead to rebound growth because the initial unequal growth potential of the growth plate is still available. It is interesting to compare this result with the work of Choi et al. 25 who have identified the angle correction rates of mMPTA and mLDFA as the most significant influencer of mMPTA and mLDFA rebounds. We performed a sub-analysis of tibias and femurs independently and found the same result (supplementary material).
Age at operation was also identified in our models. The younger a patient was at implantation, the higher is the chances for rebound growth. This is consistent with the reports of Ballal et al. 26 and Choi et al., 25 who identified young age at plate insertion as a possible risk factor for rebound.
Another important aspect is the implant duration. Other studies report that short implant duration leads to rebound while longer implant duration results in stable growth.27,28 We have not used implant duration in our models since it cannot be considered an independent variable in a retrospective study where implant duration was personalized based on suspicion of possible rebound.
Farr et al. 7 found a 12% increase in rebound risk per kg/m2 increased BMI, whereas our results show no effect. A possible explanation for the difference could be the different study population, with a BMI of 21 ± 4 in our cohort versus 24 ± 4 in theirs. A higher BMI predicts a bigger growth spurt and could lead to more rebound growth. It also indicates increased levels of adipose tissue and leads to elevated insulin levels of factor 1 (IGF-1). IGF-1 is linked to the growth hormone (GH), which together with sex hormones is responsible for the growth spurt during puberty. 29
Concerning the impact of sex on rebound growth, the literature is ambiguous; Ramazanov et al. 10 and Schagemann et al. 30 found no influence on the risk of rebound, while we identified a higher risk for males. This might be due to the different definitions of the rebound. The longer duration of the pubertal growth spurt and higher growth velocity in boys compared to girls could explain why boys have a higher potential for rebound in our study. 31
There is great variability in the number of rebound cases in the literature. For example, Dai et al. 32 diagnosed rebound in only 3% of their cases, while Ramazanov et al. 10 reported up to 56% of rebound cases. These inhomogeneous findings probably reflect the difficulty to define rebound based on joint angles. Here we chose MAD as the defining variable for rebound growth. Farr et al. 7 also opted for a definition based on MAD (≥ 3 mm) and diagnosed rebound growth in about two-third of their cases, similar to our findings of 60%. It is noteworthy that 40% of the patients with bilateral treatments experienced disparate outcomes in their left and right legs, suggesting that other factors beyond the patients’ own characteristics may play a significant role in explaining the variability observed.
The predicting model for rebound growth built from the study data showed a misclassification rate of 39%. However, due to the limited cohort size, the model’s performance cannot be optimized through hyperparameter fine-tuning. The proposed classification model needs more data to improve its predictive power before it can be used in clinics. The necessary sample size for training such a model depends on various factors, including model complexity, number of predictor variables, data variability, and desired accuracy level.
We focused on valgus cases due to the low incidence of varus deformities in our patient population. We only analyzed the coronal plane deformities as sagittal, torsional, and translational deformities are not the focus of this article. Furthermore, we excluded patients with abnormal anatomy and additional synthetic material. Another limitation is the retrospective study design: intervals between X-rays were not standardized, as follow-up protocols vary individually in our clinic. The differences in intervals reflect that rebound was anticipated during the treatment of some patients. Other possible influencing factors that we did not include are bone age, which is not routinely determined in our clinic, and remaining growth, which was used by others but is difficult to estimate without additional information like the previous growth curve, bone age, and parental height. However, since our derived regression models include age and sex, they implicitly include a rough Menelaus estimate of remaining growth. 33 Nevertheless, the accuracy of this study must be verified with a prospective study.
Conclusion
The goal of the study was to isolate factors that can lead to rebound growth and use a model to predict how high the risk for rebound growth is at a given point in time. Our data show that the younger patients are at hemiepiphysiodesis, the more likely they will suffer from rebound growth. Sex is also an influencing factor, as boys have a higher risk of rebound growth than girls. A high correction rate leads to a higher risk of rebound, almost 100% when higher than 3 mm/month. Finally, we introduced the continued correction as a potentially adverse outcome of hemiepiphysiodesis to consider.
Supplemental Material
sj-docx-1-cho-10.1177_18632521231182432 – Supplemental material for Isolating factors for the prediction of rebound after guided growth with tension band plating for the valgus deformity of the knee
Supplemental material, sj-docx-1-cho-10.1177_18632521231182432 for Isolating factors for the prediction of rebound after guided growth with tension band plating for the valgus deformity of the knee by Alexander Eberle, Anika Stephan, Matthias P Tedeus, Hans M Manner, Hannes A Rüdiger and Vincent A Stadelmann in Journal of Children’s Orthopaedics
Supplemental Material
sj-pdf-2-cho-10.1177_18632521231182432 – Supplemental material for Isolating factors for the prediction of rebound after guided growth with tension band plating for the valgus deformity of the knee
Supplemental material, sj-pdf-2-cho-10.1177_18632521231182432 for Isolating factors for the prediction of rebound after guided growth with tension band plating for the valgus deformity of the knee by Alexander Eberle, Anika Stephan, Matthias P Tedeus, Hans M Manner, Hannes A Rüdiger and Vincent A Stadelmann in Journal of Children’s Orthopaedics
Footnotes
Author contributions
H.M.M. was the initiator of the study. H.M.M., M.P.T., and V.A.S. were involved in the study design. A.E., A.S., and V.A.S conducted data collection, data analysis and prepared the article. A.E., M.P.T., H.M.M., and V.A.S. performed data interpretation. All authors have revised and approved the final manuscript.
Declaration of conflicting interests
The author(s) declared no potential conflicts of interest with respect to the research, authorship, and/or publication of this article.
Ethical approval
Ethical approval of the study protocol and a waiver of informed consent were obtained from the Local Ethics Commission.
Funding
The author(s) disclosed receipt of the following financial support for the research, authorship, and/or publication of this article: Support for this research was provided by Schulthess Klinik.
Informed consent
The need for a written informed consent was waived for this study by the local ethics committee.
Research involving human participants and animals
All procedures performed in studies involving human participants were in accordance with the ethical standards of the institutional and national research committee and with the 1964 Helsinki declaration and its later amendments or comparable ethical standards.
Supplemental material
Supplemental material for this article is available online.
References
Supplementary Material
Please find the following supplemental material available below.
For Open Access articles published under a Creative Commons License, all supplemental material carries the same license as the article it is associated with.
For non-Open Access articles published, all supplemental material carries a non-exclusive license, and permission requests for re-use of supplemental material or any part of supplemental material shall be sent directly to the copyright owner as specified in the copyright notice associated with the article.