
Abstract
Titanium dioxide (TiO2) exhibits dielectric properties that vary significantly with its physical morphology and thermal history. This work evaluates the dielectric responses of calcined nanopowder, electrospun nanofibers before and after heat treatment. Utilizing TEM, SEM, EDX, FTIR, and XRD allows for a detailed assessment of the morphological, and structure differences across the TiO2 samples. The uncalcined nanofibers exhibit an amorphous structure with significant polyvinylpyrrolidone (PVP) content. Calcination transforms these amorphous precursors into crystalline fibers with a mixed anatase and rutile phase. Dielectric measurements carried out over a frequency range of 1 Hz to 1 MHz demonstrated that the calcined nanofibers feature a dielectric constant (ε′) that is both reduced and mostly stable across the measured frequency range. At higher frequencies, the dielectric constant was found to approach free-space permittivity, with the material additionally exhibiting low dielectric loss (ε″, tan δ), and reduced low AC conductivity (σ). The calcined TiO2 nanopowders, and uncalcined fibers by contrast revealed higher ε′ values and more substantial losses. The calcined TiO2 nanofibers thus exhibit superior insulating characteristics, demonstrating that nanostructuring combined with controlled thermal treatment can be effectively employed to alter dielectric performance. These findings carry meaningful implications for designing dielectric materials, particularly in enabling the optimization of low and stable dielectric permittivity alongside low-loss properties across a broad frequency range for electronic circuits applications.
Introduction
Titanium dioxide (TiO2) is widely recognized as a high-permittivity dielectric oxide, finding use in applications from capacitors and microwave substrates to modern microelectronics. 1 In advanced transistors and high‐k gate stacks, TiO22,3 has been explored alongside HfO2 4 and ZrO2 5 to combat leakage currents, owing to its exceptionally high dielectric constant. 6 The high permittivity (ε′) of TiO2 makes it an attractive component in high permittivity dielectrics and antenna substrates, enabling device miniaturization and enhanced performance when dielectric losses are low. 7 While the application of TiO2 composite material focused on utilizing the high dietetic constant properties such as device miniaturization; 7 however, high values of dielectric material are associated with high capacitance, which may lead to undesired capacitive coupling and often higher losses in frequency dependent systems.7–11 On the other hand, dielectric material with low dielectric constant and low losses, offers several useful features including less parasitic capacitance, reduced capacitive coupling, lower energy losses, and enhanced signal stability in electronic circuit application.7–11
TiO2 exists in several polymorphic, including rutile, anatase, brookite, and the less common akaogiite12–15 Among the TiO2 polymorphs, rutile is thermodynamically stable, whereas anatase and brookite are metastable, with brookite often regarded as the least stable phase.16–18 As a result, research on TiO2 typically focuses on anatase and rutile. Anatase can form at relatively lower calcination temperatures (e.g., 773 K), whereas the formation of rutile typically requires higher thermal treatment, often near 1073 K. 19 Notably, anatase can undergo a phase transition into rutile upon heating. Minimizing defects such as oxygen vacancies is critical and can lead to leakage conduction and dielectric loss. Accordingly, improving stoichiometry through annealing has been shown to enhance TiO2’s electrical performance. Thus, TiO2’s status as a dielectric material is intimately tied to its crystal structure.
Several studies have addressed the relationship between TiO2’s crystal structure, microstructure, and its dielectric performance13,19–22 Wypych et al. 20 reported that TiO2 synthesized by the sol-gel technique undergoes a complete anatase to rutile transformation at approximately 850 °C, with transformation onset around 750 °C. In contrast, TiO2 produced via precipitation requires slightly higher temperatures (850–900 °C), while samples derived from hybrid layered ammonium titanate precursors fail to fully transition even at 900 °C. Their study also established that smaller grain sizes, as seen in sol-gel derived rutile TiO2, correlate with enhanced dielectric constant values up to 63.7 at room temperature. Oruç et al. 19 found that the dielectric properties varied significantly with phase purity and abundances. The amorphous phase exhibited the highest dielectric constant and conductance values, while the rutile phase showed more frequency stable behavior, with moderate dielectric values. 19 Singh et al. 21 explored TiO2 nanowires integrated into a Ge-NW heterostructure using glancing angle deposition. Their results highlighted a pronounced frequency dependent decrease in the real and imaginary parts of the dielectric constant and associated these effects with interface state density and series resistance, highlighting the importance of nanoscale interfaces in determining dielectric performance. Further, these findings demonstrate that phase composition, grain size, and synthesis strategy significantly affect the dielectric properties of TiO2-based materials.
This synthesis of TiO2 is commonly achieved through a variety of chemical and physical methods, such as sol-gel approach, hydrothermal and solvothermal treatments, and chemical vapor deposition.23–26 Among these, the electrospinning technique has emerged as a particularly attractive approach for fabricating TiO2 nanofibers due to its simplicity, low cost, and ability to fabricate continuous and controlled fibers.27–29 Furthermore, it allows for a fine tuning crystallinity and phase composition.28,29
This study evaluates the influence of morphological characteristics and processing parameters on the dielectric behavior of sol–gel derived TiO2 powder, electrospun nanofibers before calcination, and nanofibers after calcination. By analyzing these three morphologies, changes in dielectric constant (ε′), dielectric loss (ε″, tan δ), and AC conductivity (σ) were correlated with structural evolution. This approach provides a deeper understanding of the role that nanostructuring and thermal processing play in TiO2 dielectric behavior. Such insights are critical for optimizing material performance in electronics circuits. While, TiO2 is recognized in existing studies as a high-permittivity material, this work presents the potential of TiO2 as a dielectric with low permittivity and low losses achieved through phase and morphology control, which has been largely unaddressed.
Experimental procedure
Electrospun titania nanofibers
Electrospinning is a simple, straightforward, and cost-effective method to produce amorphous titania nanofibers. The precursor solution is prepared by mixing titanium isopropoxide, acetic acid, ethanol, and polyvinylpyrrolidone (PVP) in a sealed bottle and stirring for 5 minutes. The PVP (12 wt%) is then dissolved in the solution at 40 °C for 1 h with stirring, followed by 5 min of ultrasonic filtration to fully dissolve the sol-gel precursor. The prepared solution is loaded into a 10 mL plastic syringe with a 0.514 mm inner diameter stainless steel needle. A commercial electrospinning unit is used to apply 18 kV between the needle and a mesh collector covered in aluminum foil, positioned about 12 cm away. The solution flow rate is controlled at 1.5 mL/h using a syringe pump.
Sol-gel derived titania nanopowders
The low-temperature, cost-effective sol-gel method is used to synthesize porous titania nanopowders, which are useful for photocatalytic applications. The method can yield depositions on complex-shaped substrates, highly pure and homogeneous products at low temperatures, with uniform pore sizes and easy control of doping levels. Titanium isopropoxide (C12H28O4Ti, Mw = 284.22 g/mol) is used as the starting material to synthesize the titania nanopowders. The titania solution is stirred magnetically for 1 h at 100°C to evaporate organic material and then left to dry at room temperature for 48 h.
Heating protocol
The temperature was increased to 800 °C for both TiO2 nanopowders, and nanofibers. The samples were acquired initially at room temperature, from 25 °C to 800 °C, at a heating rate of 10 °C/min. Electrospun titania nanofibers heated in air atmosphere, as in our previous work, exhibit a stoichiometric TiO2 composition with fully occupied oxygen sites, indicating the absence of oxygen vacancies. 30
Characterization techniques
The TiO2 samples were analyzed using a range of advanced characterization techniques. FTIR measurements were carried out using a Shimadzu IRSpirit Fourier transform infrared spectrometer over the range of 4000–400 cm-1, at a resolution of 4 cm-1, accumulating 32 scans per spectrum. Surface morphology was visualized through scanning electron microscopy (SEM), performed on a Tescan VEGA 3 system operating at an accelerating voltage of 20 keV. Transmission electron microcopy (TEM: Morgagni 268, FEI at 80 kV with bright-filed mode) operated at 80 kV was also utilized to evaluate the morphology of the TiO2 samples. Crystallographic analysis was performed using X-ray diffraction (XRD) on a Rigaku MiniFlex diffractometer equipped with Cu Kα1 radiation (λ = 0.15416 nm), set at 40 kV and 10 mA.
The dielectric properties of the samples were measured using an impedance analyzer (Novocontrol Technologies). The measurements were carried out in in the frequency range of 0.01Hz –1 GHz. Frequency-dependent measurements of permittivity (ε′ r , ε″ r ), AC conductivity (σ), and dielectric losses (tan δ) were conducted to evaluate polarization, relaxation, and conduction mechanisms. The samples were prepared by compression to a thickness of 0.15 mm for TiO2 powder, uncalcined nanofibers, and calcined nanofibers, followed by mounting on a sample holder sandwiched between platinum disc electrodes with a diameter of 5 mm.
Results and discussion
SEM and TEM analysis
The morphological and phase evolution of the TiO2 samples were examined using SEM, TEM, and EDX, with the results showing, clear structural differences across the three samples. A granular morphology composed of spherical, agglomerated nanoparticles with rough surface texture was observed in the TiO2 calcined nanopowders (Figure 1(a)). In contrast, the as-spun nanofibers shown in Figure 1(b) exhibited long and continuous nanofibers with smooth surfaces and uniform diameter distribution. The lack of bead formation or surface granularity suggests well controlled spinning conditions. Upon calcination, the nanofibers maintained their one-dimensional architecture, while developing a rougher surface texture with grain-like features along the nanofiber direction (Figure 1(c)). SEM images of (a) calcined TiO2 nanopowders, (b) uncalcined TiO2 nanofibers, and (c) calcined TiO2 nanofibers.
TEM analysis shown in Figure 2, exhibits also the notable morphological variation among the three TiO2 samples. The TiO2 calcined nanopowders, appears as clusters of closely packed, roughly spherical nanoparticles forming dense aggregates (Figure 2(a)). The as-spun nanofibers shown in Figure 2(b) reveal smooth, continuous fibre strands with uniform contrast and no visible surface features, consistent with their polymer-rich, uncalcined structure. The calcination caused the nanofibers to develop a distinctly segmented texture, where darker, bead-like features appearing along the fibre length, indicating structural reorganization during crystallisation (Figure 2(c)). TEM images of (a) calcined TiO2 nanopowders, (b) uncalcined TiO2 nanofibers, and (c) calcined TiO2 nanofibers.
Structural and elemental analyses
EDX spectra obtained for each sample confirm the elemental purity and integrity of the TiO2 compositions (see Figure 3). The EDX spectra show the peaks for titanium (Ti Kα and Kβ) and oxygen (O K), with no evidence of extraneous elements or contamination. The consistent elemental profile across the powder, as-spun, and calcined nanofibers supports the preservation of TiO2 stoichiometry during synthesis and thermal processing.
30
EDX spectra of (a) calcined TiO2 nanopowders, (b) uncalcined TiO2 nanofibers, and (c) calcined TiO2 nanofibers, confirming elemental composition and purity.
XRD patterns of the calcined TiO2 nanopwders, uncalcined TiO2 nanofibers, and calcined TiO2 nanofibers samples (Figure 4(a)–(c), respectively) were collected using a Bruker D8 Advance diffractometer with Cu Kα radiation, λ = 0.15419 nm, 2θ = 20–80°, accelerating voltage of 40 kV, sample spinning speed of 30 rpm, and scanning speed of 0.0149°/s. The TiO2 nanofibers were initially amorphous, as shown by the pronounced amorphous humps in the XRD pattern before calcination. By 800 °C, the amorphous humps disappeared due to the loss of solvent and PVP polymer. Both the nanofibers and nanopwders led to the crystallization of anatase and rutile after the calcination, but the higher concentration of rutile relative to anatase is more pronounced for TiO2 nanofibers than TiO2 nanopowders. The samples were obtained from the International Centre for Diffraction Data (ICDD) powder diffraction file database (Card No. 202242 for anatase), and (Card No. 64987 for rutile). No second-phase peaks existed in the crystalline TiO2. Stacked XRD plots of (a) calcined TiO2 nanopwders, (b) uncalcined TiO2 nanofibers, and (c) calcined TiO2 nanofibers [legend: anatase (A), and rutile (R)].
The average crystallite size (L) of both anatase, and rutile phases were determined for both calcined TiO2 nanopowders, and calcinated TiO2 nanofibers from the Scherrer equation
31
:

FTIR measurements
The FTIR spectra of calcined TiO2 powder, uncalcined TiO2 nanofibers, and calcined TiO2 nanofibers are shown in Figure 5. All samples display a prominent absorption band below 600 cm-1, corresponding to Ti–O–Ti stretching vibrations, which confirm the formation of titanium dioxide. In the uncalcined TiO2 nanofibers, additional absorption peaks are observed at ∼3404 cm-1 (O–H stretching), ∼2924 cm-1 (C–H stretching), ∼1678 cm-1 (C=O stretching of the pyrrolidone ring), and ∼1385 cm-1 (C–N stretching).
32
The residual polyvinylpyrrolidone (PVP) used as a carrier polymer during electrospinning is the cause of these characteristics. These organic-related peaks vanish after calcination, signifying the total breakdown and elimination of PVP, but a weak band at about 1620 cm-1, which is thought to be caused by surface hydroxyl groups, persists. The TiO2 powder synthesized via the sol–gel route from titanium isopropoxide shows only the characteristic Ti–O–Ti vibration and minor O–H signals, reflecting its high purity and polymer-free composition. The disappearance of organic peaks and the dominance of Ti–O–Ti vibrations in the calcined fibers confirm the successful conversion to crystalline TiO2. These findings are consistent with previously reported FTIR analyses of electrospun and sol–gel-derived TiO2 nanostructures.
1
FT-IR spectra of the calcined TiO2 nanopwders, uncalcined TiO2 nanofibers, and calcined TiO2 nanofibers.
Dielectric studies
The characteristics of a dielectric material are determined by measuring its conductivity, electric permittivity, and magnetic permeability over a wide frequency band, also known as broadband measurements, under different temperature conditions. The measured conductivity of the TiO2 powder, uncalcined nanofibers, and calcined nanofibers across a wide frequency range and various temperature conditions are demonstrated in Figure 6. It confirms that TiO2 remains a non-conductive material, even at elevated temperatures. Notably, the conductivity results for the calcined nanofibers, Figure 5(c), demonstrate superior insulating properties, over the measured frequency band. AC conductivity as a function of frequency, comparing (a) calcined TiO2 nanopwders, (b) uncalcined TiO2 nanofibers, and (c) calcined TiO2 nanofibers.
Electric permittivity is a frequency-dependent property, and it is represented as a complex number (2). The real part of the electrical permittivity, Frequency-dependent variation of the real part of permittivity (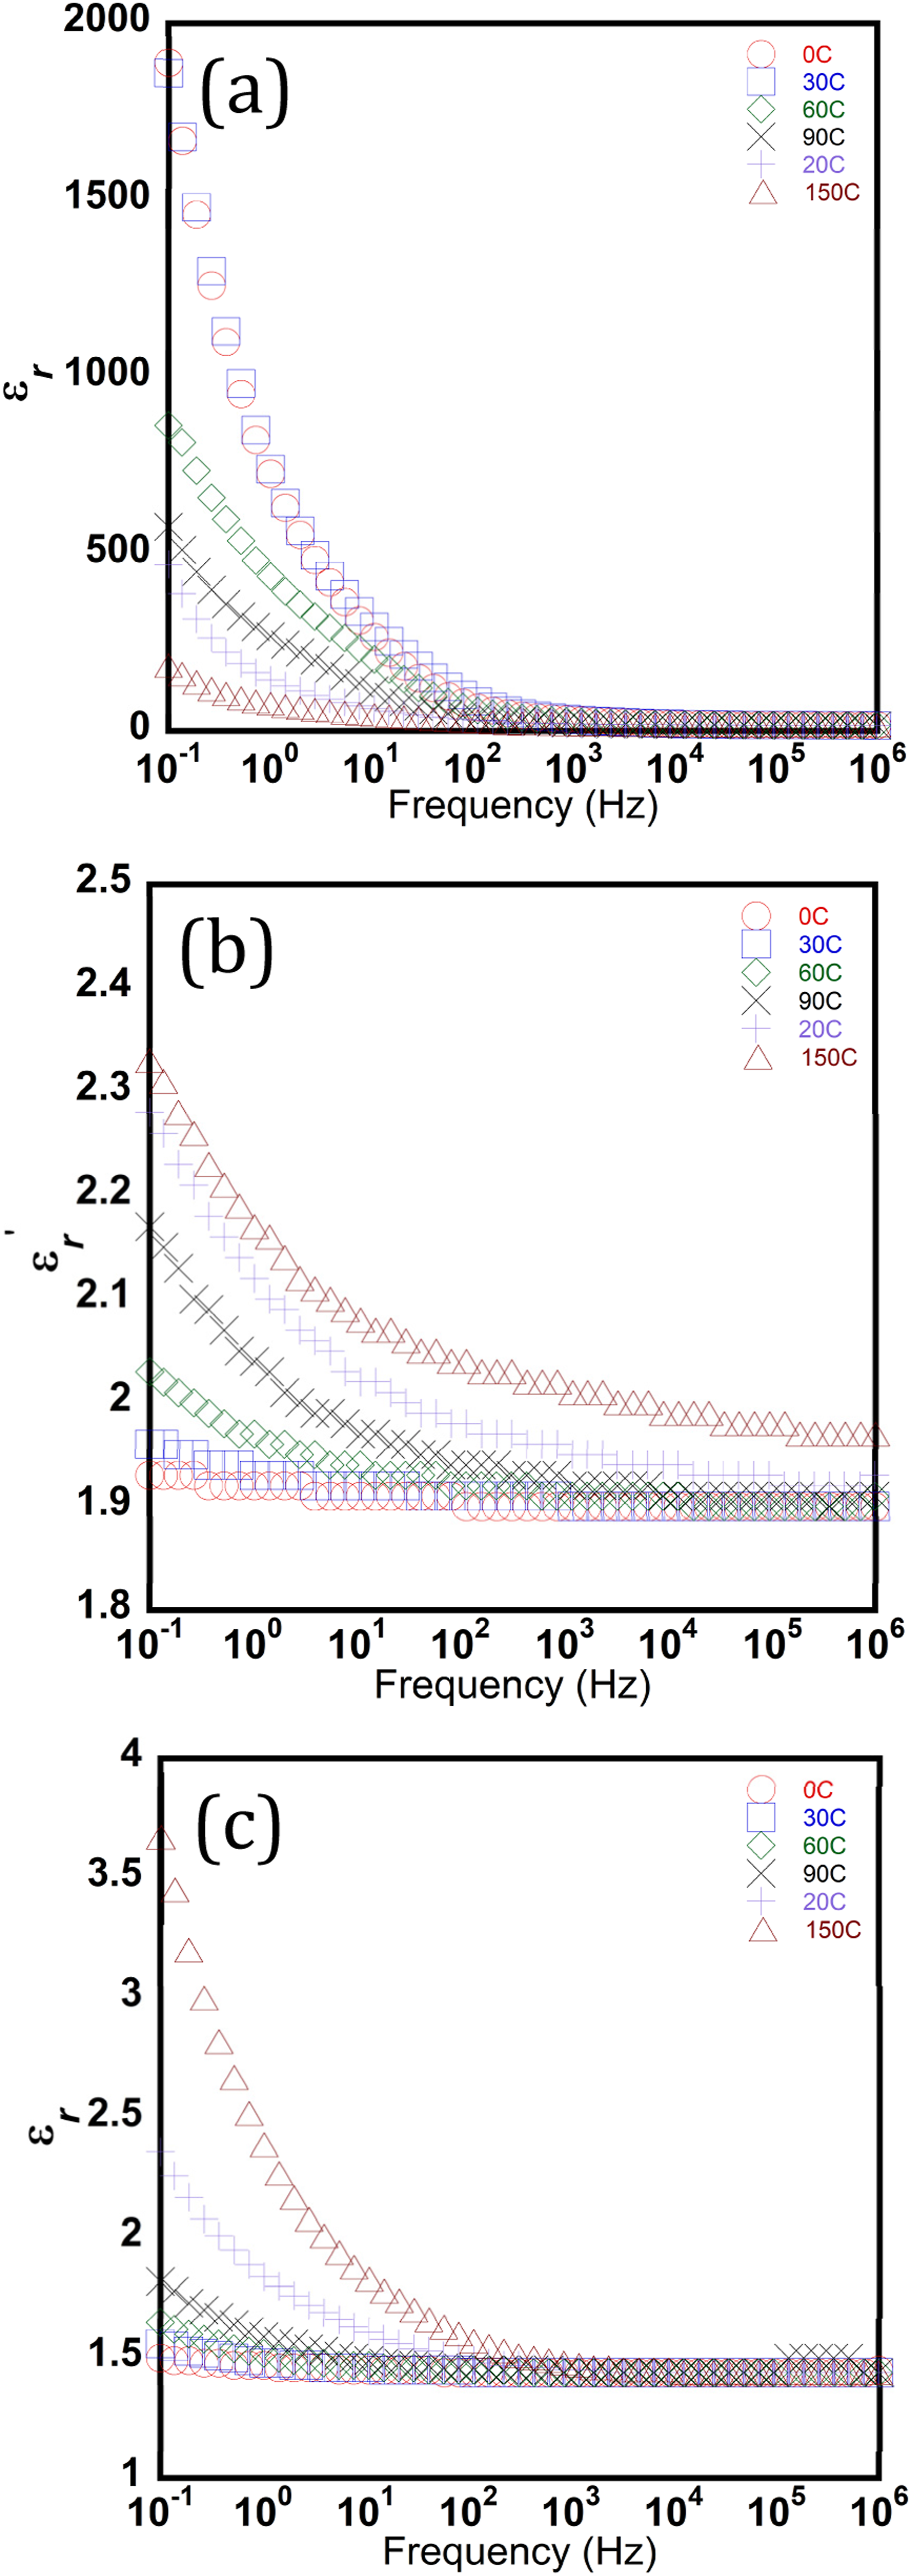

The imaginary part of the electric permittivity, Imaginary part of permittivity (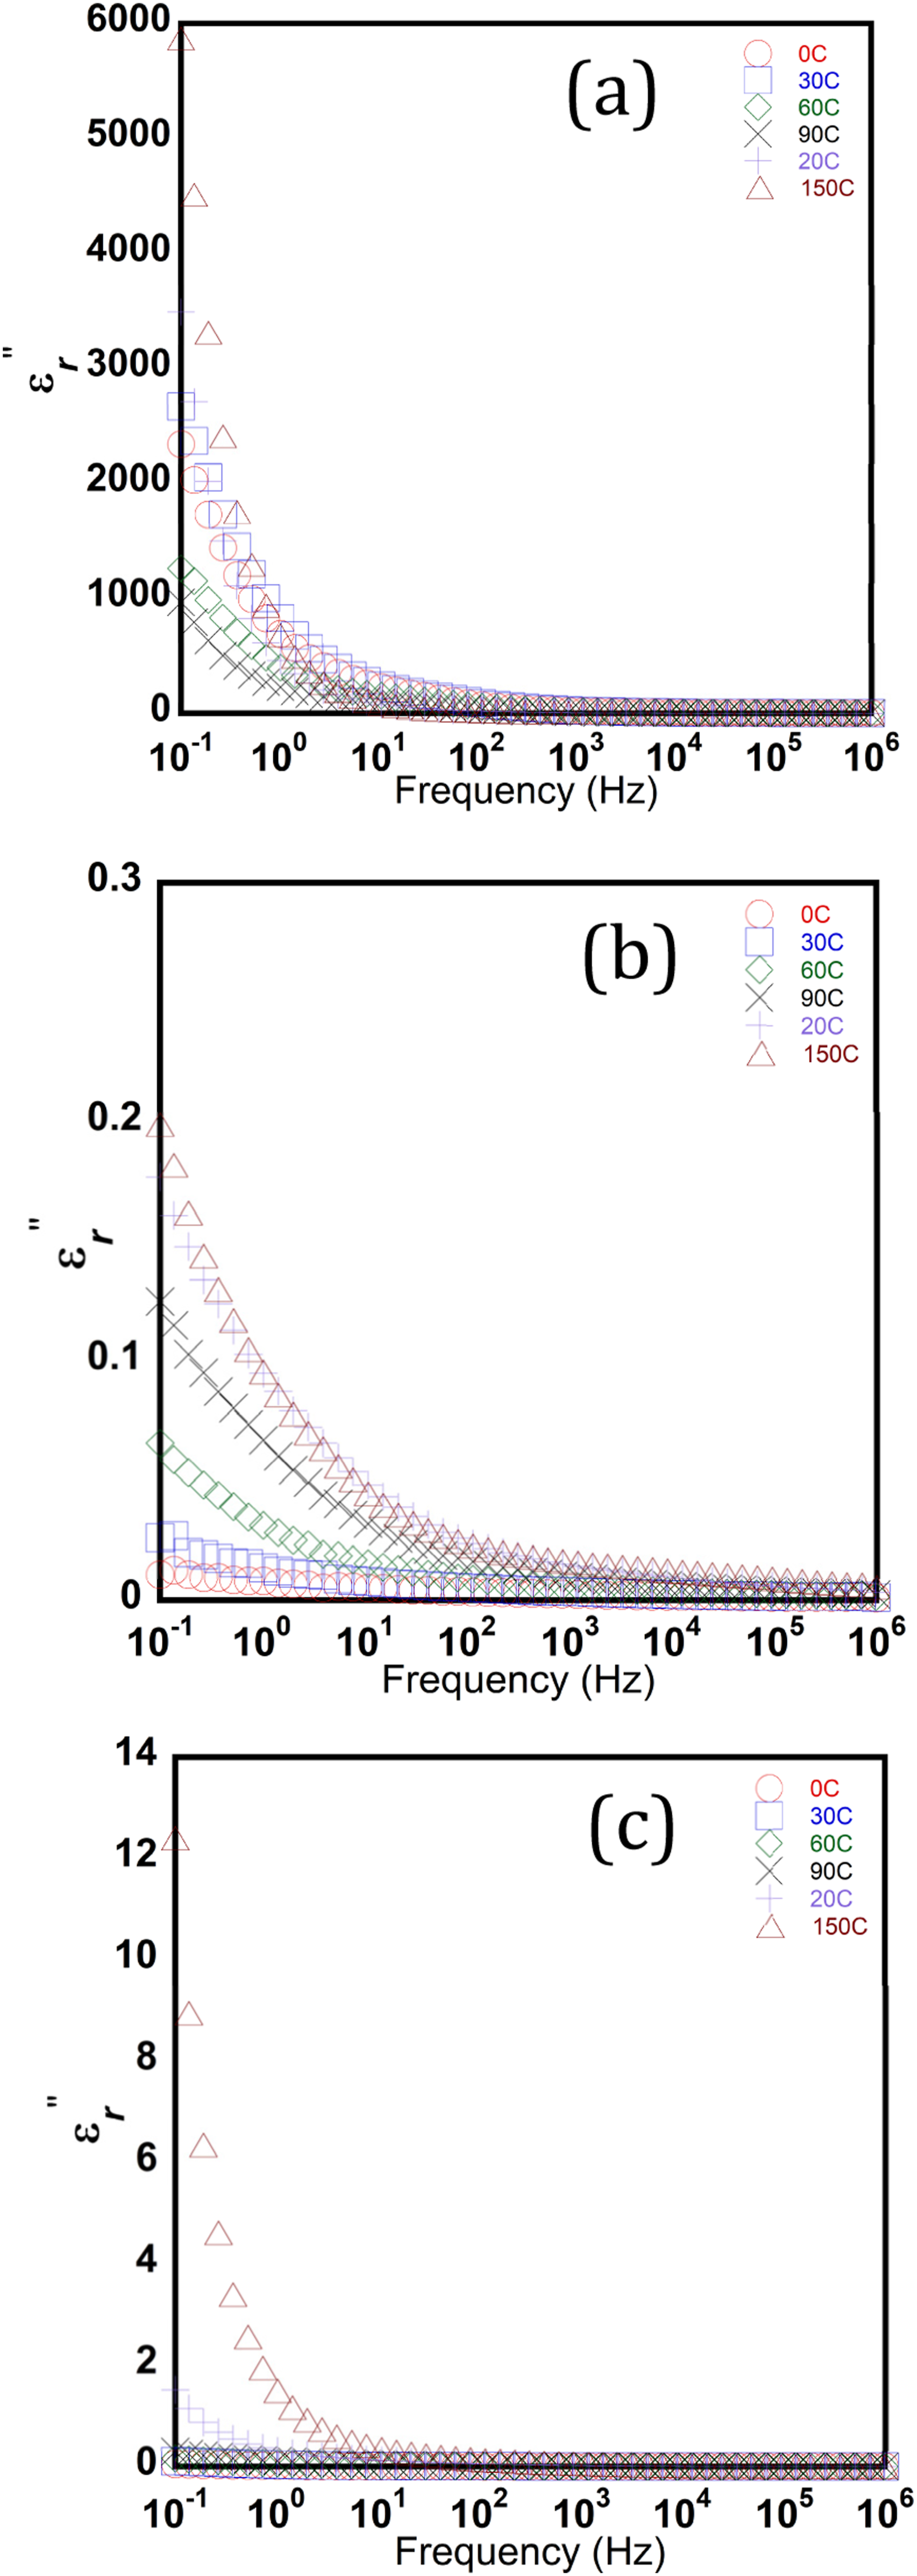
An important property of the dielectric material is the ratio of the dissipated to stored energy in the dielectric material due the alternating electric field, which is known as the loss tangent (3).

Compared to Loss tanolgent (tan δ) versus frequency for (a) calcined TiO2 nanopwders, (b) uncalcined TiO2 nanofibers, and (c) calcined TiO2 nanofibers.
The relative permittivity of a dielectric material directly affects the capacitance in electronic circuits (4) not only between the main signal conductor and the grounding conductor but also between adjacent circuit elements.

The low and stable relative permittivity of the calcinated nanofiber
In addition to minimizing capacitances, such dielectric material with low relative permittivity also decreases the electric field energy stored with the dielectric material under alternating excitation. Since stored energy within a dielectric is directly proportional to the relative permittivity of the material, for non-energy storage application, stored energy within dielectric material results in dielectric stress, and energy dissipation.
Moreover, the calcined TiO2 nanofibers also exhibit a low loss tangent over the 1 kHz to 1 MHz frequency band under different temperature conditions (Figure 9(c)), which makes such dielectric material attractive for less power losses and energy-efficient applications.
The porosity is likely to reduce the effective dielectric constant of TiO2. Introducing air voids (ε ∼ 1) into the high-permittivity TiO2 matrix dilutes its polarizable volume, leading to a lower overall permittivity. Recent studies on pure TiO2 ceramics show that reducing porosity significantly raises the relative permittivity, whereas higher porosity yields a much lower ε′. 7 For example, rutile TiO2 samples with extensive porosity exhibited a dielectric constant as low as ∼20, compared to values ∼115 for highly dense samples. 10
The calcined nanofibers in this study achieve a stable dielectric constant of approximately 1.5, which is an order of magnitude lower than the values reported for porous bulk ceramics. According to the Bruggeman effective medium approximation, 33 this ultra-low value is a result of the exceptionally high air to solid ratio inherent in the nanofibrous scaffold. Previous Studies34,35 support this physical possibility, with TiO2 nanofibrous structures reported to reach porosities between 80.5% and 99.7%. This indicates that morphology-controlled synthesis provides a more effective method for permittivity reduction than simple sintering of bulk materials.
There are clear advantages of using these calcined nanofibers for homogenous substrates; they are particularly effective at lowering parasitic capacitance and reducing capacitive coupling, both of which are essential for achieving lower dielectric losses. By enhancing performance within the 1 kHz – 1 MHz frequency band, these features are vital for energy-efficient applications. This is particularly important in fields where maintaining signal integrity is paramount. Our findings reveal that morphology-controlled synthesis offers an optimum pathway to achieve frequency-stable, ultra-low permittivity without the structural degradation in highly porous bulk systems.
Conclusions
Our findings show that both microstructure and thermal history play a decisive role in determining the dielectric performance of nanostructured TiO2. This comparative study revealed that the calcined TiO2 nanofibers crystallized into a mixed anatase/rutile phase, demonstrated the lowest dielectric constant and smallest loss tangent of all samples. Their dielectric constant remained nearly invariant with frequency, a clear sign of superior insulating behavior. This enhancement is attributed to porosity, improved crystallinity and the removal of polymeric residues, which together minimize defect-induced polarization and charge conduction pathways.
By contrast, the as-spun nanofibers and the sol-gel nanopowder generated stronger interfacial polarization effects, leading to higher ε′ values at low frequencies and elevated tan δ and σ. These findings highlight the importance of morphology control in dielectric materials research. Tailoring TiO2 into nanofibrous form and applying appropriate thermal treatment enabled tuning of key dielectric parameters from ε′ and tan δ to achieve low permittivity performance and low-loss characteristics as required. Such insights provide a valuable foundation for designing advanced dielectric materials with low and stable relative permittivity and low losses for electronics applications that require reduced parasitic capacitance, less capacitive coupling, and less power losses. These stable and low relative permittivity as well as the low losses of the calcined TiO2 nanofibers within the
Footnotes
Author contributions
Muidh Alheshibri: Conceptualization, Methodology, Investigation, Data curation, Writing - original draft, Writing - review & editing. Hani Albatran: Conceptualization, Methodology, Investigation, Data curation, Validation, Writing - original draft, Writing - review & editing. Fares T. Alharbi: Investigation, Validation, Writing - original draft, Writing - review & editing. Seyda Tugba Gunday: Validation, Writing - review & editing. Emre Çevik: Data curation, Validation, Writing - review & editing. It-Meng Low: Writing - review & editing.
Funding
The authors received no financial support for the research, authorship, and/or publication of this article.
Declaration of conflicting interests
The authors declared no potential conflicts of interest with respect to the research, authorship, and/or publication of this article.