
Abstract
Combining the advantages of the sol–gel method and solvothermal method, the single anatase phase of nano-titanium dioxide (TiO2) with high crystallinity had been prepared by means of the sol–solvent thermal improved process, in which butyl titanate was used as titanium source; anhydrous ethanol as solvent; concentrated nitric acid as inhibitor; and cationic surfactant cetyl trimethyl ammonium bromide (CTAB), anionic surfactant sodium dodecyl benzene sulfonate (SDBS), and nonionic surfactant polyethylene glycol (PEG) as dispersants. The analysis results of Brunauer–Emmett–Teller, scanning electron microscopy, and transmission electron microscopy characterizations indicated that CTAB-modified TiO2 with the optimum ratio had the most apparent dispersibility and the highest specific surface area compared with unmodified TiO2, SDBS-modified TiO2, and PEG-modified TiO2. At the same time, the photocatalytic degradation rate of methyl orange could be improved to 99.16%. It indicated that the modification effect of CTAB was significantly better than those of SDBS and PEG, which made the nanoparticles uniformly dispersed, resulting in higher photocatalytic activity.
Introduction
With the continuous improvement in people’s living standards, more and more products originate from nonrenewable natural sources such as petroleum, coal, and natural gas. 1 –3 At the same time, the various steps of the extraction, transportation, and transformation of raw materials into final products are likely to bring negative effects to the environment. 4 –7 The growth of global industry has greatly increased the generation and accumulation of waste by-products, leading to double pressure from environmental pollution and energy shortages, that human beings are currently coping with. 8 The achievement of semiconductor photocatalytic technology in the field of environmental remediation cannot be ignored. 9,10 It has been proved that the technology is an effective way to degrade the harmful pollutants in water and atmosphere. Solar cells and solar photocatalytic H2 production through water splitting can achieve the efficient use of renewable energy to solve the problem of energy crisis. 11 –18 Titanium dioxide (TiO2) is considered to be an ideal semiconductor for photocatalytic treatment because of its high stability, low cost, and high safety for humans and the environment. 19 –24
The surface area of photocatalyst is an important factor to determine the adsorption capacity of pollutants, which directly affects the strength of photocatalytic activity. 25 Because of the high surface energy of the nanometer material, the nanoparticles tend to accumulate to achieve the equilibrium state of the system, resulting in the serious agglomeration of the nanopowder and the small active surface area. Therefore, high-density block aggregates should be effectively controlled at the stage of early preparation. The molecular structures and amphiphilic properties of the surfactants determine their orientation and formation of micelles on the surface of the solution, which have good adsorption properties and can be used as stabilizers and dispersants in the synthesis of the nanopowders.
In this article, three types of surfactants as the stabilizers and dispersants in the preparation system were used to promote uniform dispersion of nanoparticles with narrow size distribution. Meanwhile, pure nanomaterials could be obtained by subsequent calcination at a suitable temperature. 26 Monodispersed nano-TiO2 materials had the high proportion of the active surface area, which could provide more active sites, thereby enhancing the photocatalytic efficiency. Under the optimum ratios of different types of surfactants, the photocatalytic degradation rates of cetyl trimethyl ammonium bromide (CTAB)-modified nano-TiO2, sodium dodecyl benzene sulfonate (SDBS)-modified nano-TiO2, and polyethylene glycol (PEG)-modified nano-TiO2 were improved by 16.28%, 13.41%, and 9.23% compared with unmodified nano-TiO2, respectively.
Experimental
Preparation of modified nanometer TiO2
The specific steps of sol–solvent thermal improved process for the preparation of nano-TiO2 could be divided into three stages, which included solubilization process, solvent thermal process, and calcination process. First, 9 mL of butyl titanate and 15 mL of absolute ethanol were blended in a beaker to form solution A and placed the beaker on a magnetic stirrer to form a homogeneous solution at room temperature. According to the reactant ratio of n(Ti(OR)4):/n(C2H5OH):n(H+):n(H2O) = 1:15:0.35:4, 7 mL of anhydrous ethanol, a certain amount of deionized water and concentrated nitric acid, and a certain ratio of the surfactant were mixed up under the action of magnetic stirring in the beaker to form solution B. Then, the mixed solution B was poured into a dropping funnel in order to prepare a dropping solution. In the continuous magnetic stirring process, the solution B in the dropping funnel was slowly dropped into solution A; also the dropping rate was controlled at 2 s per droplet for 20 min approximately. The stirring rate was based on the phenomenon without the generation of bubbles and splash droplets. Afterward, the mixing system continued to agitate for 30 min to obtain a homogeneous sol. Second, the obtained sol was poured directly into the lining of the autoclave to ensure that the filling capacity was between 60% and 80%, and the autoclave was well sealed. Solvent thermal reaction occurred at the temperature of 150°C between the solvothermal time of 24 h. Third, the product of solvent thermal reaction was repeatedly washed to neutral by deionized water, then dried, and grinded into powder. At the calcination temperature of 450°C, the powder was calcined in the muffle furnace for 4 h in order to remove the chemical adsorption of hydroxyl and alkyl groups and the physical adsorption of organic solvents and water.
Characterization and performance analysis
The crystal structure of samples was tested by X-ray diffraction (XRD; TTR-III, a Bruker D8 Advance X-ray Diffractometer). The elemental analysis, microstructures, and morphologies of samples were collected by scanning electron microscope (SEM; S-4800), equipped with the energy-dispersive spectrometer (EDS) and transmission electron microscopy (TEM; JEM-2100F). X-Ray photoelectron spectroscopy (XPS) was performed on a VG ESCALAB LKII instrument (ESCALAB 250). Fourier transform infrared (FTIR) spectroscopy was analyzed by IFS-66V/S (Bruker, Karlsruhe, Germany) in the region of approximately 40–4000 cm−1. Nitrogen adsorption and desorption test used ASME 2010 model produced by the US Micromeritics Inc. (Norcross, GA, USA) for obtaining specific surface area and pore size distribution.
Then, 0.05 g of the TiO2 sample and 50 mL of the prepared methyl orange solution at a concentration of 20 mg/L were mixed into a suspension, which took place as a dark reaction for 30 min under the action of magnetic stirring to achieve the balance between adsorption and desorption. The initial absorbance A 0 of the methyl orange in the mixed solution on the surface of the TiO2 after adsorption–desorption equilibrium could be measured by the supernatant, which was obtained by centrifugation with the speed of 12,000 r/min. Then, the mixed solution was subjected to a photoreaction under the light source of high-pressure mercury lamp with the main wavelength of 300 nm or more and the power of 250 W. In order to ensure the accuracy of the photocatalytic degradation rate of the sample, the light reaction was repeated six times and lasted 10 min each time. After that, part of the solution was centrifuged, meanwhile the speed consistent with the centrifugal rate of dark reaction was kept constant to measure the absorbance, which was recorded as A t. In this way, the photocatalytic performance of nanometer TiO2 could be determined by the degradation rate η of methyl orange, which was measured and calculated according to equation (1):
Results and discussion
In order to explore the optimization of the cationic surfactant CTAB, the anionic surfactant SDBS, and the nonionic surfactant PEG for nano-TiO2 modification, the TiO2 samples were taken for characterizations and photocatalytic performance tests according to the best dispersion ratios (the mass ratios of surfactants to butyl titanate) of 1:60, 1:30, and 1:30, respectively.
XRD based on the crystal structure uses the principle that the specific crystal face has the corresponding characteristic peak position. The crystal form of the crystalline material, the phase analysis, the determination of cell parameters, and crystal orientation analysis can be carried out. Figure 1 shows the XRD patterns of nanostructured TiO2 with different modification effects. In contrast to the standard powder diffraction file card, the crystal faces of the different modification samples corresponded to the crystal faces of the anatase phase whereby the addition of the surfactant did not affect the formation of the anatase phase and the calcination temperature did not reach the transition temperature of rutile phase. Compared with the spectra of different samples, the intensity and width of diffraction were similar, so the effects of surfactants on the crystallinity of nanoparticles were negligible. In addition, the sharp peaks of diffraction represented the samples with good crystallinity. Since the surfactants were removed during the calcination, there were no characteristic peaks of the dispersants in the spectrums.

XRD patterns of (a) unmodified TiO2, (b) CTAB-modified TiO2, (c) SDBS-modified TiO2, and (d) PEG-modified TiO2. CTAB: cetyl trimethyl ammonium bromide; PEG: polyethylene glycol; SDBS: sodium dodecyl benzene sulfonate; TiO2: titanium dioxide; XRD: X-ray diffraction.
In order to discriminate the microscopic distribution of nano-TiO2 intuitively, the morphological analysis was carried out by SEM. Figure 2 shows the SEM images of different samples at similar magnifications. As shown in Figure 2(a), unmodified sample with clear edges and smooth surfaces stacked in layers irregularly. It could be inferred that the grain arranged closely in the sample results in the serious agglomeration and poor dispersibility. As shown in Figure 2(b), the surface of CTAB-modified sample with obvious embossed lines was rough. The sample was separated from each other and distributed evenly, and the nanosized particles formed more gaps. As shown in Figure 2(c), SDBS-modified sample had both partial compact aggregates and partially dispersed small particles; however, the irregularities formed by the dispersion of particles were not obvious. It indicated that the arrangements between the particles were not very close, showing a loose state relatively. As shown in Figure 2(d), PEG-modified sample had loose bulks with rough surfaces, but there were still a lot of compact blocks with smooth surfaces. There were molecular forces between nanoparticles such as van der Waal forces, which made the arrangement of particles into indefinite shaped blocks in order to maintain the stability of the system. In contrast, CTAB-modified sample particles showed the most loosely arranged and porous state from the microscopic point of view.

SEM images of (a) unmodified TiO2, (b) CTAB-modified TiO2, (c) SDBS-modified TiO2, and (d) PEG-modified TiO2. CTAB: cetyl trimethyl ammonium bromide; PEG: polyethylene glycol; SDBS: sodium dodecyl benzene sulfonate; SEM: scanning electron microscopy; TiO2: titanium dioxide.
Figure 3 shows the TEM images of different samples at similar magnifications. As shown in Figure 3(a), unmodified sample particles were spherical in different sizes, and the particles adhered to and overlapped with each other. Compared with the unmodified samples, the dispersibility of CTAB-, SDBS-, and PEG-modified samples represented by Figure 3(b), (c), and (d), respectively, had been improved, which indicated that the surfactants played the roles as reunion inhibitors in the process of preparation. It was not difficult to find that CTAB-modified TiO2 had the least shaded area formed by the agglomeration of nanoparticles and the smallest particle size at the same scale. Therefore, the conclusion of TEM images consistent with the analysis result of SEM images demonstrated that CTAB was the best dispersant.

TEM images of (a) unmodified TiO2, (b) CTAB-modified TiO2, (c) SDBS-modified TiO2, and (d) PEG-modified TiO2. CTAB: cetyl trimethyl ammonium bromide; PEG: polyethylene glycol; SDBS: sodium dodecyl benzene sulfonate; TEM: transmission electron microscopy; TiO2: titanium dioxide.
The main function of EDS was to characterize the microstructure and the distribution of elements in the material domains quantitatively. As shown in Figure 4, only Ti and O elements were present in TiO2, except for the substrate material required for the preparation of the sample during the test without any other impurity element. It could be inferred that the surfactants used as the dispersants in the synthesis process of sample were completely removed during calcination to obtain pure TiO2 nanopowder.

EDS patterns of (a) unmodified TiO2, (b) CTAB-modified TiO2, (c) SDBS-modified TiO2, and (d) PEG-modified TiO2. CTAB: cetyl trimethyl ammonium bromide; EDS: energy-dispersive spectrometer; PEG: polyethylene glycol; SDBS: sodium dodecyl benzene sulfonate; TiO2: titanium dioxide.
XPS was a necessary way to analyze elemental composition and valence qualitatively. Figure 5 shows the XPS spectra of TiO2 samples under different modification conditions, in which there were mainly three peaks of Ti, O, and C. The C 1 s at 284.8 eV was the internal standard for accurate scanning, caused by the indefinite hydrocarbon content of the instrument itself. At the binding energies of 458.7 eV and 464.6 eV, Ti2p had peaks corresponding to Ti2p3/2 and Ti2p1/2, respectively. It confirmed that there was only +4 valence for the Ti element, and the structure of valence bond between Ti–O was TiO2.

XPS patterns of (a) unmodified TiO2, (b) CTAB-modified TiO2, (c) SDBS-modified TiO2, and (d) PEG-modified TiO2. CTAB: cetyl trimethyl ammonium bromide; PEG: polyethylene glycol; SDBS: sodium dodecyl benzene sulfonate; TiO2: titanium dioxide; XPS: X-ray photoelectron spectroscopy.
FTIR could be used to analyze the functional groups of material by IR spectroscopy. As shown in Figure 6, FTIR spectra were obtained by analyzing tablets, which were made of potassium bromide and TiO2 samples under different modification conditions at room temperature. Comparing the four lines, the main absorption band of TiO2 was approximately 700–500 cm−1, and the peak at 471 cm−1 was the absorption peak of lattice vibration of TiO2 particle. Judging from the shape of the peak at 471 cm−1, TiO2 samples under different modification conditions were mainly anatase phases, which were consistent with the conclusion of XRD. The weak and broad peaks of 3410 cm−1 and 1619 cm−1 were the absorption peaks of H2O, and the characteristic absorption peak of CO3 2− appeared at 1385 cm−1, indicating that CO2 adsorbed on the surface of TiO2 reacted with H2O to form CO3 2−. In summary, the peak of the lattice vibration of CTAB-modified TiO2 at 471 cm−1 was the broadest, demonstrating that the crystal had the smallest particle size.

FTIR patterns of (a) unmodified TiO2, (b) CTAB-modified TiO2, (c) SDBS-modified TiO2, and (d) PEG-modified TiO2. CTAB: cetyl trimethyl ammonium bromide; FTIR: Fourier transform infrared; PEG: polyethylene glycol; SDBS: sodium dodecyl benzene sulfonate; TiO2: titanium dioxide.
Figure 7 shows the isothermal adsorption–desorption curves and Barrett–Joyner–Halenda desorption pore size distribution curves of TiO2 under different modification conditions. By analyzing the adsorption–desorption isotherms of type IV, the size and distribution of pore could be obtained. At low relative pressure, the amount of adsorption improved with increasing relative pressure, at which point the nitrogen molecules were adsorbed onto the inner surface of the pores of the sample in single or multiple layers. When the relative pressure was gradually increased, there was a sudden jump in adsorption due to capillary condensation of N2 in the mesopores. When the relative pressure reached a certain level, the adsorption amount changed little, indicating that the adsorption had reached the saturation state. When the relative pressure decreased, N2 desorption lagged significantly, resulting in hysteresis ring. As shown in Table 1, it could be demonstrated that CTAB-modified TiO2 sample possessed the highest specific surface area (147.94 m2/g), the highest total pore volume (0.37 cm3/g), and the lowest average pore size (4.91 nm) compared with unmodified TiO2, SDBS-modified TiO2, and PEG-modified TiO2. Combined with the TEM images and the distribution of pore size, the mesopore structure in the sample might be formed by the accumulation of nanoparticles with uniform size. Conspicuous high porosity created considerable specific surface area of the nanosamples, bringing about the outstanding photocatalytic effect.

The isothermal adsorption–desorption curves and BJH desorption pore size distribution curves of (a) unmodified TiO2, (b) CTAB-modified TiO2, (c) SDBS-modified TiO2, and (d) PEG-modified TiO2. BJH: Barrett–Joyner–Halenda; CTAB: cetyl trimethyl ammonium bromide; PEG: polyethylene glycol; SDBS: sodium dodecyl benzene sulfonate; TiO2: titanium dioxide.
The specific surface area, average pore size, and total pore volume accumulated by BJH desorption of (a) unmodified TiO2, (b) CTAB-modified TiO2, (c) SDBS-modified TiO2, and (d) PEG-modified TiO2.
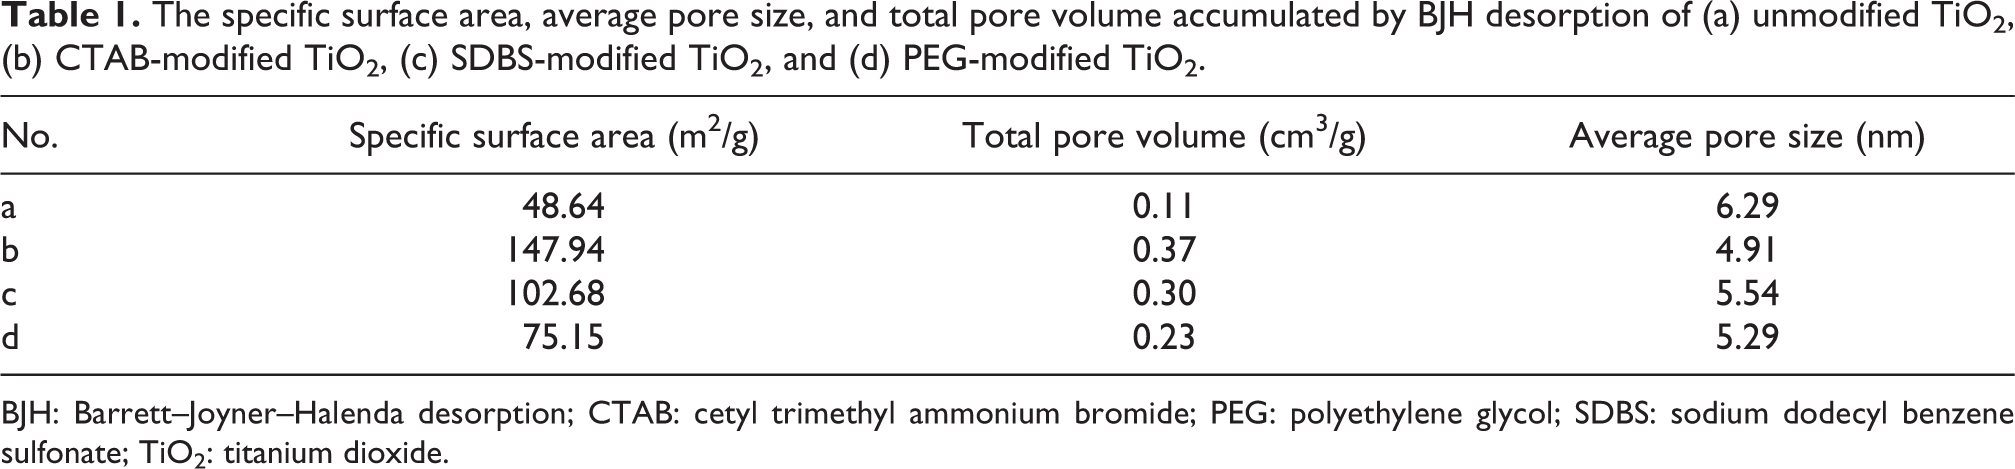
BJH: Barrett–Joyner–Halenda desorption; CTAB: cetyl trimethyl ammonium bromide; PEG: polyethylene glycol; SDBS: sodium dodecyl benzene sulfonate; TiO2: titanium dioxide.
Figure 8(a) shows the photocatalytic degradation rates of nanostructured TiO2 with different modification effects. Under the optimum ratios of different types of surfactants, the photocatalytic degradation rates of CTAB-modified nano-TiO2, SDBS-modified nano-TiO2, and PEG-modified nano-TiO2 compared with unmodified nano-TiO2 were improved by 16.28%, 13.41%, and 9.23%, respectively. The curves of photocatalytic degradation is shown in Figure 8(b), for which the relative absorbance value A t/A 0 at the reaction time t (min) was in the y-axis, and the photocatalytic reaction time was in the x-axis. When the reaction was carried out for 60 min, the average rate of the entire degradation process was (A 0 − A t)/(A 0 × 60). As we could see, the average rate of CTAB-modified nano-TiO2 was the highest.

Photocatalytic degradation rates (a) and degradation curves (b) of (a#) unmodified TiO2, (b#) CTAB-modified TiO2, (c#) SDBS-modified TiO2, and (d#) PEG-modified TiO2. CTAB: cetyl trimethyl ammonium bromide; PEG: polyethylene glycol; SDBS: sodium dodecyl benzene sulfonate; TiO2: titanium dioxide.
The difference of modification effect may be analyzed from the perspective of the dispersion mechanism. In the system with the strong acid, the adsorption layer may be formed between CTAB and nanoparticles by the interaction between nanoparticles, Br− and C16H33(CH3)3N+. SDBS is mainly associated with the surface of nanoparticles by sulfonate, and the benzene ring in the molecular structure of SDBS with strong adsorption capacity contains unsaturated π bond. The presence of hydroxyl groups in the molecular structure of PEG can enhance the adsorption of particles by the action of hydrogen bonds. Combining the specific surface area and the photocatalytic degradation rate of the conclusion, the reasonable explanation for the modification effect may be that the interaction between –CH2(CH3)3N+ and nanoparticles in CTAB is higher than that between –SO3+ and nanoparticles in SDBS, and their dispersing effects are all stronger than that of PEG. Uniformly dispersed nanoparticles have higher photocatalytic activity, so the modification effect is remarkable.
Conclusions
In general, the sol–solvent thermal process can be used to prepare high crystallinity and homogeneously dispersed nanomaterials with surfactant as the dispersant. Surfactant can improve the interface state in the system and reduce the solid–liquid interface energy while weakening the collision and contact between particles and preventing the agglomeration of particles effectively. It is worth mentioning that the cationic surfactant CTAB can form a protective film on the surface of all particles in the system and become the most effective dispersant. The photocatalytic degradation rate of CTAB-modified nano-TiO2 was up to 99.16%, which improved by 16.28% compared with the unmodified nano-TiO2.
Footnotes
Declaration of conflicting interests
The author(s) declared no potential conflicts of interest with respect to the research, authorship, and/or publication of this article.
Funding
The author(s) disclosed receipt of the following financial support for the research, authorship, and/or publication of this article: The work is supported by National Science Foundation of China (51275203).