
Abstract
The stress-strain response of pristine monolayer graphene under uniaxial loading/unloading over a more extensive size range (100 nm×100 nm) is studied by molecular dynamics simulations, which proves that graphene is perfectly elastic prior to the failure strain. Young’s modulus of graphene is calculated by selecting different strain ranges in the elastic region. It is found that Young’s modulus is strongly dependent on the strain range. When the selected strain ranges are increased from 0.5% to 8%, Young’s modulus of the armchair and zigzag graphene is reduced by approximately 60 GPa and 150 GPa, respectively. Based on the Pearson correlation coefficient method, the linearity of the stress-strain curve during graphene stretching is studied. The elastic region of the tensile curve is divided into the linear elastic region and non-linear elastic region. Simultaneously, the linear elastic limit strains for the armchair and zigzag graphene are defined to be about 2.5% and 1.5%, respectively, and they are independent of the size of graphene. On this basis, the chirality dependence and size effects of Young’s modulus, failure strain, and fracture strength of pristine monolayer graphene are investigated. The results show that Young’s modulus is dependent on the chiral angle but insensitive to size. The failure strain and fracture strength depend on the chiral angle and have obvious size effects.
Introduction
Graphene, defined as the two-dimensional nanomaterials of honeycomb lattice with carbon atoms, 1 has broad application prospects2,3 in the fields of nanodevices, flexible electronics, nanocomposites due to its exceptional mechanical properties.4,5 Young’s modulus of graphene is a crucial indicator to measure its mechanical properties. Therefore, obtaining reliable and accurate Young’s modulus has great significance in understanding its mechanical properties in depth.
So far, many studies on the elastic properties of graphene have been carried out via nanoindentation experiments in atomic force microscope, 4 continuum elasticity theory, 6 and molecular dynamics simulations.7-9 The results show that graphene exhibits nonlinear elasticity under tensile loading. Hence, selecting a specific strain range in the stress-strain curve is necessary to form an equivalent linear elastic region when fitting Young’s modulus of graphene. Mortazavi et al. 10 and Zhao et al. 11 both selected a small strain range (<0.5%) as a linear elastic region and calculated Young’s modulus of graphene based on molecular dynamics simulations. Zhang et al. 12 calculated Young’s modulus of graphene by taking the strain range of less than 2% as the linear elastic region. Pei et al. 13 linearly fitted Young’s modulus in the strain range of 3%. Sun et al. 14 thought that the stress increases linearly with the strain to 8% and calculated Young’s modulus in the strain range of 8%. Moreover, Wang et al. 15 proposed that the initial deformation with a minor strain can be regarded as a linear elastic region to fit it. Thus, in the current studies, a unified strain range has not been selected to define the linear elastic region of graphene for calculating Young’s modulus.
Recently, the strain dependence of graphene elastic properties has been reported in some research. López-Polín et al. 16 measured Young’s modulus of unstrained and strained graphene by indentation experiments, and found that Young’s modulus of graphene with strain (0.25%) was significantly improved. Androulidakis et al. 17 investigated the effect of strain on Young’s modulus for graphene by Raman spectroscopy measurement technology. The research showed that Young’s modulus was strongly dependent on strain in the strain range of −0.6% when graphene was compressed, while when graphene was stretched, the stress increased linearly with strain in the strain range of 1.5%. Prabhakar et al. 18 and Qu et al. 19 found that Young’s modulus exhibits nonlinear behavior with increasing strain using first-principles based on density functional theory calculations. Moreover, it firstly increases with strain increases and then sharply decreases. Los et al. 20 considered the in-plane Young’s modulus dependent on the strain by using atomistic Monte Carlo simulations. Hosseini Kordkheili et al. 21 proved by finite element method that Young’s modulus depends on the strain and decreases linearly with the increase of strain. In conclusion, it has been discovered that Young’s modulus of graphene is strongly dependent on the strain, so it is difficult to obtain a reliable and accurate Young’s modulus value by selecting different strain regions to fit Young’s modulus.
Besides, the related investigations have also indicated that Young’s modulus, failure strain, and fracture strength of graphene exhibit size effects. Based on the finite element method,22-24 molecular dynamics simulations,11,25 and first-principles calculations, 19 respectively, it was found that Young’s modulus is dependent on the size ratio in the size range (15 nm×15 nm) with altering its size ratio. Similarly, Georgantzinos et al. 23 also discovered that the failure strain and fracture strength are dependent on the size ratio. As the size ratio is 1 with changing the size range of graphene, the size range dependence of Young’s modulus was studied by molecular dynamics simulations.8,26 Ni et al. 8 found that it is not sensitive to the size range. While Chen et al. 26 considered that Young’s modulus, failure strain, and fracture strength have size range effects in a smaller strain range. Therefore, there are some contradictory conclusions in the present research. In addition, the investigations on size effects of Young’s modulus, failure strain, and fracture strength are mainly focused on the graphene with a smaller size range,20,27,28 and relatively few studies on a larger size range.
In this paper, the stress-strain response of the armchair and zigzag graphene during uniaxial loading/unloading in a more extensive size range (100 nm×100 nm) is studied using molecular dynamics simulations. Young’s modulus of graphene is calculated by selecting different strain ranges in the elastic region. Based on the Pearson correlation coefficient method, the linearity of the stress-strain curve under graphene stretched is studied. The elastic region of the tensile curve is divided into the linear elastic region and nonlinear elastic region, and the linear elastic limit strains applied in the armchair and zigzag graphene are defined regardless of size. On this basis, the chirality-dependence and size effects of Young’s modulus, failure strain, and fracture strength of pristine monolayer graphene are studied.
Materials and methods
Models of chiral graphene
The armchair and zigzag monolayer pristine graphene models are illustrated in Figure 1, where L and W are the length and width of graphene. Uniaxial load is applied to the carbon atoms at the boundary along the X (armchair)-directions and Y (zigzag)-directions. The schematics of the armchair and zigzag monolayer pristine graphene.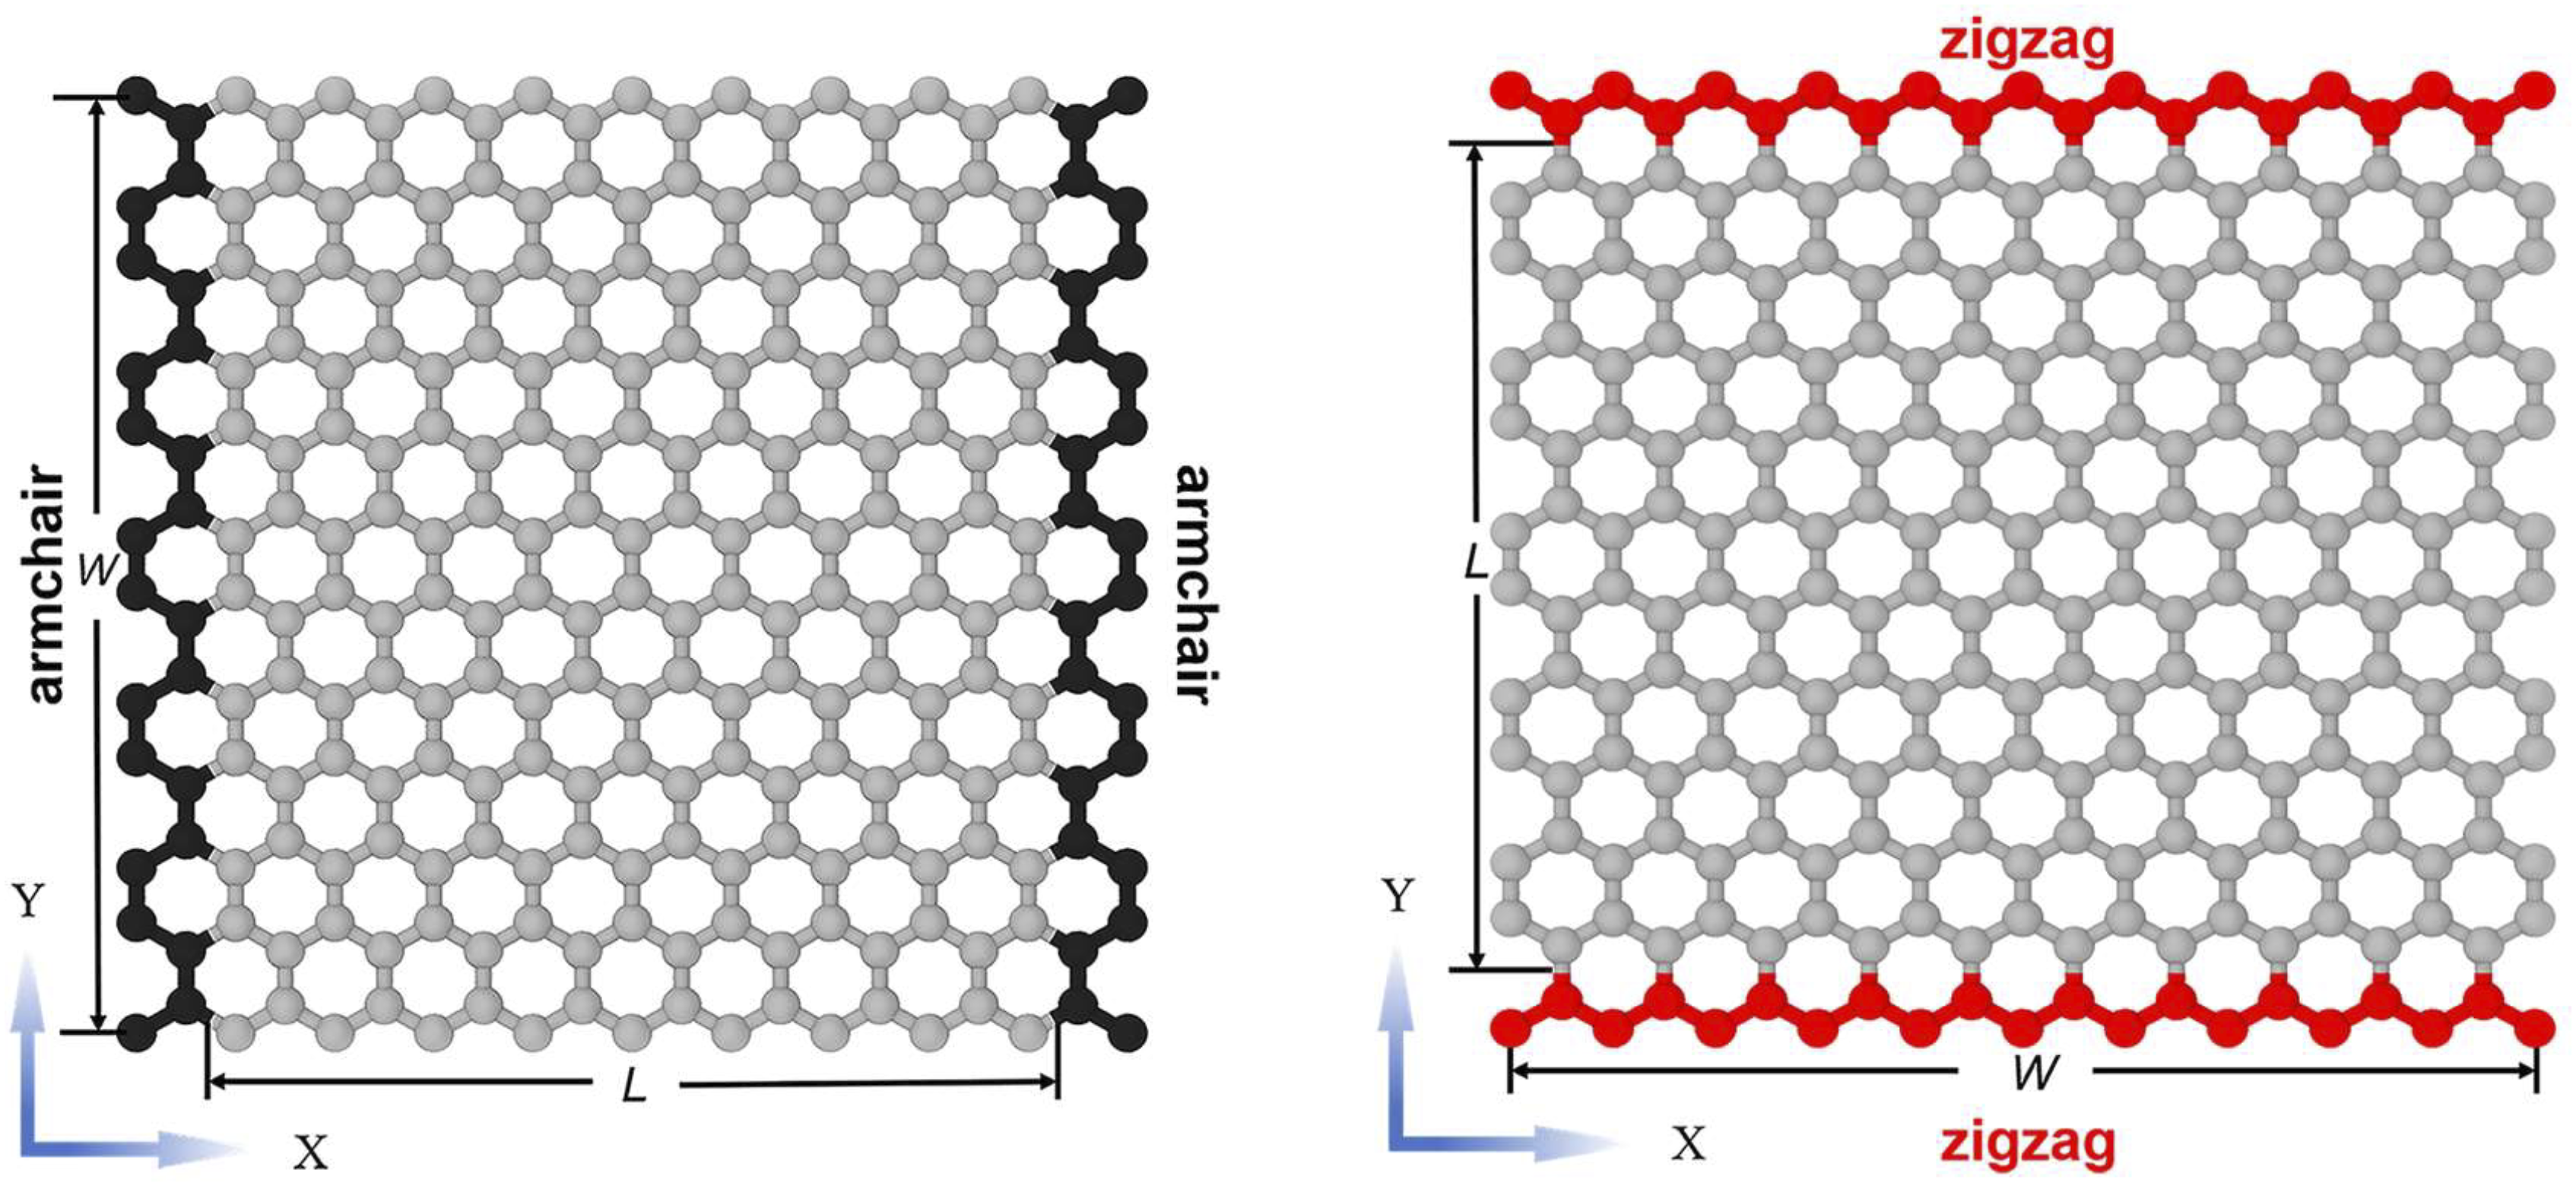
The defined lattice vector Chiral angle of graphene.

The
Simulation method
Molecular dynamics simulations are performed using AIREBO
31
(adaptive intermolecular reactive bond order) potential function to describe the interactions of carbon atoms in graphene. AIREBO potential could be used to simulate the system of C atoms and H atoms, and it can also simulate various characteristics of C-C covalent bonds, including break and recombination of bond length, bond angle, bond energy, lattice constant, and other dynamic behaviors. Moreover, it could realistically reflect the physical properties of solid-state materials composed of carbon atoms. Besides, we compare the mechanical parameters in the stress-strain curve of zigzag graphene using the classical AIREBO potential, REBO potential,
32
Tersoff potential,
33
to identify the accuracy of the used AIREBO potential, as shown in Figure 3. The results show that fracture strength calculated by the AIREBO potential is about 130Gpa, which is in better agreement with the results of other simulations
11
and experiments.
4
Stress-strain curves of zigzag graphene for three kind of potential functions.
In order to avoid spuriously high forces of the carbon-carbon covalent bond, which can arise nonphysical explanations, we set the onset of the covalent interaction cutoff distance to be 2.0 Å in the AIREBO potential. 34
Throughout the simulation, The temperature at 0.1 K is applied using the Nose-Hoover thermostat to avert complex effects caused by the thermal activation of atoms.14-15 The periodic boundary conditions are set in the loading/unloading direction before the simulations of loading/unloading graphene of different sizes. After unconstrained relaxation, the graphene is stretched by moving the boundary at the engineering strain rate (0.1%) with a timestep of 0.001 ps, and strain increment is applied every specific relaxation step until the failure strain.
35
Furthermore, moving the boundary at the negative engineering strain rate (−0.1%) to simulate the unloading process in the same way.
36
Figure 4 presents the variation of total energy with unconstrained relaxation steps in a graphene model (15 nm×15 nm). The initial steps at which the total energy of graphene to attain a stable value are chosen, ensuring that graphene lies in the lowest energy equilibrium state and avoids the dynamic instability suffer from the violent fluctuation of graphene edges because of excessive relaxation time.
37
In addition, the longer unconstrained relaxation step of total energy attain a stable value with the size of graphene and carbon atoms increase, the longer of relaxation steps during loading/unloading. Therefore, references of nine models of different sizes for unconstrained relaxation steps and loading/unloading relaxation steps are listed in Table 1. Variation of total energy with unconstrained relaxation steps. References of unconstrained relaxation steps and loading/unloading relaxation steps.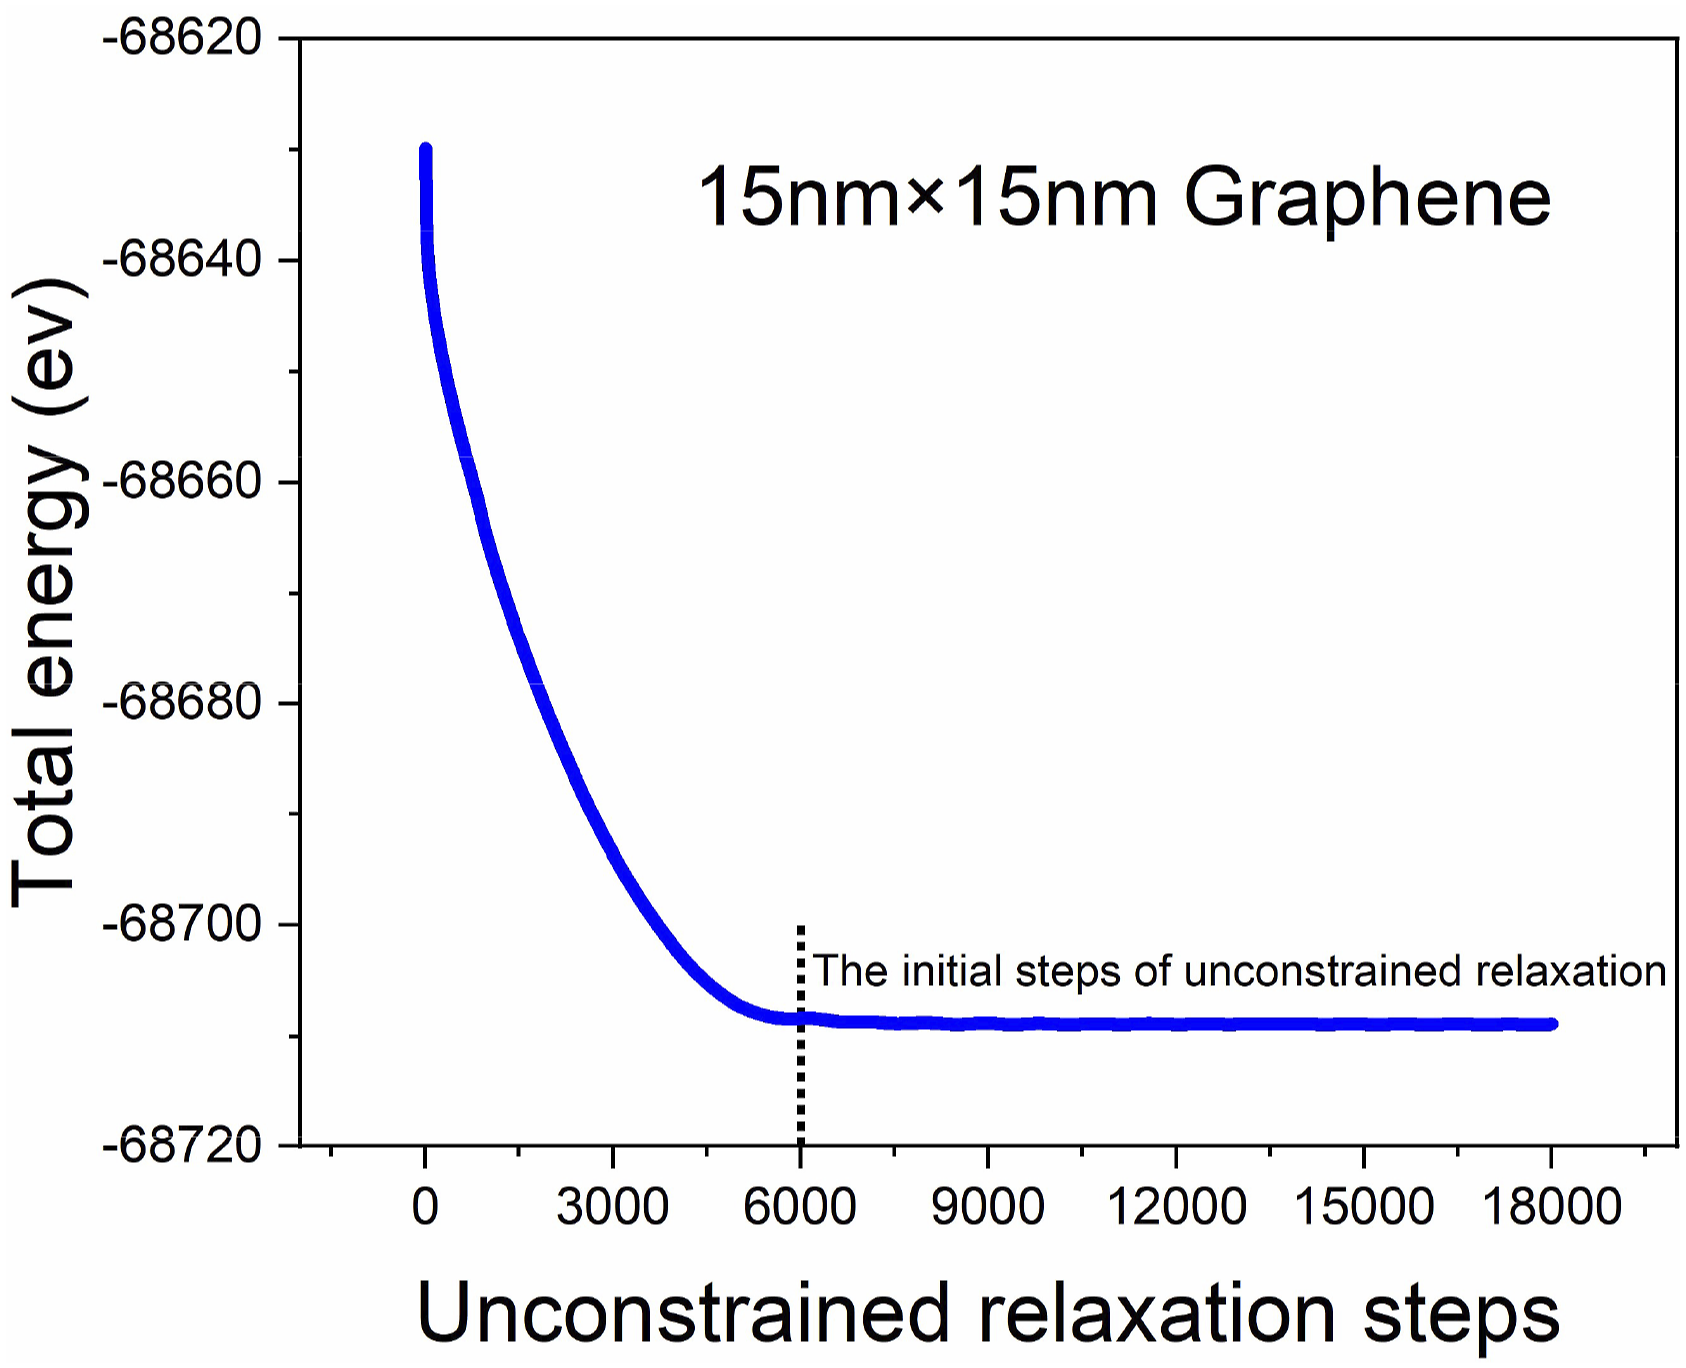

Results and discussion
Elastic properties of graphene
The stress of graphene during uniaxial loading/unloading is calculated according to the virial theorem theory.38,39 For the armchair and zigzag graphene, the stress-strain curves are illustrated in Figure 5, respectively, with the graphene loaded to complete fracture within a larger size range (100 nm×100 nm). It is not difficult to see that the stress increases nonlinearly with the strain. In addition, The nonlinear stress-strain curves before the occurrence of failure for the armchair and zigzag graphene in Figure 5 are fitted by a quadratic polynomial Stress-strain curves of graphene with different sizes (a) armchair (b) zigzag.

Figure 6 shows the whole loading and unloading stress-strain curves before the fracture point under a size range (15 nm×15 nm) for two types of chiral graphene. It can be seen from this figure that the whole loading and unloading stress-strain curves almost overlap, which indicates graphene maintains elastic deformation under the loading process before the failure strain. Hence, we consider the whole loading process before fracture strain as the nonlinear elastic region. Loading/unloading stress-strain curves of the armchair and zigzag graphene. Strain range dependence of Young’s modulus.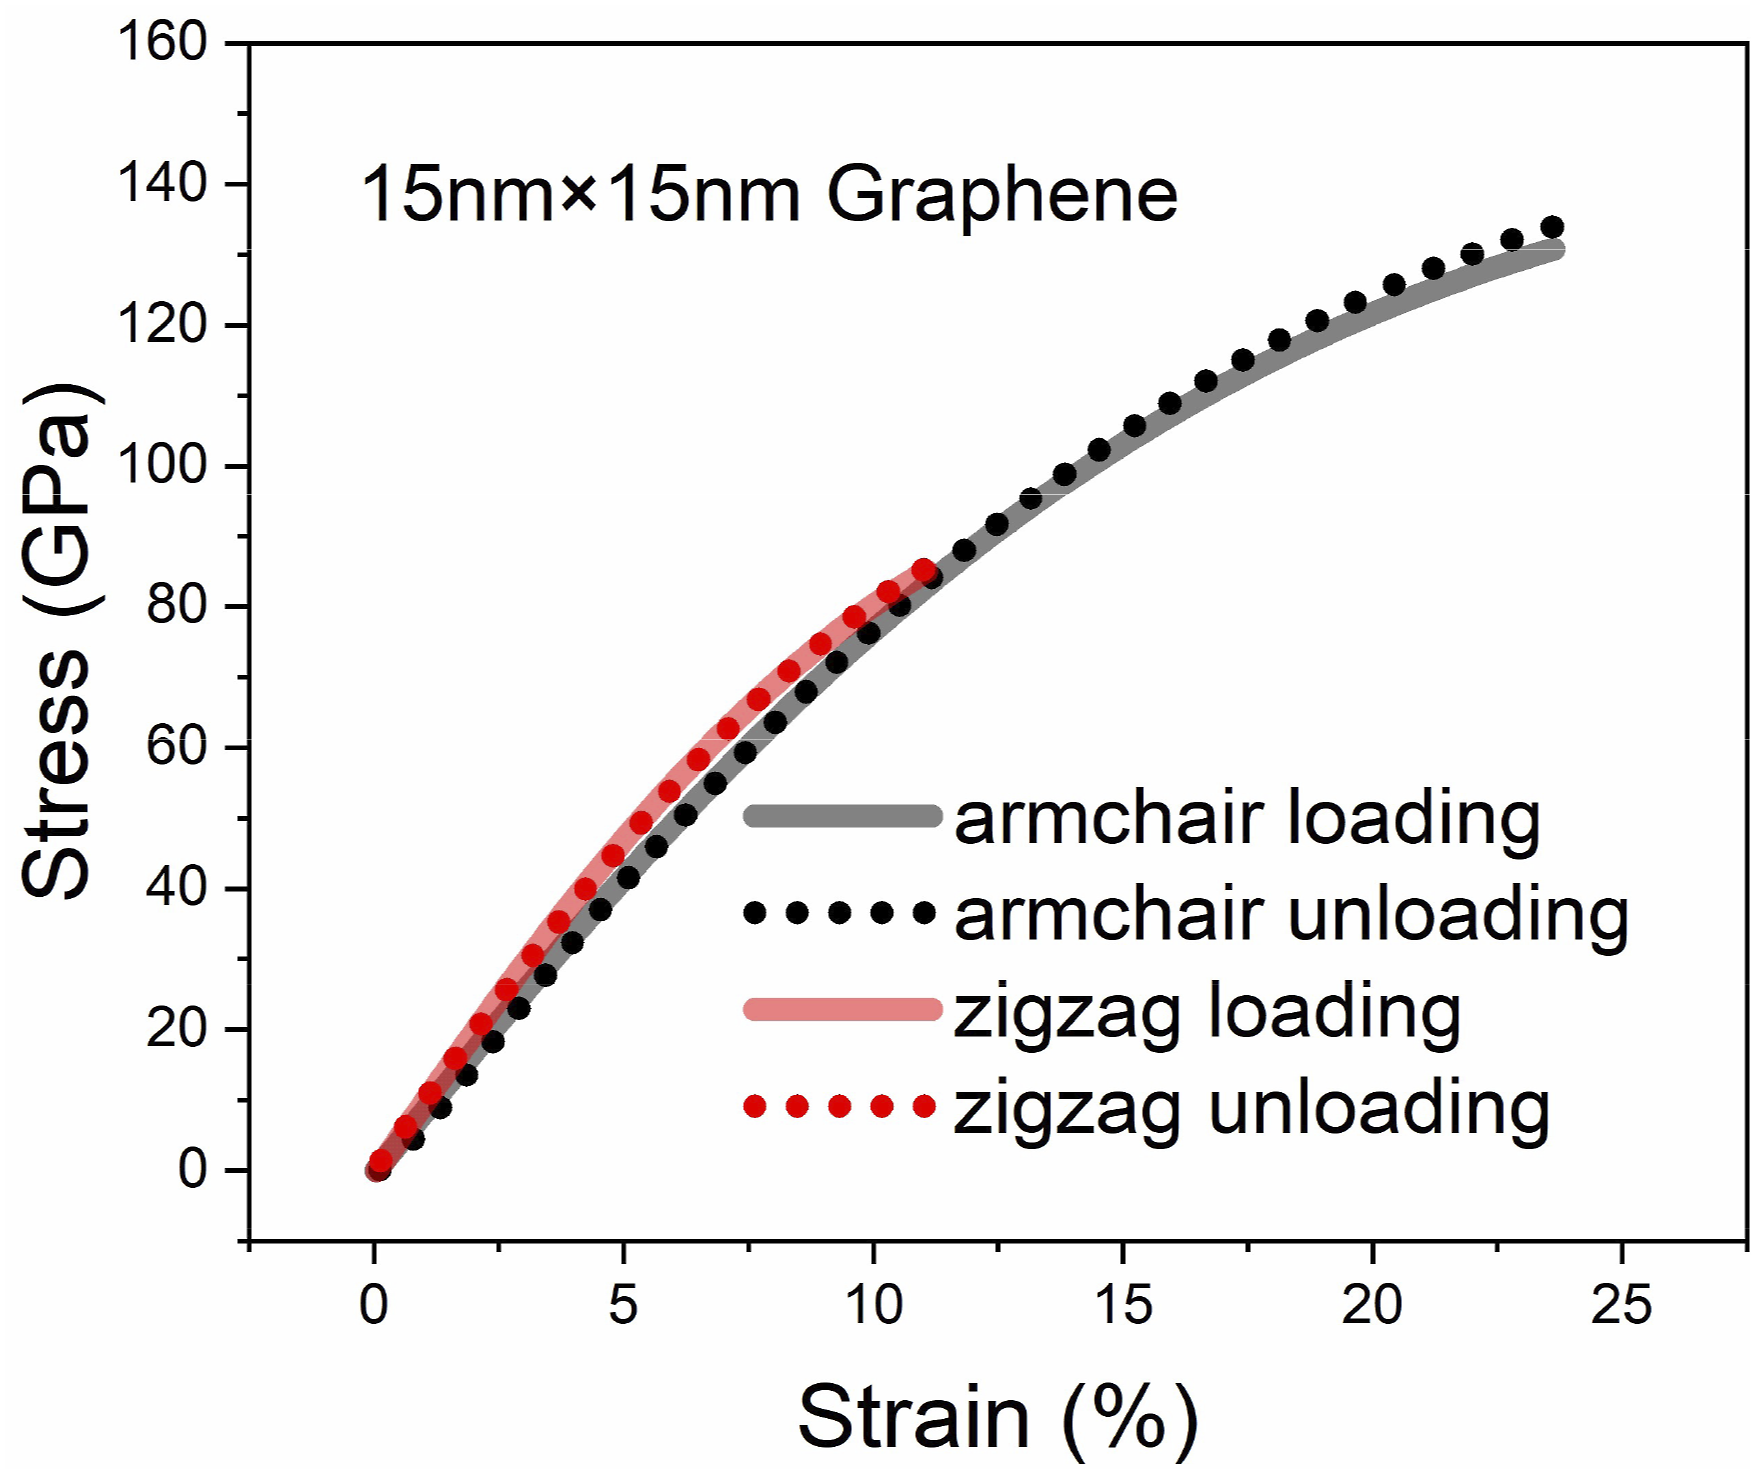
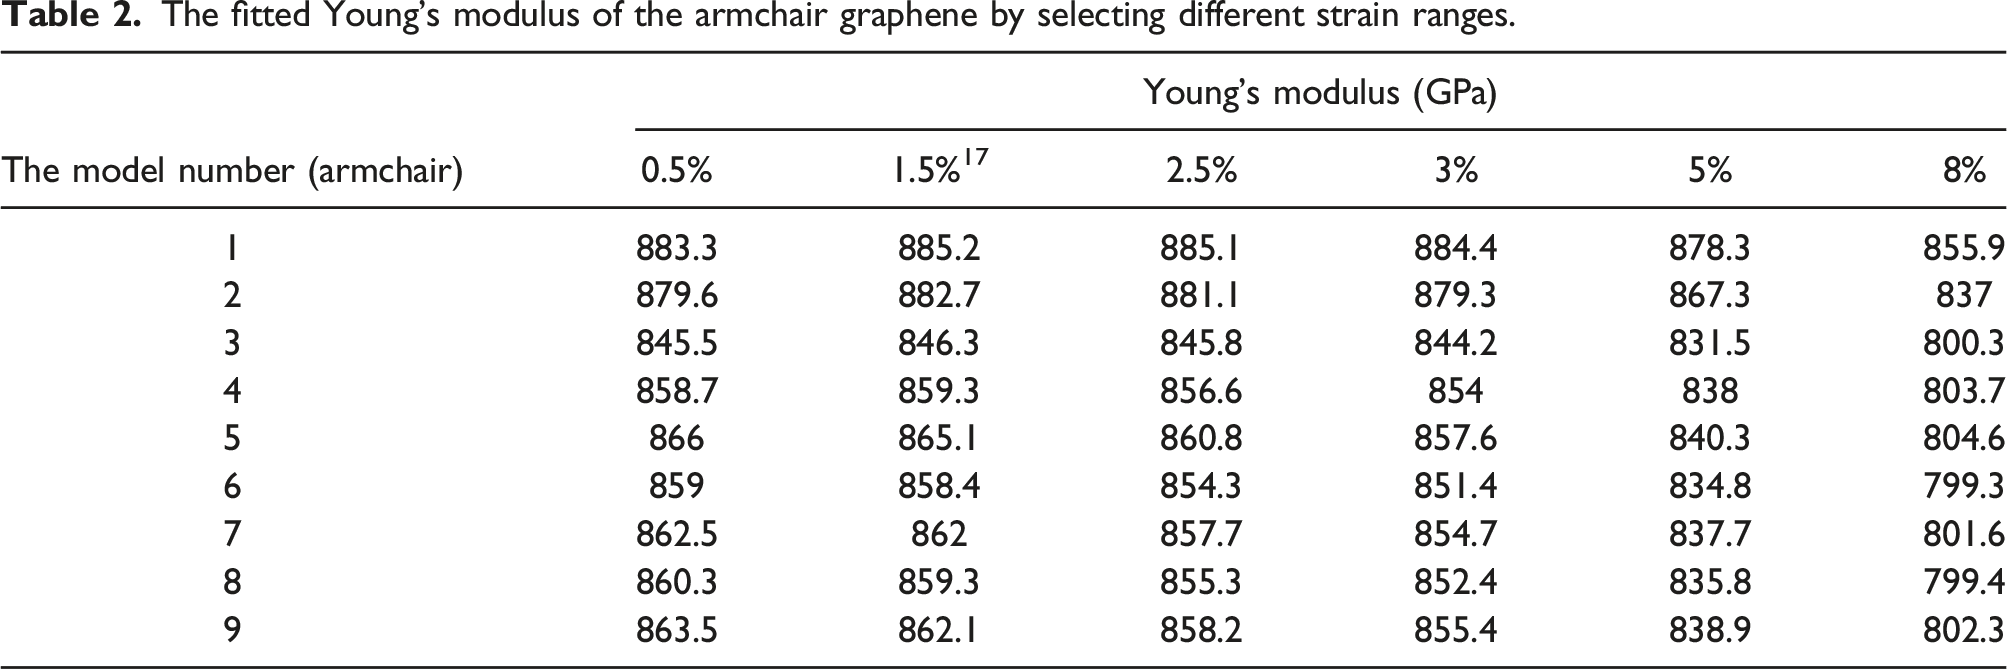
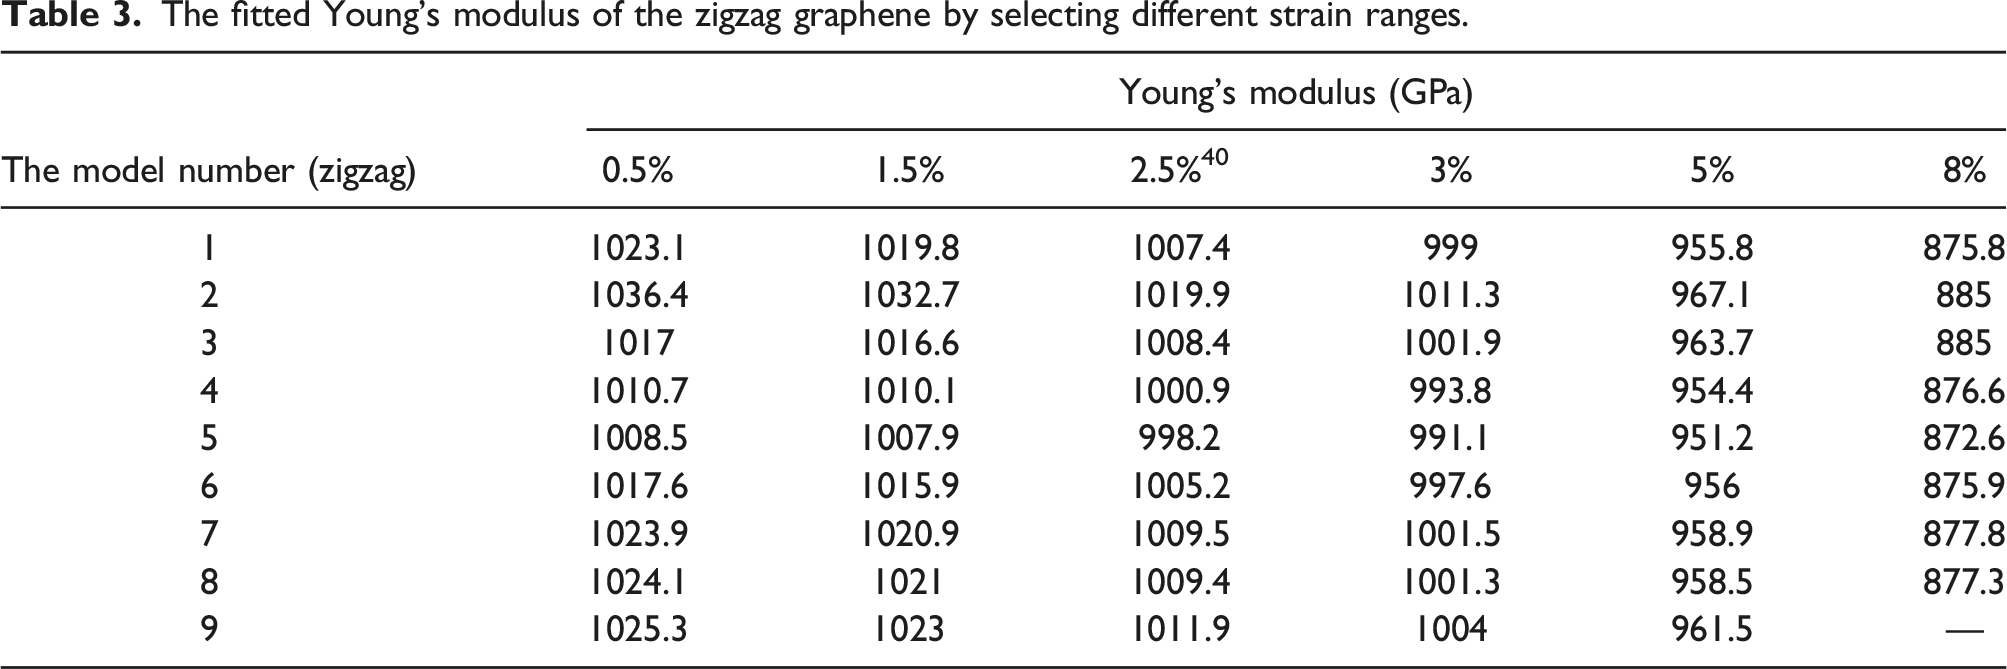
Young’s modulus of graphene is calculated by selecting a strain range that can be equivalent to a linear elastic region and fitted by the least square method. The strain ranges selected in Figure 7 start from (0–0.5%) and continues to increase to (0–8%) at a tensile strain rate of 0.1%. Figure 7 shows the variations of Young’s modulus with the strain range applied in the armchair and zigzag, and it can be found that Young’s modulus has a strong dependence on the strain range. What’s more, Young’s modulus decreases obviously with the increase of selected strain ranges. Young’s modulus calculated from different strain ranges for the armchair and zigzag graphene are listed in Table 2 and 3, respectively. The calculated results are similar to Young’s modulus attained by selecting the same strain range reported in the literature.17,40 When the strain ranges increase from 0.5% to 8%, we can find from Table 2 and 3 that Young’s modulus of the armchair and zigzag decrease about 60 GPa and 150 GPa, respectively. However, when the selected strain ranges of the armchair and zigzag are less than 2.5% and 1.5%, respectively, the variation of Young’s modulus are only about 5 GPa. In other words, the dependence of Young’s modulus for graphene on the strain ranges is significantly reduced, and the linear coincidences degree of the stress-strain curve is better. Variations of Young’s modulus with different strain ranges (a) armchair (b) zigzag. The fitted Young’s modulus of the armchair graphene by selecting different strain ranges. The fitted Young’s modulus of the zigzag graphene by selecting different strain ranges.
The strain range of the stress-strain curves for the armchair and zigzag graphene with Pearson’s correlation coefficient equal to 1.

Based on the above analysis, we divide the elastic region of the tensile curve into the linear elastic region and non-linear elastic region, and define the linear elastic limit strains for the armchair and zigzag graphene to be about 2.5% and 1.5%, respectively, regardless of size (as shown in insets of Figure 5). Moreover, the linear elastic limit strains defined above are in good agreement with the linear elastic region of graphene in the stress-strain curve by experimental measurement.17,40
Size effects of mechanical properties
On this basis, Young’s modulus of the armchair and zigzag graphene with different sizes are calculated by using the defined strain region of linear elasticity. The variations of Young’s modulus for graphene with the size range are illustrated in Figure 8. When the graphene’s size ratio is 1, the results show that Young’s modulus of the armchair is less than zigzag, and Young’s modulus of two types of chirality is insensitive to the size range. Figure 9 shows the variations of Young’s modulus for graphene with size ratio, W/L or L/W, by keeping its length or width constant, i.e. L = 5 nm or W = 5 nm. Young’s modulus of the armchair and zigzag keeps constant as the size ratio increases by keeping the length L constant. Similarly, Young’s modulus of the armchair and zigzag decreases slightly as the size ratio L/W increases so that the change can be neglected. Therefore, it can be concluded that the dependence of Young’s modulus for graphene on the size range and size ratio is negligible, which is consistent with the results in the literature.
8
Variations of Young’s modulus for the armchair and zigzag graphene with increasing the size range. Variations of Young’s modulus of the armchair and zigzag graphene with size ratio (a) W/L (b) L/W.

The variations of failure strain and fracture strength for graphene with the increasing graphene size are shown in Figure 10. Obviously, the failure strain and fracture strength of armchair are greater than those of zigzag. Moreover, the failure strain and fracture strength are both dependent on the size of graphene and decrease with increasing graphene size. Variations of (a) failure strain and (b) fracture strength for graphene with increasing the size range.
The variations of failure strain and fracture strength of graphene are shown in Figure 11 with the increase of size ratio, W/L or L/W, by keeping its length or width constant, i.e. L = 5 nm or W = 5 nm. It can be found that the failure strain and fracture strength of armchair and zigzag graphene keep constant as the size ratio W/L increases. However, they show a decreasing trend as the size ratio L/W increases and tend to be stable as L/W is greater than 8. Variations of failure strain and fracture strength for graphene with size ratio (a) W/L (b) L/W.
In summary, we can conclude that graphene’s failure strain and fracture strength have noticeable size effects. The values of failure strain and fracture strength and their variation trends with the graphene size agree with the counterparts in the published literature.11,25 In our opinion, the size effects of the failure strain and fracture strength are caused by the boundary effect of graphene. In fact, this unsaturated effect at the boundary reduces the ability to withstand tensile loads because the carbon atoms at the free boundary of graphene have dangling bonds. As a result, the carbon six ring of the free boundary will easily fail and fracture during stretching. When L is fixed and W increases gradually, the carbon atoms at the free boundary of graphene are fixed, the failure strain and fracture strength of armchair and zigzag graphene remain constant as the size ratio W/L increases. When W is fixed and L increases gradually, the number of carbon atoms at the free boundary of graphene also increases gradually. The failure strain and fracture strength show a decreasing trend as the size ratio L/W increases. When L increases to a certain extent, the proportion of carbon atoms at the free boundary of graphene tends to be stable (as shown in Figure 12). Therefore, the failure strain and fracture strength of armchair and zigzag graphene tend to be stable. The proportion of carbon atoms at the free boundary of graphene to the entire graphene carbon atoms with L/W increases.
Chiral angle dependence of mechanical properties
The mechanical properties of the armchair and zigzag graphene are different, so it can be concluded that the mechanical properties of graphene are chirality-dependent. According to the chiral angle defined in the 2.1 section, Young’s modulus, failure strain, and fracture strength are calculated when the chiral angles are equal to 0°, 3°, 9°, 15°, 21°, 27°, and 30°, respectively. The results are illustrated in Figure 13. Some interesting phenomena can be drawn from these figures. In Figure 13(a), Young’s modulus reaches its maximum at 3°. When the zigzag graphene (0°) rotates clockwise to a certain angle to the armchair graphene (30°), Young’s modulus shows a decreasing trend with the increase of chiral angle. In addition, the values of Young’s modulus for other chiral angles are basically between those of the armchair and zigzag. The chiral angle dependence of failure strain and fracture strength are shown in Figures 13(b) and (c), respectively. It can be found that failure strain and fracture strength reach minimum values when the chiral angle is 20°. What’s more, failure strain and fracture strength reduce gradually as the chiral angle is less than 20°, and then rapidly increase as they are greater than 20°.41-44 Chiral angle dependence of (a) Young’s modulus (b) failure strain, and (c) fracture strength.
Conclusions
The stress-strain response of the armchair and zigzag graphene during uniaxial loading/unloading in a larger size range (100 nm×100 nm) is investigated by means of molecular dynamics simulations, which demonstrates that graphene maintains nonlinear elasticity prior to the failure strain, and we find Young’s modulus has strong strain range dependence. Thus, the elastic region of the tensile curve can be divided into the linear elastic region and the nonlinear elastic region. The linear elastic limit strains for the armchair and zigzag graphene are defined as 2.5% and 1.5% regardless of size. What is more, Young’s modulus is dependent on the chiral angle but is not sensitive to size. The failure strain and fracture strength are dependent on the chiral angle and have obvious size effects. As the size and size ratio increase, the failure strain and fracture strength show a decreasing trend.
Footnotes
Declaration of conflicting interests
The author(s) declared no potential conflicts of interest with respect to the research, authorship, and/or publication of this article.
Funding
The author(s) disclosed receipt of the following financial support for the research, authorship, and/or publication of this article: This work was financially supported by the National Natural Science Foundation of China (Grant no. 11872268, 12172250) and the Innovative Group Project of National Natural Science Foundation of China (Grant no. 12021002).