
Abstract
Graphene oxide/cement composite was prepared using a graphene oxide aqueous solution. The workability and mechanical properties of graphene oxide/cement composite with different concentrations for graphene oxide and the ratio of water to cement were investigated. The results observed were the fluidity of cement pastes decreased noticeably with the addition of graphene oxide and increased with the increase in the ratio of water to cement for all tested samples of different graphene oxide contents. It is indicated that a noticeable inverse correlation between the concentration of graphene oxide and fluidity was observed, and a positive linear relationship between the ratio of water to cement and fluidity was also obtained. The compressive strength of cement pastes significantly improved in the presence of an appropriate concentration of graphene oxide as compared to that of the cement paste without graphene oxide; this difference was due to the denser microstructure of graphene oxide/cement composite than that of the control specimens. With the combined analysis of X-ray diffraction and scanning electron microscopy with energy-dispersive spectrometry, the results showed that graphene oxide could promote and regulate the formation and connection of calcium hydroxide and calcium silicate hydrate during the hydration reaction, forming numerous regular and extremely compact plate-shaped crystals, and the compact plate-shaped microstructures constituted of not only calcium hydroxide and calcium silicate hydrate but also wrapped ettringite. This investigation will provide a flexible way to preparation of graphene oxide/cement composite with wanted fluidity and optimized compressive strength that promote the industry application of graphene oxide/cement composite.
Introduction
Cement composites (CCs) are the most important and widely used building materials in the world. However, as it is increasingly difficult for traditional reinforce cement systems to meet the requirements of modern lifestyle or engineering, it is necessary to develop modern reinforce cement systems with multi-functional or smart properties in pursuit of high performance in terms of strength, durability, electrical conductivity, and so on. 1 –3 Owing to their excellent mechanical and electrical properties, nanomaterials (carbon fibers, carbon black, carbon nanotubes, and graphene) have been utilized as additives to improve the mechanical, electrical, and strain-sensing properties of composites in the past decades. 4 –6 The use of reinforce cement systems with electrical resistance–strain sensitivity, as well as improvement of compressive strength, will provide a new method for monitoring the structural health of buildings. 7 –9
Graphene exhibits extraordinary properties such as a very large specific surface area of 2630 m2 g−1, high intrinsic strength of 130 GPa, excellent Young’s modulus of 1.0 TPa, and outstanding electrical transport properties. 10 –12 However, the common drawbacks for graphene and other nanomaterials are that they are hydrophobic to agglomerate in aqueous solutions due to the strong van der Waals forces between nanosheets, resulting in weakening reinforcing efficiency and ultimate performance of graphene. 13 Graphene oxide (GO) is one of the derivatives of graphene, which is also composed of monolayer sheets with a hexagonal carbon network as graphene. Compared with graphene, GO bears hydroxyl (–OH) and epoxide functional groups (–CH(O)CH–) on its basal plane as well as carboxyl (–COOH) and carbonyl groups (–C=O–) on its edges, which causes stronger interface effect with cement and higher dispersion in the matrix. 14,15
GO is the most researched form of graphene in cementitious composite and is also a hydrophilic alternative to graphene. GO is more use in cement because it readily well disperses in water, whereas graphene cannot be mixed properly with cement in water influenced by hydrophobicity. Although GO can be dispersed in water, instead of dispersing GO straightforwardly in cement paste, it is necessary to use moderate amount of polycarboxylate superplasticizer (PCs) to help GO disperse uniformly in alkaline cementitious solutions and cement matrix. 16 Earlier studies have focused on the mechanical properties of GO/CC. 17 Usually, GO shows more obvious advantages in improving the compressive strength of reinforce cement systems at lower concentrations as compared to other nanomaterials like carbon nanotubes. 18 A maximum increase of 47.9% in the compressive strength has been achieved by incorporating only 0.05 wt% of GO. 19 Wang et al. 20 found that reinforce cement systems with 0.05 wt% GO exhibited a remarkable increase in compressive strength (24.4%) as compared to those without GO.
At the same time, similar to other nanomaterials, the addition of GO will intensely decrease the workability of fresh cement and presents an even poor workability than carbon nanotubes at small concentration. 21 Workability is one of the significant factors that is closely related to strength, which is evaluated frequently by the mini-slump test. Poor workability not only influences the ease of transport and replacement of fresh cement but also has a negative effect on strength. Gong et al. 22 observed that the fluidity of reinforce cement systems with 0.03 wt% GO decreased by 34.6% compared to that of the plain cement sample. Wang et al. 23 reported a 13.2% reduction in fluidity upon the addition of 0.01 wt% GO. These previous researches infer an inverse correlation between the concentration of GO and workability at a given ratio of water to cement (W/C). It is commonly believed that the large surface area and hydrophilic functional groups of GO demands more water to wet its surface, resulting in the lack of the free water to lubricate.
Consequently, addition of superplasticizers such as PCs has been widely used to reduce water consumption without losing the fluidity and obtain the appropriate workability of the cement paste, 24 meaning that superplasticizers can decrease the W/C, which is one of the most significant factors that affects the strength of cement paste. However, this method is not reliable to be used in the GO/CC which uses superplasticizer as a dispersant of GO in the cement matrix, because it is difficult to distinguish its function between decreasing water consumption and increasing GO dispersion. The bottleneck is how to improve and control the workability of cement paste by a simple and flexible method to achieve reliable desired material properties. In contrast, the way of adjusting W/C to control the workability is easier and more effective using in GO/CC, not as complicated as adding admixture or silica fume, 23,25 although the method is used commonly in CCs. It is not surprising that GO addition leads to a decrease of the workability of the modified cement and that W/C increase improves the workability. However, the previous articles just discussed the relationship between the concentration of GO and workability, but did not explain the relationship between W/C and workability. Moreover, the effect of W/C on the compressive strength of GO/CC is also rare.
In this article, GO gel was used to prepare GO/CC with different concentrations of GO under different W/Cs. The workability of GO/CC was first studied by a mini-slump test, with the intention of analyzing the correlation between concentration of GO and workability at different W/Cs. Then, the tests of compressive strength of GO/CC at 7, 14, and 28 days of curing were performed to investigate the effect of GO concentration and W/C on the strength of cement paste. Furthermore, the microstructures and composition of the crystalline phase for the cement hydration products of GO/CC were tested and analyzed. Finally, the effect of GO concentration and W/C ratio on the workability and mechanical properties of GO/CC are investigated, thus providing an optimized process to preparing the GO/CC composites.
Materials and methods
Materials
Ordinary Portland cement (OPC) type 42.5R procured from Huaxin Cement Co., Ltd (China) was used, and its chemical composition is given in Table 1. GO gel (10 mg mL−1) was supplied by Chengdu Organic Chemicals Co. Ltd (China), and the chemical and physical properties are presented in Table 2. PCs was obtained from Sika (Sichuan) Building Material Ltd (China) and was used to improve dispersion property of GO in the cementitious matrix. However, the chemical composition of PCs is confidential for the supplier.
Chemical composition of OPC.

OPC: ordinary Portland cement.
Chemical and physical properties of GO.

GO: graphene oxide.
Preparation of GO/CC
The details of the GO/CC mix proportions are listed in Table 3. The W/C varies as 0.3, 0.35, and 0.4. GO solution was added into OPC with different contents as 0.05, 0.1, 0.15, and 0.2 wt%. The amount of PCs was kept constant at 0.2 wt% according to Lv et al. 16 In addition, plain cement specimen without GO was prepared for comparison and analysis.
Mix proportions of cement pastes.a

GO: graphene oxide; PCs: polycarboxylate superplasticizer.
a The concentration of the GO aqueous solution is 10 mg mL−1.
The process for preparing GO/CC material is illustrated in Figure 1. The aqueous dispersion of GO was firstly mixed with PCs and then ultrasonicated for 30 min at room temperature with constant amplitude of 50% to prevent agglomeration and overheating of GO in water and to obtain a stable suspension. PCs also promote the dispersion of GO into the cement matrix. The GO/PCs mixture was further mixed with cement and deionized water using a mechanical mixer (NJ-160B). The mixing approach of all specimens referred to GB/T1346-2011. 26
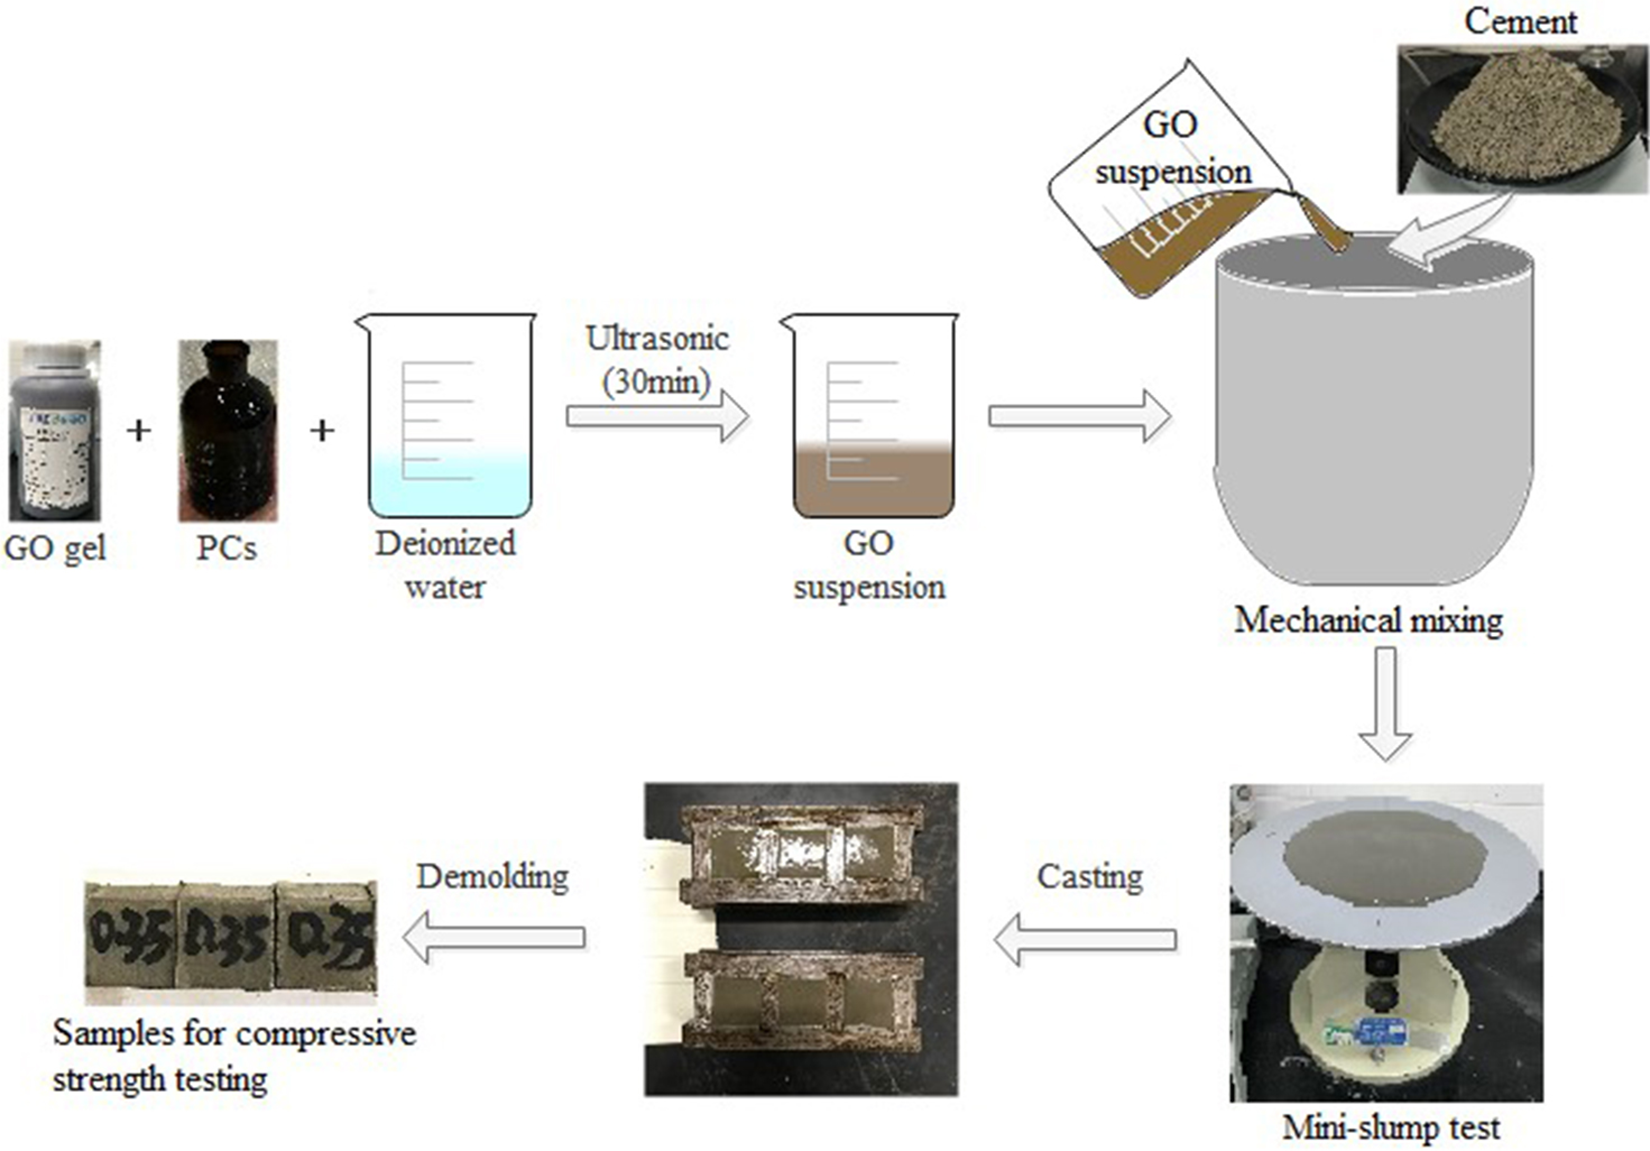
Schematic illustration of preparation process for GO/reinforce cement systems. GO: graphene oxide.
Then, the obtained cement pastes were casted in molds with dimension of 25 × 25 × 25 mm3 for compressive strength testing. All the molds were cleaned and oiled before filling and vibrated after filling to ensure good compaction. Subsequently, all specimens were demolded after 24 h curing under standard conditions at a constant temperature of 20 ± 1°C and a relayive humidity of 95%.
Testing methods
Mini-slump test
The fluidity of GO/CC pastes before curing was evaluated by the mini-slump test. The testing procedures referred to GB/T8077-2000. 27 After mixing, the mixed pastes without any compaction were poured immediately into a mini flow cone and then firmly placed on the flow table. The top diameter, bottom diameter, and height of the cone were 36, 60, and 60 mm, respectively, as shown in Figure 2. Then, the core was raised vertically, and the diameter of the pastes was recorded to calculate the fluidity.

Geometry of mini flow cone used for mini-slump test.
Compressive strength tests
The mechanical behavior of GO/CC was evaluated by compressive strength. It was tested using a compression testing machine at increasing curing ages of 7, 14, and 28 days. A gradual compressive load was applied to the specimen, increased at a constant loading rate of 0.5 kN s−1, and kept until failure of the specimens occurred. For each recipe of the cement paste, three samples were tested, and the average was obtained. The crashed pieces of tested samples were soaked in alcohol to stop hydration at 28 days of curing, which were used for conducting X-ray diffraction (XRD) and scanning electron microscopy (SEM) analyses.
XRD tests
XRD patterns were obtained on an X-ray diffractometer to explore the various crystalline phase compositions of the cement hydration products of the control and GO/CC specimens after 28 days. The D/MAX 2200PC diffractometer (Rigaku Corporation, Japan) with copper K α irradiation was used, operating at 40 kV and 30 mA with a scanning rate of 0.2°min−1 in the 2θ range of 5–90°. The tested specimens were ground to a fine powder using a pestle and mortar and then sieved to remove the coarse and large granules prior to XRD analysis using a square-mesh sieve with a diameter of 0.08 mm. The crystallographic information for the cement hydration products was obtained and interpreted.
Microstructure and elemental composition tests
The fractured morphology of GO/CC was characterized by SEM using an emission scanning electron microscope (Tescan VEGA 3 SBH, Tescan China, Ltd, China) after the compressive strength testing at the curing age of 28 days. All tested specimens were gold coated by a sputtering technique prior to the microscopy analysis for good conductivity. To further understand the effects of GO on the fundamental mechanisms of cementitious composites, the elemental composition was analyzed by SEM coupled with an energy dispersive X-ray spectrometer (EDS).
Results and discussion
Influence of GO concentration
Influence of GO concentration on the fluidity
Workability was measured by mini-slump tests for the plain cement (cement paste without GO) and GO/CC specimens. Figure 3 shows the influence of GO (0.05, 0.1, 0.15, and 0.2 wt%) on the fluidity of cement paste with different W/C ratio (0.3, 0.35, and 0.4). From Figure 3(a), it is observed that only 0.05 wt% content of GO can dramatically decreases the fluidity of cement paste for samples with W/C = 0.3, when fluidity decrease from 214 to 113 and the cement paste almost lost fluidity when the content of GO rises to 0.2 wt%. The same declining trend is also seen in Figure 3(b) and (c), which represents samples of 0.35 and 0.4 W/C, respectively. The percentage of fluidity decreasing is quite close for those two specimens, especially when the content of GO varies from 0.15 wt% to 0.2 wt%, the fluidity of both lose from 66% to 75%. The results indicate that the fluidity of the cement paste gradually decreases with the increase of GO concentration and show a noticeable inverse correlation between concentration of GO and fluidity of pastes. It is widely accepted that GO processes the unique 2D structure and a large specific surface area containing rich hydrophilic functional groups, which need more water to wet the surface and reduce the free water for the mixing of fresh paste. 28 On the other hand, GO and cement particles possess opposite electrostatic charges in water, which means that negative charged oxygen functional groups in GO can physically adsorb the metal cations released from the cement hydrates and lead to the lost of fluidity. 19 Therefore, directly adding GO into cement paste causes flocculation and difficulty in mixing homogeneously.

Effect of GO on the fluidity of cement paste at different W/C: (a) fluidity results when W/C = 0.3; (b) fluidity results when W/C = 0.35; and (c) fluidity results when W/C = 0.4. GO: graphene oxide; W/C: ratio of water to cement.
Effect of GO concentration on the compressive strength of cement paste
The results of compressive strength tests for the plain and GO/CC specimens at 7, 14, and 28 days of curing for 0.3, 0.35, and 0.4 W/C are shown in Figure 4 (a) to (c), respectively. The standard deviations of the testing samples are listed. It can be observed that the compressive strength generally shows an increase with the increase of hydration ages, which is due to the continuous hydration reaction. For different W/C, the optimal addition of GO is different. It can be observed that the specimens of 0.05GO-0.3, 0.05GO-0.35, and 0.1GO-0.4 exhibit the maximum strength after 28 days of curing for 0.3, 0.35, and 0.4 W/C, and the percentages of improvement are, respectively, 12.8%, 23.62%, and 13.13% with respect to the control specimens. The results for all the specimens show that the compressive strength increases first and then decreases with the increasing GO content ratios. Therefore, appropriate concentrate of GO improves the compressive strength of the cement paste, which agrees with relevant conclusion in the literature. 29 This improvement of compressive strength is primarily due to the strong interfacial bonding taking place between the functional groups of GO and cement compounds, causing the formation of strong covalent bonds between the matrix phase and GO. 22 Moreover, GO can fill up the voids between hydration products, and it has a nucleation effect to accelerate the hydration reaction, 30 leading to the development of strength. However, high concentration of GO is not conducive to improve the mechanical properties because of the agglomeration of GO, and undissolved particles prevent the strength enhancing in cement matrix.

Effect of GO on the compressive strength of cement matrix at different W/C: (a) compressive strength results when W/C = 0.3 at different curing ages; (b) compressive strength results when W/C = 0.35 at different curing ages; and (c) compressive strength results when W/C = 0.4 at different curing ages. GO: graphene oxide; W/C: ratio of water to cement.
Effect of W/C on the cement paste
Effect of W/C on the fluidity of cement paste
Figure 5 displays the fluidity of cement paste with different W/Cs. The relationship between fluidity and W/C for specimens of different GO contents are given in Figure 5(a). It can be shown that the fluidity of GO/CC is very sensitive to W/C of the fresh paste, for instance, the fluidities of GO/CC with 0.05 and 0.1 wt% concentration of GO exhibit an obvious improvement when the W/C varies from 0.3 to 0.35, reaching an increment by 42% and 39%, respectively; and the increasing percentage in fluidity approach to 80% when W/C ratio increase to 0.4. However, improving the fluidity of GO/CC by changing W/C for samples of 0.15 and 0.2 wt% is not as dramatically as those lower concentration of GO. It is not surprising that the fluidity increases with growth of W/C for all tested samples. Interestingly, the fluidity shows a positive growth with the increase of W/C, except for the specimens with 0.2 wt% GO. That is to say, the correlation between fluidity and W/C is positive linear, and becomes nonlinear (quadratic) for high GO concentration (≥0.2 wt%).

Effect of W/C on the fluidity of cement paste: (a) fluidity of GO/CC under W/C = 0.3, 0.35, and 0.4 and (b) linear fit of fluidity of GO/CC under W/C = 0.3, 0.35, and 0.4. W/C: ratio of water to cement; GO: graphene oxide; CC: cement composite.
On the other hand, Figure 5(b) shows the linear correlation between GO concentration and fluidity can be strengthened with the increase of W/C. The linear coefficient of fluidity is 0.90, 0.93, and 0.98 for cement paste with W/C of 0.3, 0.35, and 0.4, respectively, which means the higher W/C the better linear correlation between the content of GO and fluidity. The inter-particle friction phenomena have been identified as the root causes for decreasing workability. 21 Water molecule is the main component to drive the movement of solid particles in the cement at a given content of superplasticizer. The water films on the surfaces of cement particles and GO will become thicker when W/C increases, resulting in lower friction among the cement particles and GO with ample lubrication.
Effect of W/C on the compressive strength of cement paste
Figure 6 shows the effect of W/C ratio on the compressive strength of GO/CC after 28 days of curing. For the specimens of W/C = 0.3, it can be observed that GO/CC shows lower compressive strength than the control specimen, except the samples of 0.05 wt% GO. In contrary, the specimens with W/C = 0.35 indicate higher compressive strength than the control ones, except the samples with 0.2 wt% GO. Similarly, the compressive strength of specimens with W/C = 0.4 are all higher than that of the control. The results show that the number of GO concentration, which improves the compressive strength of cement paste grows with the increase of W/C. That is to say, increasing in W/C can promote the enhancement on the compressive strength with higher content of GO. The compressive strength has a positive relationship with the dispersion of GO in the cement matrix, which is closely related to the fluidity of cement paste. The dramatical increasing of W/C in fluidity provides more free water to lubricate not only among the cement particles but also between the GO sheets, improving the dispersion of GO in the cement matrix. Furthermore, W/C cause more obvious effect on the specimens with high GO content such as 0.2 wt%, because higher content of GO needs to absorb more water molecules to wet their surface than the ones with less GO. It also can be seen in Figure 6 that the increasing percentage in compressive strength for the specimen with 0.2 wt% GO varies from −10.71% (W/C = 0.3) to −10.43% (W/C = 0.35) and, finally, reaches 2.64% (W/C = 0.4), which attributes to lower W/C that form more microporous structures in the cement matrix under worse fluidity, thus causing decrease of compressive strength.
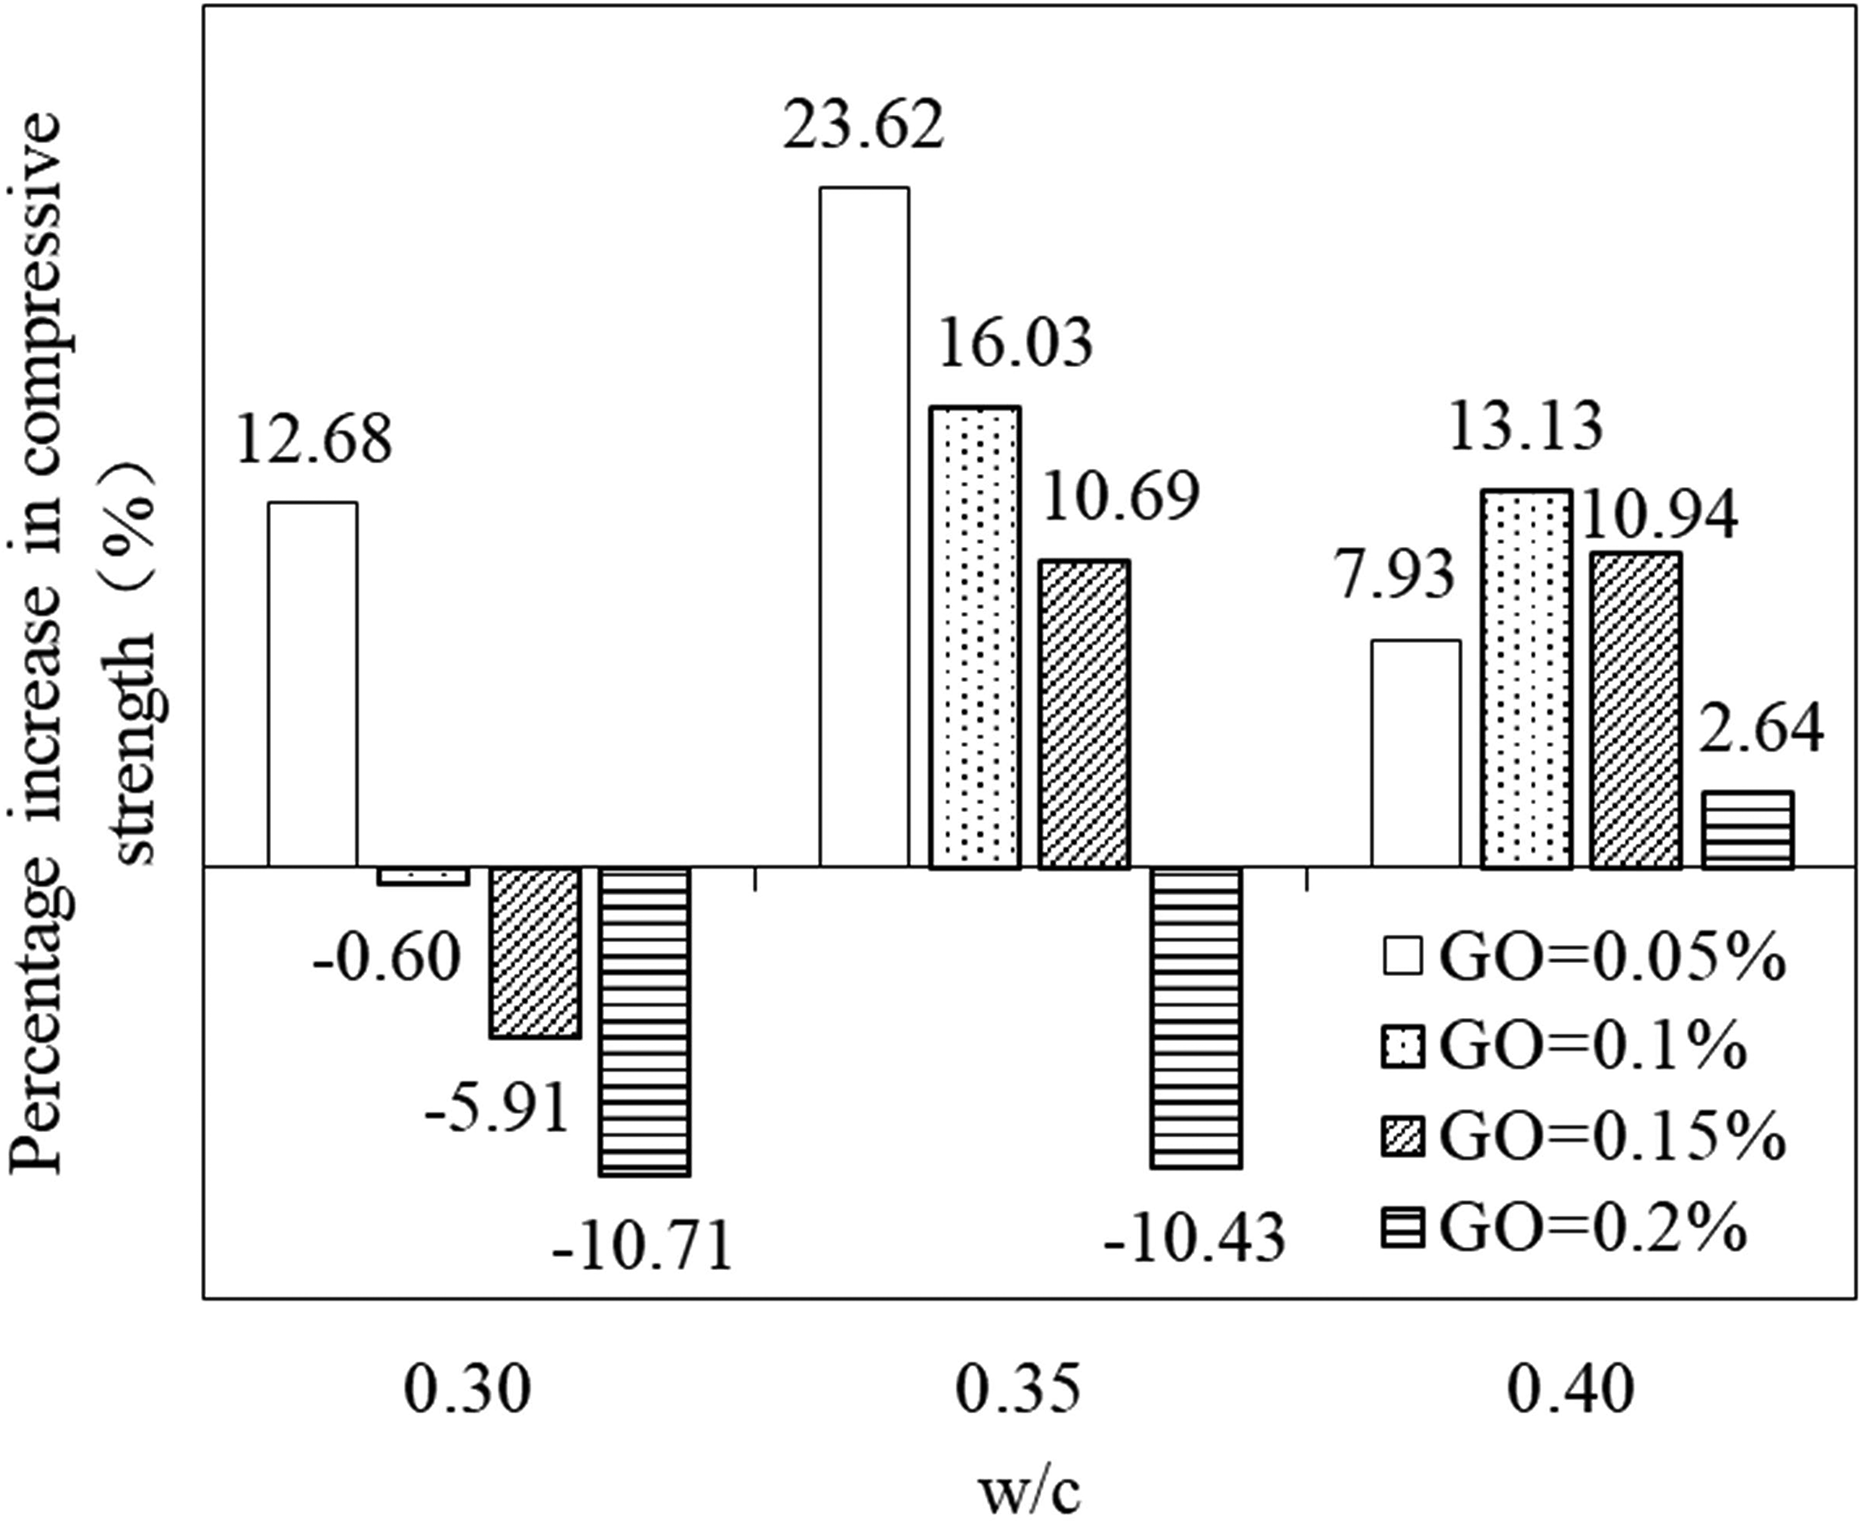
Percentage increase in compressive strength of GO/CC with respect to the control samples. GO: graphene oxide; CC: cement composite.
Therefore, according to the positive linear correlation between fluidity of GO/CC and W/C, a simple and flexible method is found, that is, just regulating the value of W/C to achieve wanted fluidity while maintaining or even improving the compressive strength of cement paste. Raising W/C to increase the fluidity of GO/CC is easier and more efficient in comparison with the method in previous studies by mixing 20 wt% fly ash into the GO-cement system. 23
Effect of GO on crystallinity and hydration behavior of cement paste
Figure 7 shows the XRD patterns of the control and GO/CC samples with different GO concentrations (0.05, 0.1, 0.15, and 0.2 wt%) after 28 days of curing. The specimens with 0.4 W/C are selected here. It can be seen that there is no obvious difference in the crystal type of the hydration product between the control and the GO/CC specimens, which means GO has no chemical reaction with the hydration products. As same as OPC, the hydration products of GO/CC are mainly composed with ettringite (Aft), calcium hydroxide (CH), calcium silicate hydrate (C–S–H), Calcium carbonate (CaCO3), and so on. CH is the major crystalline phase of cement and is generally used to measure the degree of hydration. The peaks of CH are at 18.3°,34.2°,47.1°, 50.8°, 4,19 whose intensities generally increase with the rising concentration of GO. Moreover, we can also see that the intensities of peaks caused by other crystals in GO/CC, such as C–S–H and Aft for, are higher than those in control specimen. These results suggest that GO promotes the hydration rate of reinforce cement systems. It is also found that the diffraction peaks of CaCO3 at 29.4° becomes higher when the concentration of GO increases. That means increasing the GO concentration leads to higher degree of carbonization for cement paste. On the one hand, these results can be explained by the catalysis reactant of GO sheets on cement hydration. 31 –OH, –O–, and –COOH on a GO sheet would generate growth sites for hydration products by reacting preferentially with tricalcium silicate, tetracalcium aluminoferrite, dicalcium silicate, and tricalcium aluminate. 32,33 On the other hand, the functional groups can provide water storage and water transport channels for the hydration of cement by absorbing free water, which accelerates the reaction between the cement particle and the water molecule.

XRD patterns of GO/CC with different concentrations of GO at W/C = 0.4. XRD: X-ray diffraction; GO: graphene oxide; CC: cement composite; W/C: ratio of water to cement.
Effect of GO on microstructure of cement paste
Figure 8 shows the SEM microstructural morphologies (5000×) of the control and GO/CC samples with 0.4 W/C under 28 days of curing. The concentrations of GO are 0.05, 0.1, 0.15, and 0.2 wt%, respectively. It can be seen from Figure 8(a) that GO has a wrinkled surface, which is conducive to a strongly bond of it with cement particles. Figure 8(b) shows the SEM image of a cement paste without GO, and it is clear from the white circles that there are many holes, macroscopic cracks, and micro cracks, which make the microstructure loose and porous. With the addition of 0.05 wt% GO, as shown in Figure 8(c), holes and cracks decrease, and the microstructure becomes more regular than that of the control specimen in Figure 8(b). The cracks or holes can almost not be observed in Figure 8(d) when the content of GO is 0.1 wt%, and the compressive strength reaches the maximum value at 0.4 W/C. The microstructure becomes compact and cracks or holes are much smaller when the concentration of GO exceeds 0.15 wt%, as shown in Figure 8(e) and (f). On the one hand, the size of holes and pores in the cement paste becomes small and uniform when the compressive strength reaches to higher value since the more GO is added. 25,34,35 On the other hand, the initiation and propagation of cracks are prevented because of the strong interfacial bonding between GO and the cement matrix. 36 Thus, the compressive strength of the composite is obviously enhanced as the microstructure becomes more compact when the content of GO increases. Lower fluidity of the cement pastes when GO concentration exceeds 0.15 wt% also creates cracks and holes in the cement matrix. Meanwhile, a higher concentration of GO aggravates the drying shrinkage of the cement paste, 29 which also makes the microstructure loose.
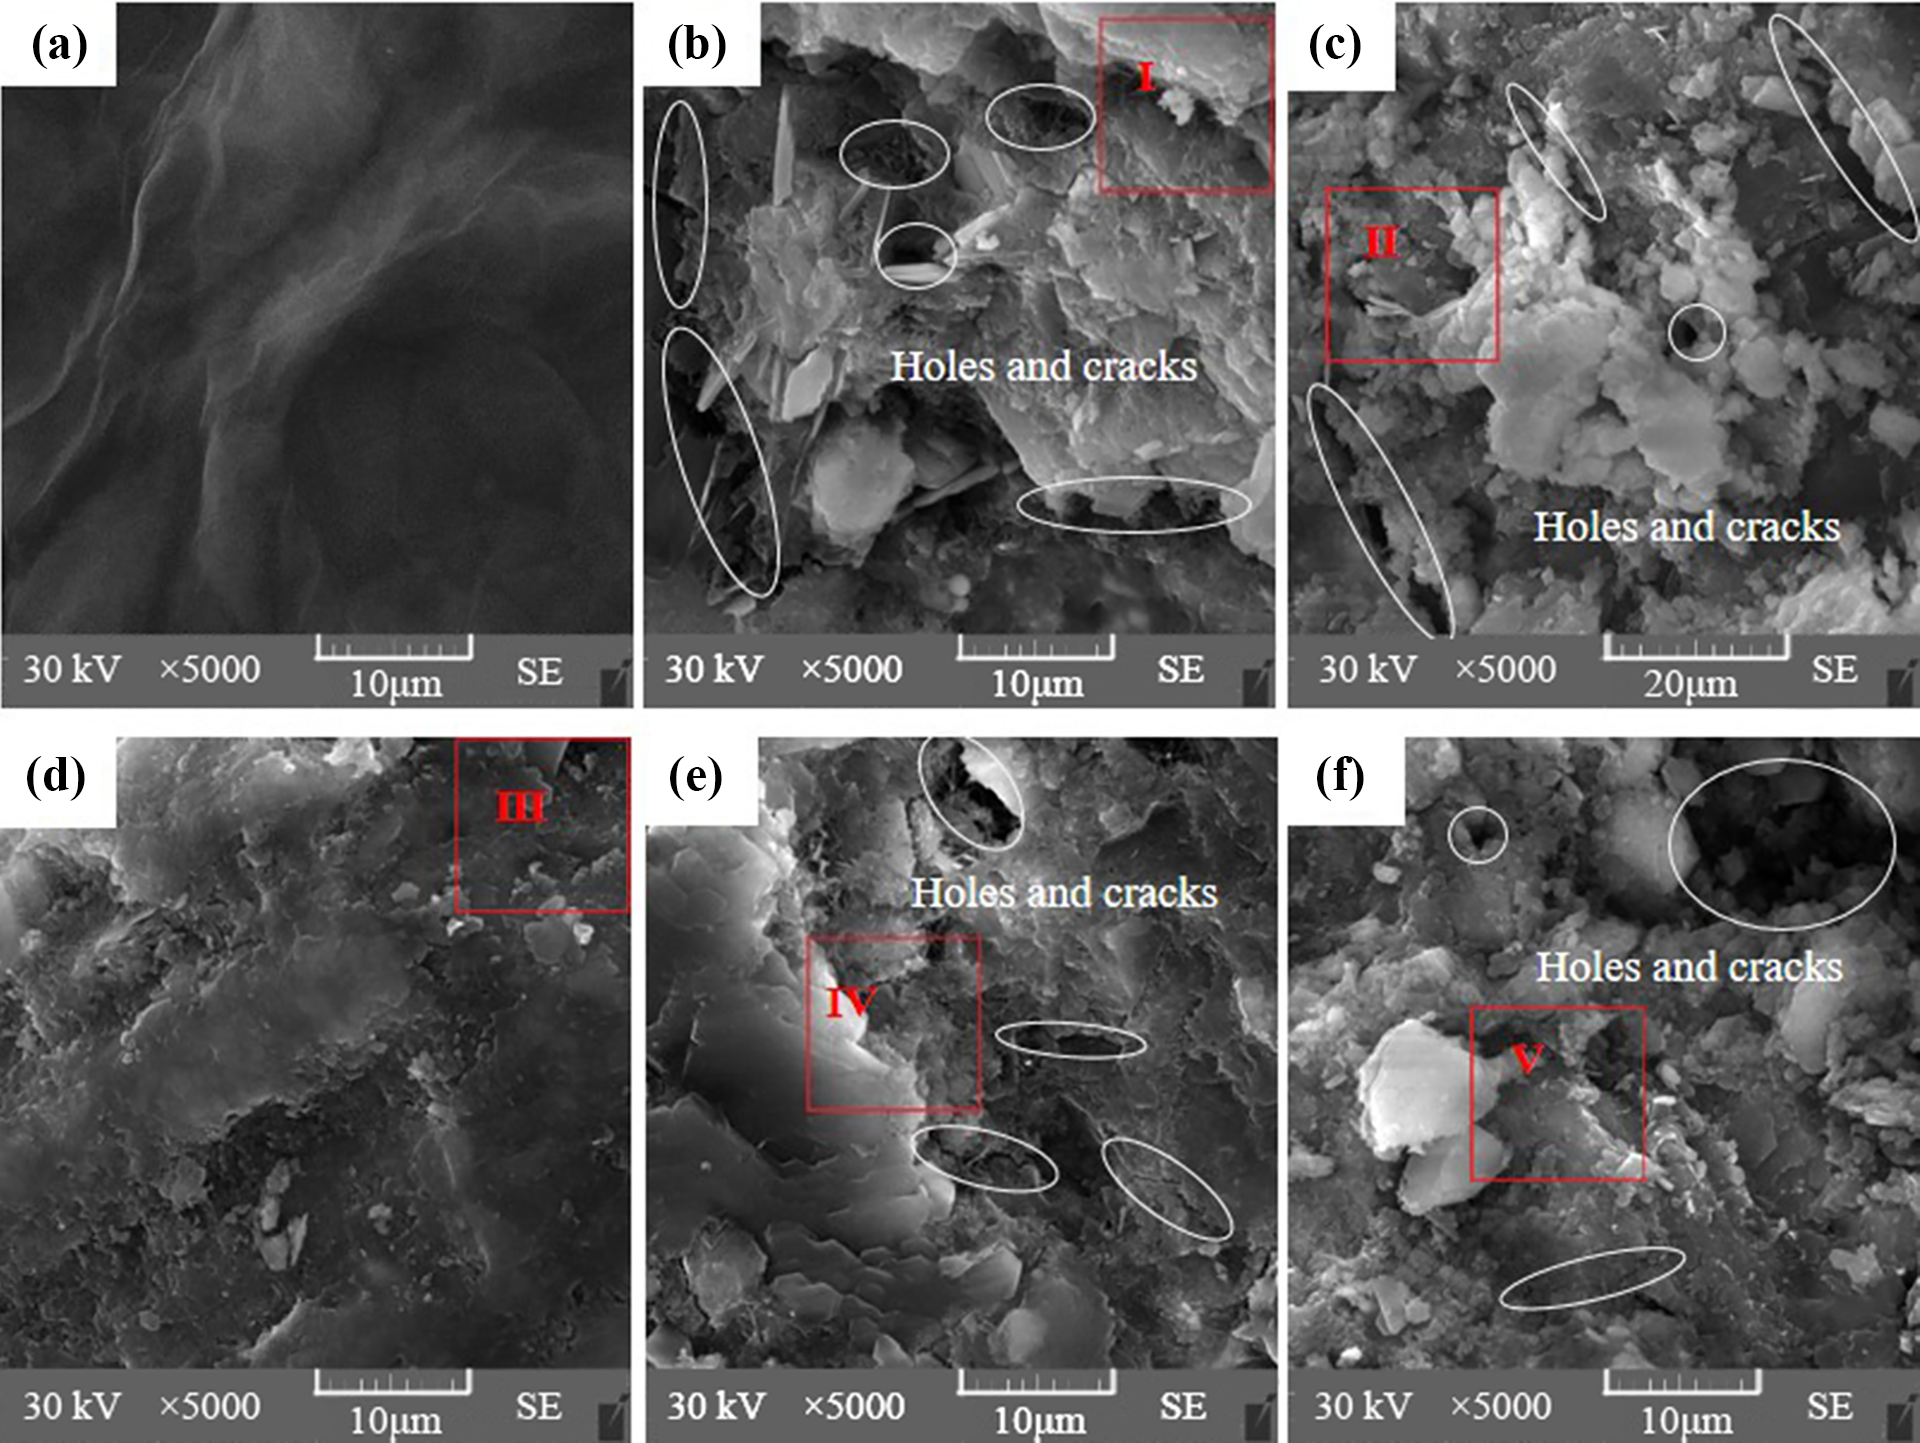
(a) SEM images (×5000) of pure GO, and cement paste with different concentrations of GO: (b) plain-0.4; (c) 0.05GO-0.4; (d) 0.1GO-0.4; (e) 0.15GO-0.4; and (f) 0.2GO-0.4. SEM: scanning electron microscopy; GO: graphene oxide.
To investigate the process of regulating hydration products forming compact microstructure by GO, the microstructural morphologies of selected areas (red rectangle) in Figure 8 are zoomed out (10,000×) and shown in Figure 9. It can be found in Figure 9(a) that the distribution of hydration products for control specimen is disorganized. Many irregular needle-like crystals form in the cracks and holes of the cement matrix and only a little quantity of plate-shaped crystals is observed, which causes the loose microstructure and low compressive strength. However, many small but adjacent plate-shaped crystals begin to appear and some of those have already connected with each other in the cement matrix after 0.05 wt% GO was added in Figure 9(b). The needle-like crystals decrease here, and the arrangement of hydration products becomes more regular and denser than the control sample in Figure 9(a), resulting in an enhancement of compressive strength. When the GO concentration is increased to 0.1 wt% in Figure 9(c), it can be seen that a large number of the dispersed and adjacent plate-shaped crystals have connected and assembled into a regular and dense microstructure, attaining the densest microstructure and highest compressive strength. If the concentration of GO is further increased and exceed to 0.15 wt%, as shown in Figure 9(d) and (e), the plate-shaped crystals with larger size and many small plate-shaped crystals growing on the hydration products are found. Meanwhile, more needle-like crystals are observed owing to the increase of cracks and holes, as cracks and holes will provide more space for the growth of needle-like crystals. However, their messy distribution causes looser microstructure and lower compressive strength of the cement paste than those in 0.1GO-0.4.

SEM images (×10,000) of cement paste: (a) plain-0.4; (b) 0.05GO-0.4; (c) 0.1GO-0.4; (d) 0.15GO-0.4; and (e) 0.2GO-0.4. SEM: scanning electron microscopy; GO: graphene oxide.
Composition analysis of hydration crystals of GO/CC
From the above results, it can be found that the compressive strength significantly increases by the compact microstructure constituted with the plate-shaped crystals. To further investigate the reinforcement effect of GO/CC, the element composition of plate-shaped crystals was obtained with EDS for the control sample and 0.1GO-0.4 specimen, which possesses the maximum compressive strength at 0.4 W/C. The hydration products of the control specimen are messy and irregular, so we selected two points of the small amounts of plate-shaped crystals as analysis objects, marked as spectrum 1 and spectrum 2 in Figure 9(a). For 0.1GO-0.4, the hydration products are almost the plate-shaped crystals connected with each other; hence, we randomly selected two points on them, marked as spectrum 3 and spectrum 4 in Figure 9(c). The results of composition analysis are shown in Figure 10. It can be found for the control specimen that the element percentage of hydration products of spectrum 1 and spectrum 2 are close to C–S–H and CH, respectively. The element percentage of plate-shaped crystals of spectrum 3 and spectrum 4 for 0.1GO-0.4 are also close to C–S–H and CH, respectively. Unlike the control sample, the microstructure of 0.1GO-0.4 exhibits that a large number of C–S–H and CH are closely connected and overlapped with each other, resulting in the very dense plate-shaped microstructure. The results indicate that GO can promote the formation of CH and C–S–H during the hydration reaction, which is consistent with the results of XRD. It is mostly due to the promoting effect of GO on the hydration rate of the cement paste. The results also show that GO can regulate the growth of CH and C–S–H at an appropriate concentration, improving their connection to form an extremely compact and regular microstructure of the cement matrix, contributing positively to the improvement in compressive strength of the cement paste. This is mainly because of the cross-liking interactions between GO and Ca2+, 6 which makes GO to serve as a template thus providing growth sites for CH and C–S–H in favor of their growth and connection with each other.

EDS spectrum and element composition of 0.1GO-0.4: (a) Spectrum 1; (b) Spectrum 2; (c) Spectrum 3; and (d) Spectrum 4. EDS: energy dispersive X-ray spectrometer; GO: graphene oxide.
Combined with the results of XRD, we can find that GO promotes not only the formation of CH and C–S–H, but also the growth of Aft. The needle-like crystal in the microstructure of cement pastes is Aft; however, it is hard to be observed in GO/CC because C–S–H can fill in the framework formed by CH and Aft crystals. Moreover, the denser microstructure of GO/CC cannot provide enough space for Aft to grow. The filling effect of C–S–H will be further promoted by the growth sites of C–S–H on GO, and it can reach the optimum level when GO is uniformly dispersed in the cement matrix at its optimal concentration. Therefore, the compact plate-shaped microstructures are constituted of not only connected CH and C–S–H but also the wrapped Aft.
Conclusion
In this article, GO/CC with varying GO concentrations and W/Cs are prepared, and the workability, mechanical strength, and microstructures of GO/CC are experimentally investigated. Based on the experiment results, the following conclusions can be drawn:
The fluidity of cement pastes is very sensitive to GO concentration and W/C. The experimental results show a noticeable inverse correlation between the concentration of GO and fluidity, and positive linear correlation between W/C and fluidity, except GO concentration is high (≥0.2 wt%). Thus, adjusting an appropriate value of W/C and GO concentration is a flexible and efficient method to achieve the wanted fluidity of GO/CC composite.
The compressive strength of GO/CC is obviously sensitive with GO concentration. The highest compressive strength is obtained when GO concentration takes an appropriate value at a fixed W/C ratio. Both more and less GO content can lead to lower compressive strength.
From the results of SEM, it is observed that appropriate content of GO can regulate the formation of plate-shaped crystals in the cement matrix and obtain compact microstructures, which enhances the compressive strength of GO/CC. This conclusion is corresponding to the compressive strength test results, since the compact microstructure could not be observed when GO content is lower or higher.
According to the element composition of plate-shaped crystals obtained by EDS, it is found that the compact and regular microstructure is mainly formed by close connections and overlaps of CH and C–S–H. The analysis method combining SEM, EDS, and XRD indicates that GO can not only promote the formation of CH and C–S–H during the hydration reaction but also increase the Aft, which is wrapped in the cement matrix.
Footnotes
Declaration of conflicting interests
The author(s) declared no potential conflicts of interest with respect to the research, authorship, and/or publication of this article.
Funding
The author(s) disclosed receipt of the following financial support for the research, authorship, and/or publication of this article: This work was supported by National Natural Science Foundation of China (NSFC) [Grants Nos 11562010 and 11962009].