
Abstract
The present study investigates a chemical oxidation method for graphene oxide (GO) synthesis with a facile modification in the Tour method. The study aims to optimize the modified synthesis process with a reduced amount of acid intercalants, shortening the production time and improving the quality of GO for large‐scale production of graphene derivatives. The present study results show a reduction in acid reagent usage and processing time by approximately 70% and 90%, respectively, compared to the Tour method, and the final process yield exhibited a significant improvement of approximately 114% (ranging from 77% to 188%) for the modified method as compared to the Tour method. Finally, synthesized GO samples are characterized using XRD, FTIR, and UV‐Vis spectroscopy. The GO crystalline structure analysis revealed an interlayer spacing thickness of up to 0.82 nm, which is attributed to higher oxygenated functional groups between layers. Additionally, the synthesized GO exhibited an estimated crystallite size of ∼8 nm with approximate number of layers of 10 ± 1, which is significantly low compared to precursor graphite having 55 ± 3 nm crystallite size and an estimated number of layers around 165 ± 3. The study also highlighted the impact of oxidation parameters, namely, processing temperature, time, and graphite inputs, on produced GO output product yield, oxidation level, crystallite size, and an average number of layers, where it is confirmed that the processing temperature has obvious effects as compared to other parameters.
1. Introduction
Graphene oxide (GO) is one of the nanocarbon materials generally processed and synthesized using graphite as initial material, and it is high in demand in present time due to its incredible electrical, thermal, and mechanical properties. Nanocarbons produced from graphite precursors are quite interesting nanomaterials for various advanced nanotechnology‐based applications. Graphite is basically composed of many single atomic graphene layers stacked together by van der Waals forces, and exfoliating these layers into single, few, or multilayer results in graphene sheets and other carbon‐based nanomaterials [1]. Over the last few decades, two‐dimensional (2D) carbon‐based materials, including graphene, carbon nanotubes (CNTs), and carbon quantum dots, have become the main interest of research communities as well as production industries due to their unique properties, huge versatility, and immense technological potential for numerous applications such as next‐generation electronics, energy devices, and nanotechnology‐based applications.
In particular, graphene, a single layer of sp2‐hybridized carbon atoms arranged in a 2D honeycomb lattice, has attracted enormous attention worldwide due to its extraordinary combination of properties, including superior mechanical strength, intrinsic electron mobility, high thermal and electrical conductivity, good optical transmittance, great electron transport capability, large perm selectivity, and large specific surface area properties [2]. However, scalable production of high‐quality, large‐area, and defect‐free graphene sheets remains a major challenge. Several synthesis methods have been developed to produce graphene. For instance, chemical vapor deposition (CVD) and epitaxial growth methods are adapted for high‐quality graphene production. However, they are expensive, energy‐intensive, low‐efficiency, and unsuitable for mass production [3]. Recent theoretical and computational studies have provided important insights into these challenges, particularly regarding atomic‐scale mechanisms of graphene nucleation and growth. Tau et al. proposed the use of alternative liquid aromatic hydrocarbon precursors, especially toluene and to a lesser extent o‐xylene and 1,2,3‐trimethylbenzene as most favored ones, which enable low‐temperature CVD synthesis while preserving graphene quality [4, 5]. In addition, their study provided technological advantage over conventional growth from methane based on density functional theory calculations and molecular meta‐dynamics simulations.
Yet the generation of these 2D nano graphene sheets from graphite is quite complex, time‐consuming, expensive, and unsuitable for large‐scale nano graphene production. Alternatively, the graphene derivative material including GO and reduced graphene oxide (rGO) can be produced in scalable and cost‐effective manner. Even though its properties are not comparable with pure nano graphene sheets, its derivative GO could be easily produced by chemical oxidation and exfoliation of bulk graphite structures. GO synthesized through the said method consists of a hybrid of stacked layers of graphene and several oxygen‐containing functional groups attached onto graphene surfaces and edges. Functionally, GO can be considered as a potential precursor for scalable nano graphene production with the reduction of extensive oxidative functional groups from its structure through chemical reduction, electrochemical reduction, photoreduction, or thermal annealing reduction methods [6]. In addition, GO by itself has a huge potential in nanocomposite formulations and nanotechnology applications in various areas such as anticorrosion coating [7], friction stabilization and wear minimization [8, 9], photocatalysts [10], actuation [11], humidity sensor [12], energy conversion and storage [13], membrane for gas separation and water purification [14], biodiesel synthesis, biomedicine, and biotechnology [15], drug delivery in cancer treatment [16–18], and so on. More recently, GO‐based nanofluids have demonstrated significant improvements in heat transfer and lubrication efficiency in turbine systems [19].
As GO becomes a multifunctional nanomaterial and more important in making graphene, researchers are looking for new ways to improve GO yield, structural quality, and performance. The synthesis of graphite oxide was demonstrated first ever by Brodie [20] (known as the “Brodie method”) using chemical oxidation of graphite with potassium chlorate and the strongest fuming nitric acid at 60°C for 4 days. Afterward, Staudenmaier [21] (known as the “Staudenmaier method”) included concentrated sulfuric acid by keeping same recipe as of Brodie method, and the result was a simpler method to synthesize GO with better yield. However, these two methods used volatile reagents, which highlight its drawback as an unsafe procedure (explosion risk), environmental hazard, and time‐consuming process in present time. Later, a famous process modification was made by Hummers and his coworkers known by the name Hummers’ method [22]. In the Hummers’ method, graphite oxidation process was performed using sulfuric acid, sodium nitrate, and potassium permanganate at a temperature of 45°C for approximately 2 h duration. But the process generated toxic gas NOx (NO/NO2) during oxidation due to one of the used input materials, i.e., sodium nitrate (NaNO3). In addition, the remaining Na+ and

Furthermore, Tour and his coworkers executed a comparative analysis of three oxidation methods, including original Hummers’ method, modified Hummers’ method, and improved Hummers’ method (i.e., Tour method). The study found that the adjustments in some parameters are beneficial in the modified Hummers’ method experimental procedure like intercalant and oxidant ratios, processing temperature, and reaction duration. In the same study, it was also found that the efficiency and yield of improved Hummers’ method improved by excluding sodium nitrate (NaNO3) and introducing phosphoric acid (H3PO4) as a co‐intercalant along with sulfuric acid (H2SO4), increasing potassium permanganate (KMnO4) as an oxidant, and changing process parameter such as solution oxidizing at 50°C for 12 h, followed by quenching, washing, and centrifugation steps to obtain purified GO. The Tour method was found to be a remarkably safe oxidation process, with higher oxidation efficiency, improved structural integrity with fewer defects, and higher product yield compared to Hummers’ and modified Hummers’ methods. Figure 1 illustrates the reaction conditions of the modified Hummers’ method and improved Hummers’ method, which were adopted in Tour’s experimental procedures [23].
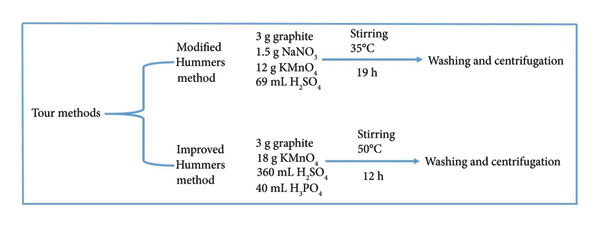
Reaction conditions for GO synthesis adopted in Tour’s study.
Despite its advantages, the Tour method expends 400 mL of total intercalating agents (H2SO4/H3PO4 in a 9:1 v/v ratio) for oxidizing 3 g of graphite with a process duration of approximately 12 h, indicating the requirement of 130 L of acid for 1 kg of graphite oxidation, which shows 478% higher amount of acid consumption compared to conventional Hummers’ method and correspondingly long process duration. So, there is huge amount of acid involved in the process which is directly responsible for increase in the production cost of GO, while at the same time, it increases wastage and thereby requires an additional waste acid treatment because the acid remains at the end of purifying stage of GO. Consequently, there are some studies conducted where the Tour method is further optimized for less acid concentration with optimal time and temperature variables, excluding H3PO4 intercalants [24–27].
After the Tour method, Chen et al. further developed the modified version of the Tour method, where H3PO4 was not involved in the process and the considered components’ dosages used in the process were 3 g graphite, 70 mL H2SO4, and 9 g KMnO4 in the ratio of 1:23.33:3 in the reaction formula [24]. This modification reduced the usage of acid intercalant by 82.5% successfully compared with the Tour method. Later, also in their subsequent works, Chen et al. further reduced the acid intercalant, which is around 23 mL for 1 g graphite oxidation process by keeping the method same as opted in their previous work [25, 26]. Later, Jayawardena et al. came up with a different approach from all previous works of Chen et al. by increasing the amount of H2SO4 intercalant that aimed to eliminate explosion risk associated with using low intercalant levels and to enhance the oxidation capability of the process [27]. Specifically, the study utilized 100 mL of H2SO4 for 1.5 g of graphite, which shows a substantial increase in the amount of H2SO4 compared to Chen et al.’s modifications. However, Jayawardena et al.’s study shows only a 30% improvement in oxidation efficiency compared to the Tour method.
A number of other works with similar process opted in the Tour method were also reported in the literature about cost‐effective GO synthesis by cutting off H3PO4 and introducing other chemicals to reduce the acid intercalant amount, which can directly bring down the total production cost of GO preparation. Laven‐Lopez et al. conducted experiments and optimized to produce GO that should be suitable for industrial scalability and cost reduction. The optimized method excluded H3PO4 from the reaction, increased the graphite amount from 3 g (as in the Tour method) to 15 g in the input stage, and reduced the oxidation time from 12 h (as in the Tour method) to 3 h to improve production efficiency and lower production costs [28]. Luo et al. also investigated the method with less acid utilization for GO synthesis to minimize waste acid treatment costs as well as the environmental impact, where they used 95 mL H2SO4 and 30 g KMnO4 for 5 g graphite oxidation. The study shows that 19 mL acid intercalant is required for 1 g graphite oxidation. The study significantly reduced acid usage compared to other works; however, the lower amount of acid input posed potential safety risks, particularly the risk of explosion due to insufficient acid intercalation. And this particular risk was handled by controlling the reaction temperature using dry ice in their study [29]. Hanifah et al. also substantially reduced the usage of acid intercalant in GO oxidation process, where they performed experiments using 3 g of graphite input with 65 mL of H2SO4 and 9 g of KMnO4 [30]. On the other hand, Le et al. performed the acid intercalation in a two‐step process, firstly 50 mL of H2SO4 with 5 g of graphite, followed by 100 mL of H2SO4 and 10 g of KMnO4 addition, providing 8 h of oxidation period [31]. Further emphasizing cost reduction, Zhu et al. reported an improved Hummers’ method for producing GO using significantly reduced acid (H2SO4) concentrations with certain optimized process ingredients (graphite:KMnO4:H2SO4 = 3 g:9 g:41 mL) [32]. These studies suggested that H3PO4 can be excluded to reduce cost, but at the same time, these studies do not invalidate some of its systematic functions in the GO synthesis claimed by the inventor of the Tour method, that the incorporation of H3PO4 intercalant acid improves graphite oxidation capability, raises production yield, and minimizes defect formation capability on the basal plane of GO. Particularly, Marcano et al. reported that adding H3PO4 produced GO with fewer defects and greater interlayer spacing (∼9.5 vs. ∼8 Å for Hummers GO). While Raman, Fourier transform infrared (FTIR), and ultraviolet‐visible (UV‐Vis) spectra were broadly similar across methods, XPS confirmed that H3PO4‐based GO was more oxidized while retaining structural integrity [23].
In contrast, Yadav and Lochab observed a higher Raman I‐D/I‐G ratio which increased from graphite to GO and exhibited higher value in GO (0.93) produced by improved Hummers method compared to Hummers (0.83), suggesting increased defect densities [33]. Thus, a higher I‐D/I‐G ratio in H3PO4 systems likely reflects controlled functionalization rather than destructive oxidation. Defects in GO are commonly assessed using the Raman I‐D/I‐G ratio, which reflects disruption of sp2 domains. However, Raman cannot distinguish between functionalization and destructive imperfections. Furthermore, it is very difficult to fully quantify the structural changes, such as vacancies, holes, or basal plane edge disorders. The advantage of the improved method by Marcano et al. [23] can be outlined as having better structural integrity with fewer defects, which could be qualified by peak change, such as peak positions, width, and intensity variations across X‐ray diffraction (XRD), Raman, FTIR, XPS, and UV‐Vis spectra.
Accordingly, here in this work, some modifications in the Tour method are done and it is revealed that facile synthesis method of GO from graphite is possible with less acid intercalant amount without excluding the use of H3PO4 in the reaction system with the formulation of H2SO4/H3PO4 in the ratio of 6:1. The synthesis process involves intercalation of graphite using acid intercalations, formation of graphite oxide through inclusion of oxidizing agent, and exfoliation of the oxidized graphite into GO using distilled water (DIW), followed by washing impurities and sonication. This work presents an effective and efficient method which is a modified version of the Tour method for the synthesis of GO with less amount of reagent involvement, and the process is suitable for large‐scale production; hence, the present method automatically reduces the cost of production. Different analytical characterization techniques including XRD, FTIR, and UV‐Vis were used to analyze the effect of input amount, time, and temperature variables on structural, chemical, and optical characteristics of the developed GO.
2. Materials and Methods
2.1. Materials
For GO synthesis, materials were carefully selected to ensure the reliability and reproducibility of the results. The process key components included are chemicals in the powder or liquid form, all sourced from reputable suppliers; graphite powder (100 Mesh, 99% purity), sulfuric acid (H2SO4, 98% assay), phosphoric acid (H3PO4, 98% assay), hydrogen peroxide (H2O2, 30% weight/volume), and hydrochloric acid (HCl, 35% concentrated) were acquired from Finchem Laboratory Reagent, USA, while potassium permanganate (KMnO4, 99.5% purity) powder was obtained from Neo Lab Life Science Co., USA. Ethanol is procured from Sheba pharmaceutical industry, Ethiopia, and the DIW is produced in a laboratory using a reverse osmosis water system using the PURE RO 130+model.
2.2. Experimental Method for GO Synthesis
The present study is about the development of an efficient and better yielding synthesis process for GO material using a chemical oxidation method, which is a facile modification of the Tour method through careful study and adjustments of intercalant ratios and processing variables such as oxidation temperatures and reaction duration. The process begins with intercalation of graphite layers using acid intercalants, namely, H2SO4 and H3PO4; then oxidation of intercalated graphite surfaces takes place by introducing KMnO4 oxidant, followed by exfoliation, washing, and sonication to obtain highly pure GO. Additionally, rGO is produced using the thermal annealing reduction method for structural comparative analysis. The key transformation stages and processing parameters of the present GO synthesis method are illustrated in Figure 2.

Schematic representation of GO synthesis used in the present study.
In detail, a 6:1 ratio of H2SO4 and H3PO4 acid mixture is maintained in a borosilicate glass beaker at room temperature (RT). The acid mixture is further placed in an ice bath and stirred with the help of magnetic stirrer at 370 rpm approximately for 0.5 h (or 30 min). The experimental parameters which are varied here are raw graphite input amount, chemical amount, process temperature, and reaction time, and their sequential involvement in the processing is highlighted in Figure 3 (top: A to C). The graphite (1 or 5 g) is initially added as per the respective experiment into the stirred acid mixture to initialize the intercalation process of the acid mixtures between graphite layers, followed by gradual addition of KMnO4 as an oxidizer into acid‐intercalated graphite mixture in a 3:1 w/w ratio of KMnO4:graphite. Afterward, the ice bath is removed, and the system temperature is controlled according to experimental plan under high‐speed stirring process carried out at 750 rpm.

Illustration of the applied procedure for the GO synthesis process.
In case of transition stage from graphite oxide to GO, the stirring of solution after removal from ice bath is playing a crucial role, where the stirring at high speed is done with varying process temperatures in different experiments ranging from 35°C to 95°C with increment value of 20°C and corresponding reaction durations of 3, 2, 1, and 0.5 h, respectively, for the oxidation of 5 g graphite, and they are named as Exp1 to Exp4. Exp5 is carried out at 95°C for 0.5 h using 1 g of graphite input following the same procedure. Subsequently, the process continued with the exfoliation of the oxidized graphite into GO. For this purpose, 230 and 40 mL of deionized water are carefully added for the 5 and 1 g amount of graphite oxidation process, respectively. The reaction mixture is then continuously stirred for 0.5 h while maintaining the same process temperature of 95°C for all experimental procedures. The detailed processing parameters of all considered experiments are summarized in Table 1.
Summary of processing parameters for all considered experiments for GO synthesis.
Once the process completed, magnetic stirrer and heater are stopped and the beaker is removed from the heating/stirring platform. After that, 690 mL of DIW and 25 mL of H2O2 are added in the cases of Exp1, Exp2, Exp3, and Exp4, whereas 140 mL of DIW and 5 mL of H2O2 are added in Exp5 to help in further exfoliation process. Finally, the resulting solution is diluted with 20% HCl and continuously washed using DIW and ethanol. The purified GO is then sonicated using the BANDELIN electronic DT 103H model ultrasonicator machine (50/60 Hz frequency and 560 W power) for 1 h duration and dried at 100°C in the muffle furnace for 32 h. The rGO is also produced through thermal annealing of GO in a muffle furnace at 450°C with a heating rate of 5°C per minute for 1 h. The sample was then allowed to cool inside the furnace until it reached RT. The color of the final solution is observed and found similar in all the experimental cases (a) to (e) in Figure 3 (bottom) for the experiments Exp1 to Exp5 except a little deviation in case of Exp5 which is represented by (e) and that is due to less amount of graphite.
2.3. Measurement of Synthesized GO Product Yield and Statistical Analysis
In present work, the yield of GO was determined as the ratio of dry mass of purified GO obtained to the initial mass of graphite used following the conventional practice of GO synthesis studies. The purification process was performed through repeated washing with deionized water, dilute HCl, and ethanol to remove impurities. After purification, the product is dried at 100°C in the muffle furnace for 32 h and then further dried at 60°C until constant weight to ensure complete removal of moisture before weighing. The yield is then calculated using the following equation:
Each synthesis experiment is repeated three times to assess repeatability. For each batch, five weight measurements were recorded, and yield values were expressed as mean ± standard deviation. This approach ensures statistical robustness and minimizes random error.
2.4. Characterizations of GO Samples
The characterization of all the prepared GO samples in the present experimental study was carried out to obtain the various characteristics of each sample, for which several analytical techniques were employed including XRD to analyze interlayer spacing, FTIR spectroscopy to identify functional groups, and UV‐Vis spectroscopy to evaluate optical properties of GO. The XRD patterns of prepared samples are examined by a high‐resolution X‐ray Diffractometer System (Drawell XRD 7000) equipped with Cu K‐α source (λ = 1.54 Å). The system has a scanning rate capacity ranging from 0.0012°/min to7 0°/min. The X‐ray power was set to 30 kV and 25 mA, and measurements were taken for 2θ range of 5°–80° with a scanning rate set at 0.02°/min. The FTIR spectra are obtained using the PerkinElmer Spectrum Two model in the wavenumber range of 4000‐400 cm−1. The UV‐Vis spectra are obtained using the PerkinElmer Lambda 25 model in the spectrum (wavelength) range of 190–1100 nm.
3. Result and Discussion
3.1. Analysis of the Effects of Intercalants/Oxidant Proportions, Processing Temperatures, and Processing Time on the Production Yield
The present study focuses on GO synthesis route expected to be more efficient and produce better yield using fewer acid intercalants and shorter production time, which aims to reduce production cost and at the same time tries to achieve scalable production yield. The precursor amounts are varied into two groups: 5 g graphite (for Exp1 to Exp4) and 1 g graphite (Exp5) as an input. These graphite inputs are oxidized using strong dual‐acid intercalant mixtures of H2SO4/H3PO4 in a 6:1 ratio, with volumes of 180:30 (in mL) for Exp1 to Exp4 and 36:6 (in mL) for Exp5, respectively, which corresponds to an acid intercalant consumption of 42 mL per gram of graphite oxidation. The oxidizing agent, KMnO4, is used in amounts of 15 and 3 g for the 5 and 1 g graphite oxidation process, respectively, maintaining a 3:1 (w/w) ratio of KMnO4:graphite. This experimental formulation successfully reduces the demand for acid intercalant and potassium permanganate oxidant. The ratio of dual intercalant acids (H2SO4/H3PO4) to graphite is reduced from 133.33:1 (v/w) used in the Tour method to 42:1 (v/w) used in present study, which shows approximately 3 times reduction in acid expense compared to the Tour method. Additionally, the KMnO4 to graphite ratio is reduced from 4:1 to 3:1 (w/w), further optimizing the resource usage.
Increasing temperature enhances the production yield of GO, even when the processing times are reduced. In Exp1, GO synthesized at 35°C for 3 h exhibited a yield of 136% and this was increased to 154% when the temperature was raised by 40°C while reducing the reaction time by 2 h. For better yield of GO, process time optimization is also required, as it is experienced that the longer process duration in Exp1 (3 h) yielded 136%, which is less compared to the Exp4 yield value of 145% with 0.5‐h process duration at a higher temperature. This also indicates that the reaction temperature has a significant effect on GO yield than reaction time. However, Exp2 synthesized GO at 55°C and 2 h process duration, which recorded a lower production yield than Exp1 GO output.
Regarding variation in graphite input, Exp5 process used 1 g graphite only and exhibited the highest yield of 188%, which is higher compared to Exp4 process using 5 g graphite and other chemical inputs accordingly with the same processing temperature and time conditions. Exp5 also showed higher yields compared to other synthesizing procedures, confirming that both graphite input amount and temperature significantly influence the product yield of GO. The increased product yield of GO at higher temperatures can be attributed to graphite’s higher thermal oxidation capacity. The comprehensive investigation of this work demonstrates that product yield is proportional to the interlayer spacing of the produced GO, as confirmed by the XRD results reported in the following section. This suggests that GO synthesis at higher temperature facilitates graphite oxidation by increasing the reaction rate of acid intercalants (H2SO4/H3PO4) with oxidant (KMnO4), which enhances the formation of oxygen‐containing functional groups, resulting in increased interlayer spacing and higher product yields.
Overall, the GO outcomes from experiments Exp1 to Exp5 are represented further as Exp1‐GO, Exp2‐GO, Exp3‐GO, Exp4‐GO, and Exp5‐GO, and yields for Exp1‐GO to Exp5‐GO are 136 ± 5%, 119 ± 2%, 154 ± 4%, 145 ± 2%, and 188 ± 3%, respectively, which demonstrate superior GO yields compared to Hummers’ method (40% yield) and modified Hummers’ method (140% yield) as reported in a study by Marcano et al. Additionally, the graphite amount, acid intercalators, concentration of oxidant, intercalant amount per gram of graphite oxidation, reaction temperature, reaction time, and product yields of GO prepared in the present study are compared with Hummers’ method, modified Hummers’ method, improved Hummers’ method (Tour method), and other reported works in the literature, as presented in Table 2.
Comparison of used graphite amount, intercalants, processing variables, and product yields of GO prepared in this study with previous reported literature and improved Hummers’ method.
An apparent kinetic analysis is carried out using yield–time–temperature data to elucidate the mechanistic role of temperature and time on the oxidation process. Reaction apparent rate constants (kapp) at their corresponding temperatures were analyzed using the logarithmic form of the Arrhenius equation:

The plot of ln(kapp) versus 1/T for the oxidation of GO at the temperatures of 35°C, 55°C, 75°C, and 95°C.
The Arrhenius analysis yielded a linear correlation with R2 = 0.973, confirming the applicability of the Arrhenius model for analysing GO synthesis kinetics. The rate constant increased markedly with temperature, reducing the required synthesis time from 4 h at 35°C to 1.5 h at 95°C. These results highlight the strong influence of temperature on the oxidation kinetics and provide valuable insights for optimizing GO synthesis conditions.
3.2. Crystalline Structure Characteristics of Produced GO
The structural changes including crystalline planes, diffraction patterns (peaks), angle positions, and interlayer spacing of prepared GO were analyzed using XRD. Additionally, the results are compared with those of the precursor graphite and synthesized rGO. The precursor graphite exhibited a characteristic XRD peak at (2θ) angle of 26.75° which corresponds to (002) lattice plane of the graphitic crystalline structure with an interlayer spacing (d‐spacing) of approximately 0.34 nm. The comparison of XRD peak of raw graphite (reference) and synthesized GO sample is presented in Figures 5(a) 5(b). In contrast, the synthesized GO samples from Exp1 to Exp5 displayed diffraction peaks between 10.8° and 11.5° value of (2θ), which corresponds to the (001) lattice plane of a hexagonal crystalline structure with interlayer spacing ranges from 0.71 to 0.82 nm. The diffraction angle decreases and the interlayer spacing increases for synthesized GO compared to reference raw graphite structure, which indicates the formation of GO. The increment in the interlayer spacing (d‐spacing) of produced GO is attributed to the intercalation of more oxygen‐containing functional groups within the layers and edges during oxidation process of graphite, which confirms the potential oxidation capability of the applied chemical oxidation procedures.

XRD structure of (a) raw graphite flakes and (b) typical GO.
(b)

Considering the variations in temperature and time variables from Exp1‐GO to Exp4‐GO, the interlayer spacing has the following order: Exp3‐GO > Exp1‐GO > Exp2‐GO > Exp4‐GO with slight differences. On the other hand, Exp5‐GO shows higher interlayer spacing compared to Exp4‐GO, which is synthesized with same temperature and reaction time but differs in graphite input amounts. Overall, Exp5 exhibited the highest inter layer spacing of 0.82 nm in synthesized GO compared to all other experiments, despite having a shorter processing time than other experiments, namely, Exp1, Exp2, and Exp3.
The XRD result confirms that GO can be synthesized at lower temperature of 35°C, and the peak sharpness of GO increases with rising process temperature. Moreover, peak sharpness is directly proportional to the GO formation capability in terms of interlayer spacing. Exp5 and Exp3, which have higher interlayer spacing, show higher peak sharpness in the reaction system as shown in Figure 6. In the present study, estimation of the average crystallite size and number of layers of the synthesized GO is performed using Scherrer’s model presented in equation (3) [36, 37] and further calculation.


XRD of synthesized GO with different experimental procedures (Exp1‐GO to Exp5‐GO).
Exp4 reveals the smallest average crystalline size and the lowest number of layers among all experimental procedures, even when its preparation procedure was done with high graphite inputs under short processing time duration. Exp4 resulted in an average crystallite size of 8 nm while the average number of layers in GO was found to be very less and that comes around 10, whereas other procedures resulted in 12–16 nm of crystallite size and 15–20 layers based on Scherrer’s model as presented in Table 3. These results confirm the significant formation of GO with lower crystallite size and reduced number of layers compared to the raw graphite flakes which initially had higher crystallite size (average 55 nm) and a greater number of layers (165 layers).
Peak positions, full width half maximum (FWHM) values, average interlayer spaces (d), average crystallite size (D), and average number of layers (N) in graphite and synthesized GO materials.
3.2.1. Instrumental Broadening and Strain Effects on Crystallite Size
A comprehensive analysis of strain and instrumental broadening was performed to determine crystallite size (D) and lattice strain (ϵ) accurately. Instrumental broadening contribution was corrected for each GO diffraction peak using Gaussian deconvolution using equation (5). This correction allowed reliable estimation of crystallite size and microstrain from both Scherrer and Williamson–Hall (W–H) methods, thereby minimizing overestimation caused by instrument‐related effects.
Here, β is the sample FWHM broadening, while β
m
and β
i
are the measured and instrumental FWHM values, respectively (in radians). The Scherrer equation, applied with the instrumental broadening corrected widths, yielded crystallite sizes (D) of 16.93 (∼17), 12.70 (∼13), 12.69 (∼13), 8.46 (∼8.5), and 16.92 (∼17) nm for Exp1‐GO to Exp5‐GO, respectively, indicating that the impact of instrumental broadening was negligible (< 0.2%). Since the Scherrer method attributes peak broadening solely to crystallite size and neglects strain effects, the W–H method is also considered to resolve size and strain contributions using equation (6), and lattice strain is estimated using equation (7).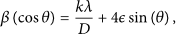

3.2.2. Solvent Influence on Crystalline Structure of GO
The XRD analysis further helped in revealing the GO’s functional group interaction with solvent molecules even under normal conditions due to its hydrophilic nature. In present study, 1 g of the GO sample (Exp5‐GO) is exposed to 20 mL of deionized water and ethanol for 3 min at RT and relative humidity of 78%. Dried GO samples with a 2θ position at 12.08° represented by (a) in Figure 7 shifted left side toward 8.67° and 8.84° of 2θ value when exposed to water and ethanol solvent, respectively, which indicates an increase in interlayer spacing from 0.73 to 1.0 nm as shown in (b) and (c) of Figure 7. This shift indicates intercalation of solvent molecules into the GO layers due to the interaction with functional groups present in the GO layers. And this effect results in a reduction in peak intensity and the appearance of more amorphous faces due to structural defects, which can be visualized in (b) and (c) of Figure 7.

Effect of water and ethanol solvents on typical GO result.
Previous studies have reported only slight peak shifts and minor d‐spacing changes when GO absorbs water molecules under atmospheric conditions with 58.2% relative humidity over different time variables. However, solvents such as ethylene glycol, dimethylformamide (DMF), and N‐methyl‐2‐pyrrolidone exhibited a greater impact on GO interlayer spacing than water molecules [38]. Rezania et al. also examined the GO interlayer spacing deviation on exposure to solvent but also pointed out that interlayer spacing increases with relative humidity [39]. Furthermore, solvent molecules have a considerable effect on interlayer spacing, indicating that small molecules can easily be intercalated into GO interlaminations. This phenomenon is attributable to the hydrophilic character of oxygenated functional groups generated between GO surfaces, further confirming the formation of GO.
On the other hand, removal of the oxygenated functional groups of GO leads to the right‐side shift in the 2θ angle of XRD peak, an increase in peak intensity, and a decrease in interlayer spacing due to the elimination of oxygenated functional groups from GO. The conversion of GO into rGO is an important method for changing its structural and functional properties to improve thermal conductivity, mechanical strength, and thermal stability for composite applications such as friction materials. The thermal reduction method of GO is a scalable and easy method, which successfully restores the sp2 hybridized carbon structure [40, 41]. In the present investigation, GO is thermally reduced at 450°C for 1 h using previously reported methods to produce a structurally stable rGO phase for comparative examination.
Several studies have investigated the effects of thermal annealing method on the structural change of GO. Saleem et al. examined that annealing of GO at 500°C caused the removal of normal (001) peak at 11.8°, followed by the appearance of the (002) peak at 25.5° in the XRD, indicating reduction of produced GO [41]. Alam et al. found that thermally reduced GO exhibited a highly crystalline (002) peak at 26.42° with a decrease in interlayer spacing [42]. Furthermore, Sengupta et al. examined GO annealing at temperatures ranging from 300°C to 450°C, where the gradual shift of the XRD peak from 12° to about 23° corroborated the degree of reduction, emphasizing that the thermal annealing process promotes the elimination of oxygen functional groups and facilitates graphitic layer restoration [43, 44]. Lei et al. investigated the effect of reduction time, which resulted in a steady shift in the diffraction peak position [45]. Kumar et al. found that the XRD peaks lie at (2θ) angle range of 24.5°–25.01° in rGO samples, indicating variable levels of reduction [36]. Additional studies, such as by Zhao et al. and Oliveira et al., found a decrease in interplanar spacing and the formation of a large diffraction peak at around 2θ range of 24°–26°, indicating the effective deoxygenation of GO [46, 47]. The presence of (002) peak at 26.76° in the present work’s XRD analysis supports these findings, indicating a reduction process that produces rGO with characteristics equivalent to precursor graphite, confirming a successful deoxygenation process. The structure of rGO is comparable to the precursor graphite, but the material exhibits a higher amorphization as shown in Figure 8. This confirms the formation of a rGO, which is a typical graphene derivative material.
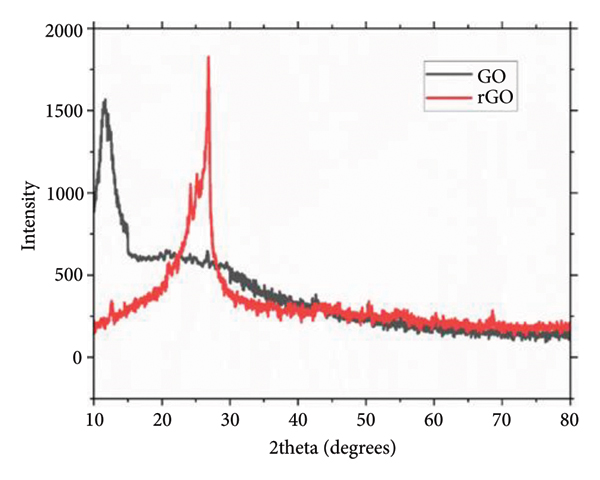
Distinguished XRD patterns of GO and rGO.
3.3. Functional Group Characteristics of Prepared GO
FTIR analysis is performed for all the GO samples produced through Exp1 to Exp5, which provides the fingerprint (identity) information of various oxygenated functional groups present in produced GO after chemical oxidation process adopted in present study which indicates successful oxidation of graphite for all experimentations. The FTIR spectra of raw graphite and its oxidized form (GO) are presented in Figure 9. As expected, raw graphite does not exhibit oxygenated absorption bands. However, GO synthesized through different process with different amount, temperature, and time variables shows significant and consistent absorption band peaks corresponding to oxygenated functional groups such as O‐H, C=O, C‐O, C‐O, C‐O‐C, and C‐OH stretching vibrations.

FTIR spectrum for raw graphite and synthesized GO samples (Exp1‐GO to Exp5‐GO).
The samples exhibit strong and broad absorption bands around 3450 cm−1 with lower percent of transmittance, which is attributed to the hydroxyl (O‐H) functional stretching vibration. In contrast, other functional groups in GO appeared as narrow, weak, and sharp infrared spectrum bands with higher percent transmittance compared to O‐H stretching vibrations. Specifically, carbonyl (C=O) and C‐OH are observed at around 1725 and 1220 cm−1, respectively, whereas the alkoxy (C‐O) and epoxied C‐O‐C functional stretching vibrations appear at around 1090 and 1400 cm−1 spectrum peaks, respectively.
Additionally, the mild unoxidized graphitic structure observed in the XRD analysis is also evident in FTIR spectra, which is the aromatic functional group of graphite framework with C=C vibrational stretching corresponding to unoxidized sp2 CC bonds that appeared at around 1625 cm−1 transmission bands. Moreover, FTIR confirmed the graphitic domain in all chemically synthesized GO, even when some of the works were reported as highly oxidized GO structures in their XRD analysis, and the functional groups and their FTIR spectral peak positions obtained in this work are in very good agreement with previously reported studies on GO compositional analysis as highlighted in Table 4.
FTIR results showing functional groups and wavenumber absorptions of GO.
In particular, the baseline‐corrected spectra reveal prominent peaks for C=O (∼1725 cm−1), C=C (∼1625 cm−1), and C–O (∼1220–1050 cm−1), which are either absent or significantly weaker in pristine graphite as shown in the 1900–500 cm−1 range in Figure 10. Figure 10(b) highlights the comparison between graphite and the most oxidized GO sample (Exp5‐GO). Here, Exp5‐GO shows well‐defined peaks corresponding to O–H, C=O, and C–O groups, confirming the successful introduction of oxygenated functionalities that were absent in the raw graphite.

FTIR spectra after baseline correction: (a) all samples and (b) comparison between graphite and most oxidized GO sample (Exp5‐GO).
(b)

3.4. UV‐Vis Spectroscopy Characteristics of the Prepared GO
UV‐Vis spectroscopy is adapted in the present study, which is an analytical technique for characterizing the optical properties of GO, that can provide two kinds of main valuable information about conjugation and functional groups which have multiple bonds. Commonly, the conjugation and oxygen‐containing functional group information can present one absorption peak in the ultraviolet region and one shoulder peak in the visible region of UV‐Vis spectrum of GO, respectively. The obtained UV‐Vis spectrum for produced GOs (Exp1‐GO to Exp5‐GO) is shown in Figure 11; the unique absorption peak can be observed for all samples at around 230 nm ascribed to the remaining conjugation of π‐π∗ from C=C bonds, while another unique shoulder peak has been observed for all samples at around 300 nm attributed to the carbonyl (C=O) functional group due to the absorbance of n‐π electronic transitions [53].

UV‐Vis spectra of prepared GOs (Exp1‐GO to Exp5‐GO).
Comparably, the spectra of Exp1‐GO and Exp2‐GO have broader peak pattern than those of Exp3‐GO, Exp4‐GO, and Exp5‐GO. However, Exp3 and Exp5 GOs have similar absorption peaks and possess definite shoulder peaks compared to the other GO samples. The reason behind this is attributed to Exp5‐GO and Exp3‐GO containing more sp3 oxygenated domains due to better oxidation capabilities, but other samples possess more sp2 aromatic rings (conjugation) due to less oxidation of graphite comparably. Furthermore, Exp1‐GO and Exp2‐GO display π–π∗ absorption peaks at 232 ± 1.25 and 231 ± 1.17 nm and n–π∗ shoulders at 300 ± 0.6 and 301 ± 0.58 nm, giving absorbance ratios (absorbance π–π∗ peak/n–π∗ shoulder peak of Exp1‐GO and Exp2‐GO samples) of 1.82 ± 0.02 and 1.88 ± 0.04, respectively, indicating a larger fraction of sp2 aromatic domains and lower oxidation. Exp3‐GO presents a sharper main peak at 230 ± 1.15 nm with a shoulder at 299 ± 0.55 nm and an absorbance ratio of 1.95 ± 0.02, reflecting moderate oxidation. Sample4–GO shows a peak at 235 ± 1.12 nm with a shoulder at 303 ± 0.7 nm and an absorbance ratio of 2.05 ± 0.02, indicating significant sp3 oxygenated domains consistent with substantial oxidation. Sample5–GO exhibits a main peak at 231 ± 1.15 nm with a shoulder at 300 ± 0.7 nm, showing the highest absorbance ratio of 2.12 ± 0.04, and the most defined shoulder confirms it as the most oxidized sample, fully consistent with its largest interlayer spacing as found from XRD analysis. These spectral features confirm that broader peaks in Exp1‐GO and Exp2‐GO correspond to more sp2 aromatic domains, while sharper peaks with defined shoulders in Exp3‐GO, Exp4‐GO, and Exp5‐GO reflect the formation of sp3‐hybridized oxygenated sites. The obtained results in this work are in good agreement with the UV‐Vis results reported in the literature such as 232 nm [24], 239 nm [30], 232 nm [50], 230–233 nm [34], 231 nm [54], and 230 nm [51], all with shoulder peaks at around 300 nm.
In addition, the present work also highlights the optical behavior of the prepared GO (Exp5‐GO) and its reduced state rGO with the help of UV‐Vis spectroscopy, as presented in Figure 12. The UV‐Vis spectrum of prepared GO (Exp5‐GO) showed an absorption peak at around 230 nm wavelength, while after reduction by the thermal annealing method, the broad peak of rGO is observed at about 255 nm. The shoulder peak is indefinite in rGO due to the removal of oxygen‐containing functional groups during reduction process of GO (Exp5‐GO). Moreover, samples with better oxygen containing functional groups show sharp absorption peak and small shoulder peak. However, less oxidized graphite shows broad conjugated aromatic ring peak; the shoulder peak is small with slight increase in wavenumber and shows indefinite shoulder peak when GO (Exp5‐GO) is reduced to rGO.

UV‐Vis spectrum of rGO and GO (Exp5‐GO).
4. Potential Challenges and Future Perspectives
The present study is focused on the reduction of acid consumption used in Hummers’ and Tour’s method of GO synthesis, and it is executed successfully and substantially without affecting the product quality. However, the use of strong oxidants still poses risks of corrosion and process operator safety. Additionally, key question is whether the observed benefits under controlled laboratory conditions can be effectively replicated at a larger scale while maintaining all the critical aspects such as product quality, technical performance, and economic feasibility. Scaling up the laboratory‐scale process into industrial‐scale production may remain a challenge till its actual execution. Furthermore, detailed waste treatment analysis and environmental sustainability are also required for any adapted process, which can be executed through various waste byproduct life‐cycle analyses. This study primarily focused on XRD, FTIR, and UV‐Vis characterizations to analyze the structural, functional, and optical properties of the produced GO samples. However, further analytical techniques should be considered such as Raman spectroscopy for detailed defect density analysis and XPS for quantitative evaluation of oxygenated functional groups. Additionally, residual quantification of unreacted graphite, sulfate impurities, or metal ions through respective analytical techniques can also be done. Future work should address these potential limitations of the present work such as performing extended characterizations, developing a batch synthesis process with improved safety and scalability, and implementing waste‐neutralization/recovery strategies. Additionally, exploring greener oxidants, electrochemical oxidation, or alternate catalytic pathways may further reduce corrosive chemical requirements. From an application perspective, the improved yield and functional tunability of GO synthesized through this method can provide a strong basis for energy storage devices, membranes for water purification, and nanocomposite reinforcement for various applications.
5. Conclusions
The present work reports the investigation of an efficient chemical oxidation method of GO synthesis with a facile modification in the Tour method. The observation from the study confirmed the reduced expenses for the efficient chemical oxidation method due to use of fewer H2SO3/H3PO4 acid intercalant amounts (reduced by approximately 90%) and short processing time (reduced by approximately 70%) as compared to that of the Tour method, finally exhibiting better product yields. The produced GOs’ structural, chemical, and optical characteristics were confirmed using various characterization techniques, namely, XRD, FTIR, and UV‐Vis spectroscopy, where the GO samples were prepared using an efficient chemical oxidation method with different input amounts, processing temperatures, and time variables. The crystallographic diffraction peak appearance and the interlayer spacing thickness of the produced GO range between 2θ angles of 10.8°–11.5° and 0.7–0.82 nm, respectively. The average crystallite size (D) and number of layers of the produced GOs were estimated using the Scherrer model. The average crystallite size is found in the range of 8 ± 1 to 16 ± 2 nm, and the average number of monolayer sheets is estimated in the range of 10 ± 1 to 20 ± 2, while the initial average graphite crystallite size was 55 nm with substantial number of monolayer sheets around 165 ± 3.
The input amount, processing temperature, and time variables in the efficient chemical oxidation method showed obvious effects on structural, chemical, and optical characteristics of synthesized GOs. Lower graphite input (in Exp5‐GO) showed higher interlayer space thickness (0.82 nm) due to better oxidization capability than final GOs synthesized from higher amount of graphite input (5 g of graphite) which are prepared with same processing temperature and time variables. Meanwhile, it is found that the processing temperature had higher effects than time variable on the produced GOs’ crystallite size, number of layers, and product yields. The result observation also showed that the crystallite size and number of layers of GO decrease with increasing temperature, and the highest yield was obtained at 75°C in Exp3‐GO experimental procedure. However, it was also found that 145% of yield was recorded at 95°C in Exp4‐GO, and this experiment can be optimized further to get the GO yield with lowest average crystallite size (∼8 nm) and a smaller number of monolayer sheets (∼10). Finally, it is observed that using the chemical oxidation method which is adopted in the present study confirms the absorption peak of GO at around 230 nm in the UV‐Vis spectroscopy and better formation of functional groups such as hydroxyl, carbonyl, and epoxide groups as validated by FTIR analysis. This study presents the modified version of the Tour method with an efficient approach through substantial reduction of intercalant acid consumption and time required to synthesize GO, without excluding H3PO4 in the reaction system, rather optimized ratio of H2SO4/H3PO4 intercalant developed which is 6:1. These outcomes highlight the method’s effectiveness and provide added value to the existing literature on sustainable GO synthesis.
Data Availability Statement
The data that support the findings of this study are available from the corresponding author upon reasonable request.
Conflicts of Interest
The authors declare no conflicts of interest.
Author Contributions
Andarge Ayele Adem: conceptualization, writing–original draft, formal analysis, methodology, visualization, and investigation. Himanshu Panjiar: writing–original draft, formal analysis, writing–review and editing, conceptualization, visualization, and supervision. Jack J. Kenned: writing–review and editing, conceptualization, visualization, and supervision. B. S. S. Daniel: writing–review and editing and supervision. Endrias Adane: methodology, formal analysis, and writing–review and editing. Krishnaraj Ramaswamy: writing–review and editing and supervision.
Funding
The authors declare that no contractual funding was received for this research.