
Abstract
A 3-D magnetic graphene ball (MGB) material was prepared using cellulose as the carbon source. Carbon-encapsulated iron nanoparticles (CEINs) were first prepared by hydrothermal carbonization of cellulose powder at 180°C. Then, the prepared CEINs were catalytically graphitized to graphene-encapsulated iron nanoparticles (GEINs) at 900°C. Finally, GEINs were treated in carbon dioxide at 700°C, during which the iron core was oxidized to magnetite (Fe3O4) nanoparticles, and graphene shells were peeled off from the iron cores to form graphene nanoplatelets. The graphene nanoplatelets consist of 1–10 layers graphene with the in-plane size of 20–30 nm. The prepared 3-D MGB was investigated for the removal of oil from water, which demonstrated outstanding adsorption performance and excellent recyclability.
Keywords
Introduction
Graphene, a 2-D planar sheet of carbon atoms packed in the honeycomb-like lattice, has many unique and excellent properties, such as high electronic conductivity, high mechanical strength, flexibility, thermal conductivity and stability, a wide range of light absorption, and high surface area. These properties have made graphene a promising candidate for a broad range of applications in many fields. 1 –3 However, due to the strong van der Waals interactions and the high intersheet junction contact resistance between isolated graphene sheets, graphene sheets prefer to agglomerate or restack, which significantly decrease its conductivity and mechanical strength of individual graphene sheets and diminish its specific surface area. 4 Many efforts have been made to crack this challenge. One of the most effective ways is to construct 3-D graphene networks (3DGNs) to suppress the agglomeration or restacking of individual graphene sheets. 4 Different 3DGNs have been prepared in the form of graphene foams, 5 graphene sponges, 6 graphene aerogels, 7 graphene mesh, 8 and graphene balls. 9 3-D graphene materials possess excellent properties including large surface areas and pore volumes, low densities, good electrical conductivities, and mechanical properties. 3DGNs have been extensively used in the fields of energy storage and conversion, including fuel cells, batteries, solar cells, and supercapacitors. 6,10,11 3DGNs also have been tested for the removal of spilled oil, 12 dyes, 13 toxic metals, 14 and miscellaneous environmental pollutants from water. 15 3DGNs are used in biosensors and gas-sensing devices, 16 biomedicine, 17 and catalysts. 18 3DGNs have been prepared through methods, such as self-assembly, 19 template-assisted preparation, 20 and direct deposition, 21 supercritical CO2 fluid technique, 22 the freezing technique, 23 electrochemical approaches, 24 and sugar blowing. 25
Organic solvents are widely used in the furniture production, such as benzene, chlorobenzene, glycol ethers, methylene chloride, acetone, toluene, ethylbenzene, and xylenes. 26 Spilled or leaked oil and organic solvents can contaminate water, soil, and air. Organic solvents and oil in water may severely affect the marine environment by causing a decline in phytoplankton and poisoning fishes, marine mammals, and seabirds. 27 Various methods have been developed to cleanup and recover organic solvents and oil from water. 28 Due to their intrinsic hydrophobic property and high specific surface area, 3-D graphene materials have been reported excellent adsorption and desorption performance for the removal of oil and organic solvents from water and can be used many times. 29 The hydrophobic lightweight graphene structures can rapidly absorb oil phase from water, with a capacity up to over 100 times their own weight in oil. 30 The oil can be easily drained from the 3DGNs, so these absorbents can be reused for many times. 31 Currently, most of the 3DGNs are made from graphene oxide or graphite-derived graphene, which make 3DGN materials expensive and significantly slow down their potential usage in high volume applications. In addition, limited processes for the production of low-cost 3DGNs exist. The challenges of sustainable development have driven people to find simple, environmentally friendly ways to produce graphene-based materials. Biomass presents an abundant and low-cost source of carbon. However, there have been limited studies on the use of wood or agricultural biomass as the carbon source to produce 3DGNs.
This article presented a new, green, and one-step approach for preparing 3-D magnetic graphene balls (3DMGBs). Carbon-encapsulated iron nanoparticles (CEINs) are first synthesized by low-temperature hydrothermal carbonization (HTC) using cellulose as carbon sources, and then CEINs are catalytically graphitized at high temperature. Finally, 3DMGBs are obtained by posttreating graphene-encapsulated iron nanoparticle (GEINs) in CO2. The obtained nanostructures are characterized by scanning electron microscopy (SEM), high-resolution transmission electron microscopy (HRTEM), X-ray diffraction (XRD), and Raman. The MGB is used for oil removal from water.
Experiment
Preparation of carbon-encapsulated iron core nanoparticles
CEINs were synthesized hydrothermally by the reduction of Fe3+ in the cellulose solution. Fifty grams of Fe(NO3)2•9H2O were dissolved in the 1000 mL cellulose solution (containing 100 g cellulose, the pH value of the solution was 3.0). The mixture was stirred for 30 min and then transferred into a 5-L Parr reactor. The autoclave was heated up to 180°C and kept for 8 h. After the reaction completed, the obtained black product was collected and washed three times with deionized (DI) water and ethanol to remove soluble ions and sugar residues. The final product was oven-dried at 110°C overnight.
Catalytic graphitization of CEINs to GEINs and formation of MGBs
Thirty grams of the dried CEINs were packed in the middle of a quartz tubular reactor (25.4 mm outer diameter (O.D.)). Argon (99.99% purity) as a carrier gas was introduced into the reactor at a flow rate of 50 mL min−1 for 30 min. The reactor was temperature-programmed heated at a heating rate of 3°C min−1 to 900°C and kept at 900°C for 1 h. The furnace was cooled down by 5°C min−1 to room temperature. Then the reactor was temperature-programmed heated at a rate of 3°C min−1 to 700°C under a flow of 100 mL min−1 CO2. The reactor was kept at 700°C for 3 h and cooled down by 10°C min−1 to room temperature.
Absorption of MGBs for oil
The oil adsorption capacity was measured by the following procedure: 50 mg of the MGB was immersed in a mixture of oil and DI water (50 mL of each). The adsorbents were removed after 60 min of immersing time and allowed to drain for 5 min before transferring to a preweighed glass vial to weigh. The vacuum system was applied to remove the oil and organic solvents from the saturated MGB to assess the reusability and regeneration of the used adsorbent. Subsequently, MGBs were heated up around the boiling point of absorbate for next oil adsorption test. The cycle of adsorption was repeated 10 times to characterize the recycling performance. The adsorption capacity (Q) was calculated using the weight (wt) of MGB before (W1) and after adsorption (W2) as follows:

All adsorption experiments were performed three times, and an average value of adsorption capacity was obtained.
Characterization
X-Ray powder diffraction patterns of the synthesized catalyst samples were obtained using a Rigaku Ultima III XRD system (Woodlands, Texas, USA). The system operated at 40 kV and 44 mA using copper (Cu) K α radiation with a wavelength of 1.5406 Å. Angles of 15–80° were used at a scan rate of 0.02°s−1. The sample morphology was investigated using SEM with an energy-diffusive X-ray spectroscopy (JEOL JSM-6500F, Peabody, Massachusetts, USA). All samples were precoated with gold before being introduced into the vacuum chamber. The sample particle sizes were examined with a JEOL JEM-100CX II. The transmission electron microscope (TEM) operated at an accelerating voltage of 100 kV. All samples were sonicated in an ethanol solution for 20 min before being transferred to the Cu supports. A Jobin–Yvon microspectrometer was used to investigate the Raman spectra on the samples with an excitation laser source emitting at 514 nm. An incident power of around 1 mW was used. The surface areas of the samples were determined using N2 adsorption−desorption (Quantachrome, Autosorb-1). Prior to measurements, all samples were degassed at 300°C for 12 h.
Results and discussion
Characterization
There were no diffraction peaks observed for the fresh CEIN samples (Figure 1(a)), which indicated that no crystal structures formed either in the core or on the shell but may exist in an amorphous structure. The significance of gaseous products was reported to be released when calcining the fresh sample between 300°C and 400°C. 32 These gases may lead to significant pressure overshoot in the reactor. For safety concerns, the fresh sample was precalcined under nitrogen atmosphere in a muffle furnace. For the calcined sample (Figure 1(b)), XRD patterns showed peaks at 30.10°, 35.42°, 37.05°, 43.05°, 53.40°, 56.95°, 62.51°, and 73.95°, which were assigned to cubic-phase FeO•Fe2O3 (Fe3O4). No signals for metallic iron or other iron oxides were detected in the XRD pattern, which confirmed the reduction reaction, that is, Fe3+ was partially reduced to Fe2+ and formed a mixed iron oxide, Fe3O4. Scherrer analysis was performed on a high-intensity Bragg peak (311) of Fe3O4, and the mean crystallite size was calculated to be 5.7 nm. Figure 1(c) shows the XRD pattern of the GEIN samples. The peaks at 44.68° and 65.03° correspond to the α-iron (110) and (200) planes (PDF#97-005-3802). The peaks at 43.9°, 51.2°, and 75.3° correspond to the γ-Fe lattice. The peaks at 37.75°, 40.7°, 42.6°, 43.75°, 44.56°, 44.94°, 45.86°, 49.12°, 57.8°, 70.9°, 77.9°, and 78.6° are assigned to cementite, Fe3C (PDF#00-035-0772). The peak at 26.55° may correspond to graphite (002) (PDF#00-056-0160) plane, which indicated that carbon shells in the CEIN sample were graphited after carbonization. Figure 1(d) show the XRD pattern of the GEIN samples in CO2 at 700°C. Besides the graphene diffraction peak at 26.55°, diffraction peaks at 30.2°, 35.5°, 43.1°, 56.9°, and 62.7° corresponding to the diffraction peaks of (2 2 0), (3 1 1), (2 0 8), (5 1 1), and (4 4 0) of Fe3O4 were detected, which indicated that the iron cores of the GEINs were oxidized to Fe3O4 particles at 700°C in CO2 33 :


(a) XRD patterns of the fresh CEINs from cellulose after HTC, (b) the calcined CEINs under an argon flow at 300°C, (c) GEINs, and (d) MGB. XRD: X-ray diffraction; CEIN: carbon-encapsulated iron nanoparticle; GEIN: graphene-encapsulated iron nanoparticle; MGB: magnetic graphene ball; HTC: hydrothermal carbonization.
Based on a calculation by Scherrer equation, the crystallite size of Fe3O4 in the sample was 31.5 nm. The peak at 26.55° corresponding to graphene (002) plane still existed, which showed that the graphene shell was not modified after CO2 treatment at 700°C.
SEM images of the fresh and calcined CEINs are shown in Figure 2(a) to (d). It is observed that the agglomerated CEINs sample is spherical (Figure 2(a) and (c)). Spherical-shaped particles with a uniform particle size of 0.5–1 µm were observed for the product (Figure 2(a)). The morphology of the single microsphere exhibits a porous structure surface (Figure 2(b)). SEM images of the CEINs sample show that the sample spheres (0.5–1 µm) are agglomerates of 5–20 nm particles (Figure 2(c) and (d)). SEM images of the GEINs demonstrated a very porous structure after catalytic graphitization (Figure 2(e) and (f)). The porous GEIN sphere is composed of uniform shaped nanoparticles of 5–10 nm in diameter (Figure f)). More micropores and microchannels were also observed in the thermal-graphitized sample (Figure 2(f)). XRD result proved that these nanoparticles were composed of α-Fe, γ-Fe, iron carbide, and graphene. In Figure 2(g) and (h), SEM images of MGB shows porous structures composed of nanoplates (Figure h)) with the size of 20–30 nm (Figure 3(g) and (h)). The image (Figure h)) shows nanoflakes uniformly distributed on the surface of the MGB sample. XRD results demonstrated that plates were graphene nanoplatelets and Fe3O4 nanoparticles in the sample. This proves that the magnetic nanoparticles were integrated with graphene nanoplatelets to form the MGBs.

SEM images of (a, b) fresh CEINs, (c, d) calcined CEINs, (e, f) GEINs, and (g, h) MGBs. CEIN: carbon-encapsulated iron nanoparticle; GEIN: graphene-encapsulated iron nanoparticle; MGB: magnetic graphene ball; SEM: scanning electron microscopy.
The TEM images of the fresh CEINs are shown in Figure 3(a) and (b). As shown in the HRTEM image (Figure 3(a)), iron nanoparticles with a diameter of 3–8 nm were homogenously embedded in the amorphous carbon framework (gray matrix). The porous carbon shell was amorphous since no ordered planes of the natural graphite structure were observed. The TEM images (Figure 3(c) and (d)) of the GEINs showed that the diameter of the iron cores was between 3 nm and 5 nm. The amorphous carbon shells were graphitized with 3–10 layers of graphene structure (Figure 3(d)). CEINs shrank due to the decomposition of the functional groups of the carbonaceous shell and the reduction of iron oxide during the graphitization process. Figure 3(e) and (h) shows that HRTEM images of the MGB are the hybrid of the magnetite (Fe3O4) nanoparticles (Figure 3(f)) and graphene nanoplatelets (Figure 3(g) and (h)). When treating GEIN agglomerates in CO2 at 700°C, the iron core was oxidized to magnetite with size expanding to 10–15 nm (Figure 3(e) and (f)). The GEIN structure was cracked, and the graphene shell was peeled off from the iron particle (Figure 3(f)) and formed graphene nanoplatelets (Figure 3(g) and (h)) containing 1–10 layers (Figure 3(h)).

HRTEM images of (a, b) fresh CEINs, (c, d) GEINs, and (e–h) MGBs. CEIN: carbon-encapsulated iron nanoparticle; GEIN: graphene-encapsulated iron nanoparticle; MGB: magnetic graphene ball.
The Raman spectrum is used to identify the presence of graphite and disordered amorphous carbon in the samples. Figure 4 shows the Raman spectra for CEIN, GEIN, and MGB samples. The curve for CEINs displays two characteristic peaks at 1341 and 1596 cm−1 corresponding to the D and G bands, respectively. The D and G bands of the GEINs and MGBs are in 1341 and 1586 cm−1, respectively. A 2-D band at nearly 2730 cm−1 was also observed in GEIN and MGB samples. The intensity ration of D and G band (ID/IG) values were 1.65, 0.95, and 0.88 for CEIN, GEIN, and MGB samples, respectively. The graphitization degree of these three samples was in the order of CEINs < GEINs < MGBs.
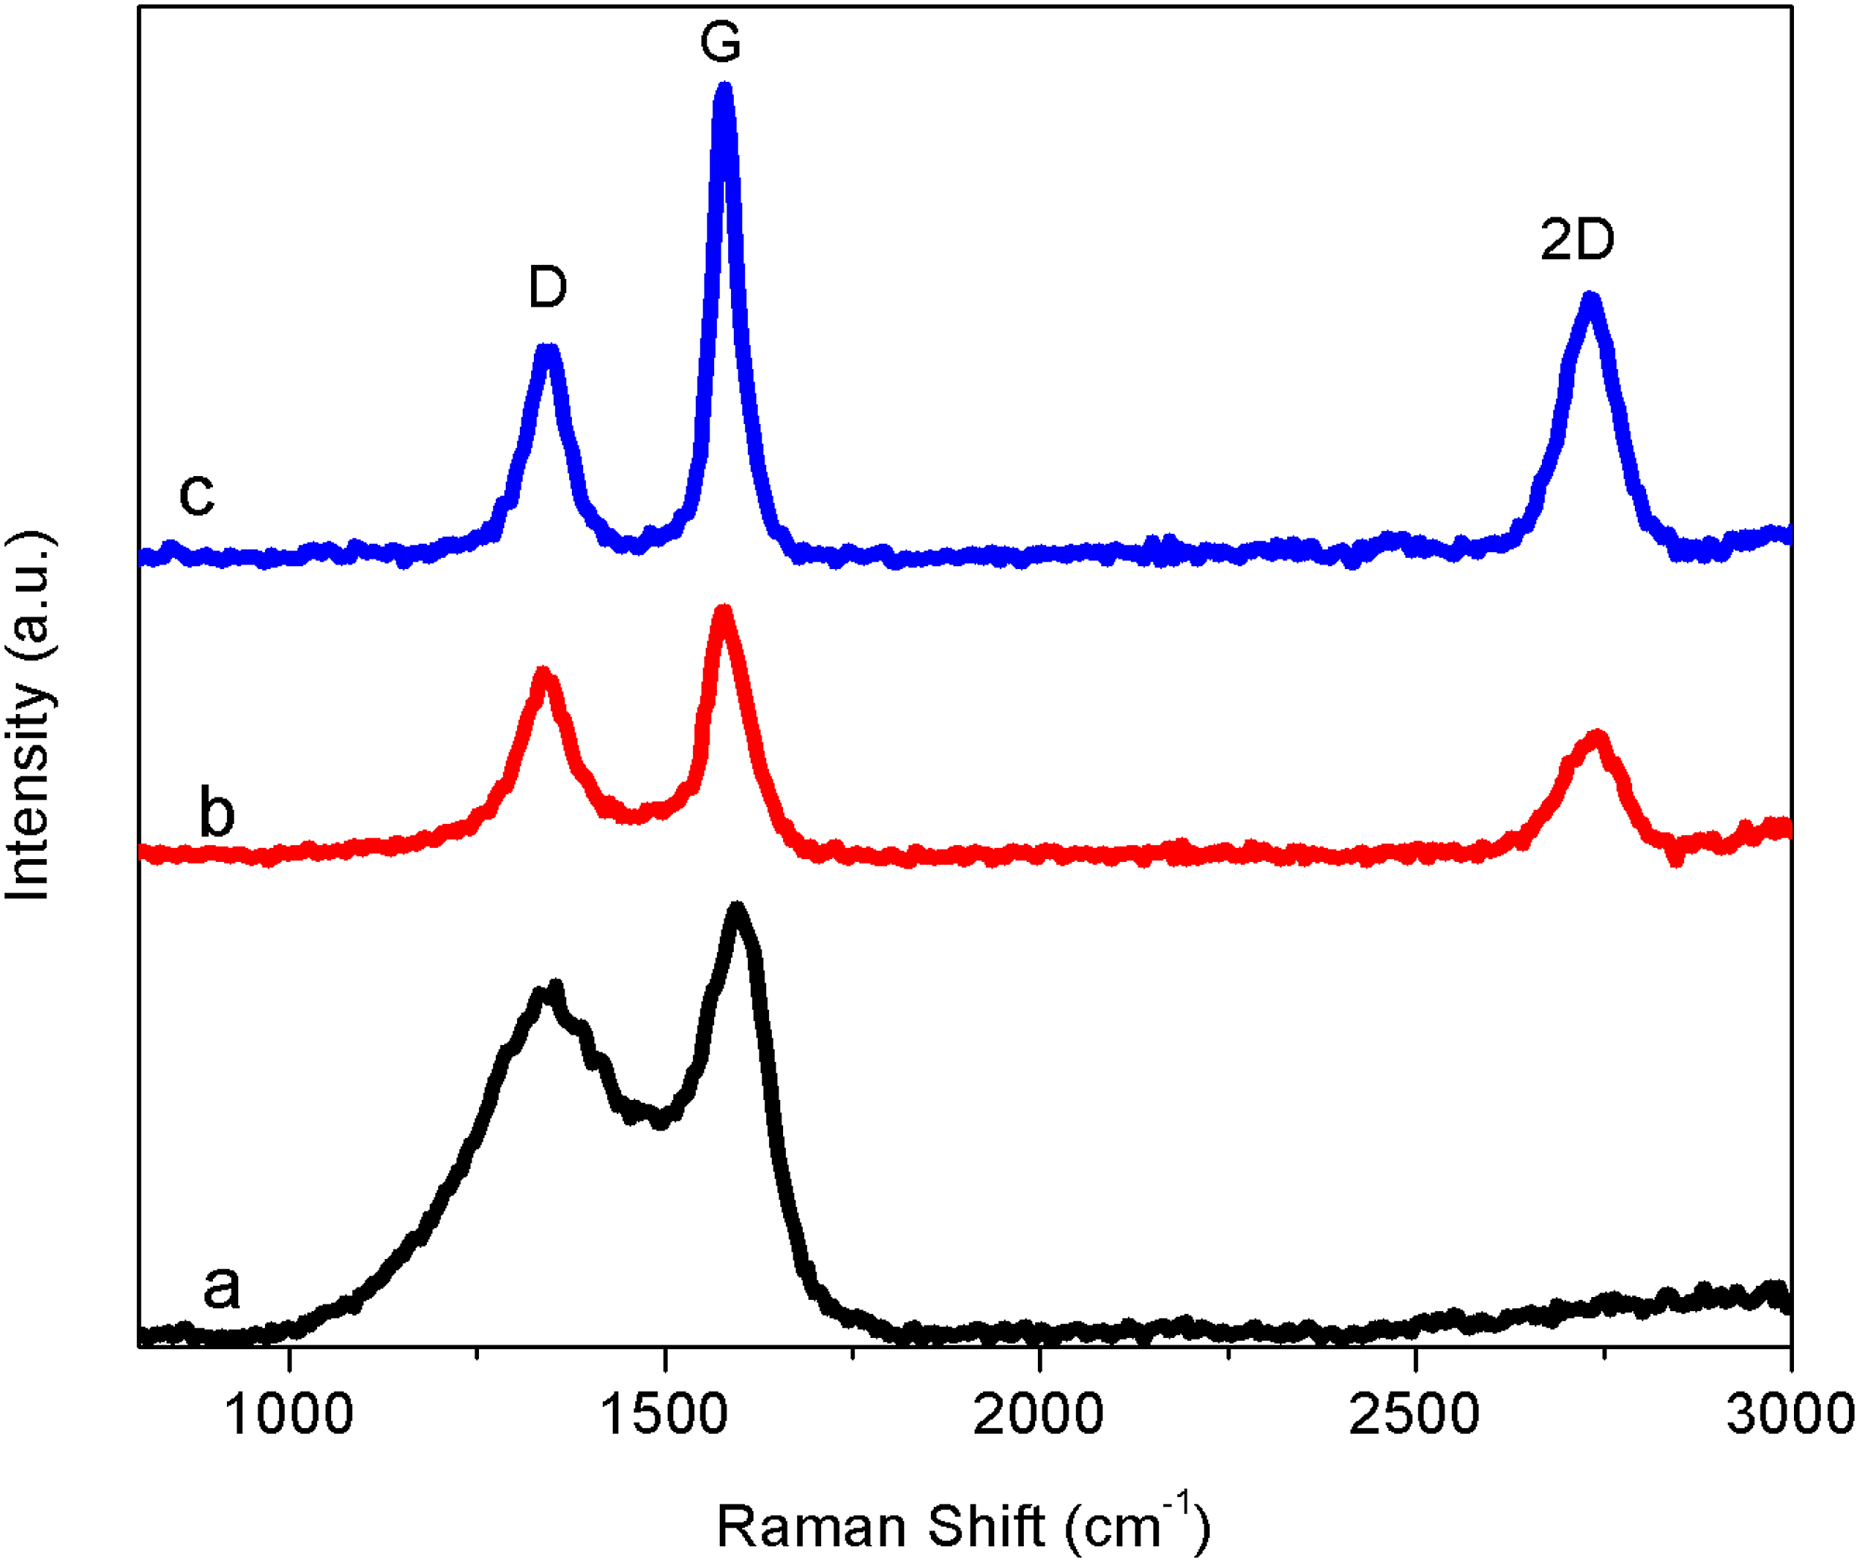
Raman spectra of the (a) fresh CEINs, (b) GEINs, and (c) MGBs (c). CEIN: carbon-encapsulated iron nanoparticle; GEIN: graphene-encapsulated iron nanoparticle; MGB: magnetic graphene ball.
Surface area analysis results indicate that the fresh CEINs had the lowest surface area of 32.7 m2 g−1, while GEIN sample yielded the Brunauer-Emmett-Teller (BET) surface area of 85.3 m2 g−1 and the surface area of 3DMGB sample was the highest with 196.5 m2 g−1.
Absorption of MGBs for oil
Absorption is one of the most effective techniques to clean oil spills. 34 Graphene-based 3-D materials have demonstrated excellent performance for oil cleanup. Hence, utilizing biographene-based 3DGNs as absorbents are more beneficial due to their low cost and ready availability. The absorption performance of MGBs on different organic solvents and oils has been investigated and plotted in Figure 5. As shown in Figure 5(a), the absorption capacity of the MGBs ranges approximately from 108 g g−1 to 141 g g−1, which indicates a high absorption capacity of MGBs for organic solvents and oils. The high absorption performance of 3DMGB may be due to its high surface area. 31 In Figure 5(b), multiple sorption–desorption cycles for diesel fuel show that 79.2% of the saturated absorption capacity can be maintained after 10 cycles.

Absorption performance of MGBs: (a) absorption capacity of MGBs over oil and organic solvents and (b) cyclic absorption capability of diesel fuel by MGBs. CEIN: carbon-encapsulated iron nanoparticle; GEIN: graphene-encapsulated iron nanoparticle; MGB: magnetic graphene ball.
Conclusions
A 3DMGB material was synthesized through a green process using cellulose powder as the carbon source. Spherical agglomerates of CEINs were first synthesized by low-temperature HTC of cellulose. CEINs in the agglomerate were further catalytically graphitized to GEINs. Finally, the GEIN structure was cracked in CO2 at 700°C, during which the iron core was oxidized to magnetite (Fe3O4) nanoparticles, and graphene shells were peeled off from GEINs and formed graphene nanoplatelets. Both the magnetite nanoparticles and the graphene nanoplatelets in the agglomerate balls were integrated into the 3DMGBs. The prepared 3DMGBs exhibit outstanding adsorption performance for the removal of organic solvent and oil from water. In a future study, the focus should be put on the control of catalytic conversion process to obtain a high yield of 3DMGBs from cellulose. Since cellulose is quantitatively available in large amounts, scaling up of the catalytic conversion process should be achieved to massively produce 3DMGBs.
Footnotes
Declaration of conflicting interests
The author(s) declared no potential conflicts of interest with respect to the research, authorship, and/or publication of this article.
Funding
The author(s) disclosed receipt of the following financial support for the research, authorship, and/or publication of this article: The authors are grateful for the financial supports from the Key R&D Projects of Zhejiang Province (grant no. 2018C01136) and the Natural Science Foundation of Zhejiang Province, China (grant no. LQY18C160001).