
Abstract
By using time-dependent density functional theory, we investigate in a fully quantum mechanical framework the interactions, in an ultra-near-field regime, between a localized surface plasmon excitable in a silver tetrahedral cluster and a molecular exciton with excitation energy in the same range. We show that, for metal–molecule distances below 5 Å, the optical response of the system results characterized by the appearance of a double peak structure. We analyze the transition densities for the resonant energies and propose a plasmon–exciton electromagnetic interaction model to explain the emerging of a lower energy resonance in the spectra of such kind of hybrid systems of interest for molecular plasmonics.
Introduction
Until now, classical electrodynamics has been widely used to describe the plasmonic properties of many nanophotonic systems. 1 –7
However, there is a growing interest for a class of nanosystems 8 where the quantum nature of electrons plays a fundamental role, and thus the classical description breaks down. 9 –11 Several examples can be found in the emerging field of molecular plasmonics, 12 which aims to control interactions between plasmons and molecular emitters at the quantum scale.
In particular, several levels of approximation can be exploited to study the electrodynamic coupling between quantum emitters (QEs) and metallic nanoantennas taking part in many phenomena such as absorption 13,14 (which is the case of the present article), luminescence, 15,16 and Raman scattering 17 .
While there are approaches which quantize the electromagnetic field, neglecting the quantum nature of matter,
18
if one chooses to treat the field classically, the following strategies can be employed: the QE is treated like a classic dipole and the metal is a continuous body characterized by a frequency-dependent dielectric function;
19
the metal is treated as before, while the QE is studied within an atomistic framework,
20
such as the time-dependent density functional theory (TD-DFT);
21
both the metal and the QE are treated atomistically via TD-DFT.
22
Obviously, the last case represents the most accurate approach for the description of the matter component of the system, as it is able to take into account all quantum effects including non-locality, charge transfer, and chemical bonding, but the size of the system represents its main limitation. 23 In fact, standard TD-DFT becomes computationally unaffordable for systems with 1000 of atoms. One possible way to face this aspect is recurring to approximations of DFT, such as the density functional-based tight-binding (DFTB). 24,25
To perform large-scale simulations, this method applies the two-center approximation which consists in neglecting the three- and four-center integrals involved in the Hamiltonian expression. For each simulation, it is thus possible to use the so-called Slater–Koster (SK) files, which are a tabulation of the atomic valence Kohn–Sham orbital energies and the atomic pair Kohn–Sham matrix elements previously calculated.
In the following, the TD-DFT approach is used to perform a computational analysis on the interaction mechanism between a molecular photo-switch and a nanoantenna. In more detail, we computed the absorption spectra for different metal–molecule distances with the aim to study how the optical response of the plasmonic cluster is influenced by the molecule functionalization. The physics underlying the absorption spectra has been well investigated in terms of transition densities, the results showing a plasmon–exciton electromagnetic interaction.
Time-dependent density functional-based tight-binding (TD-DFTB) method is then applied on a system analogous to the TD-DFT one, thus showing comparable results. The future purpose is, in fact, to extend this scheme to larger hybrid composites of interest from an experimental point of view.
Systems and methods
The system on which we focused on in this article consists of a molecular emitter, trans,trans-1,4-diphenyl-1,3-butadiene (t,t-DPB), 26 and a tetrahedral cluster of Ag20, as depicted in Figure 1.

Sketch of the system studied with TD-DFT: a single molecule of t,t-DPB positioned perpendicularly to the base of the tetrahedral Ag20 and put in front of its vertex. 27 TD-DFT: time-dependent density functional theory; t,t-DPB: trans,trans-1,4-diphenyl-1,3-butadiene.
The molecule belongs to the important and vastly studied class of conjugated organic compounds called α,ω-diphenyl polyenes. Particularly, DPB possesses three photo-induced isomers: t,t-DPB, cis,trans-DPB, and cis,cis-DPB, which can be converted into each other via photoisomerization processes.
The cluster of Ag20 is characterized by a tetrahedral symmetry Td .
This choice was motivated mainly by the following reasons: the cluster is among the smallest ones having a particularly simple spectrum dominated by one plasmon-like excitation in the visible range
22,28
; the molecule is optically active in the same energy range of the metallic cluster; the molecular emitter here considered belongs to the class of photo-switches
29
and for this reason can be interesting for applications in molecular plasmonics.
Finally, we recurred to TD-DFTB to study the interaction in a hybrid metal–molecule system characterized by subnanometer inter-distances in a less computationally demanding environment. We analyzed a system with the same characteristics of the TD-DFT one, made of the same metallic tetrahedral cluster Ag20 and of another molecular photo-switch, a trans-stilbene molecule 30 with a benzene ring and COOH carboxylic group (COOH-B-TS). This study was made with the outlook to apply the same approach to systems of experimental interest for molecular plasmonics, without neglecting their intrinsic atomistic nature.
Computational details
All the DFT simulations on geometry relaxation, ground state, and excited states have been performed with the TURBOMOLE program. 31
Regarding the geometry relaxation, it has been done with a B3LYP 32 –34 functional for the exchange-correlation energy and a def2-SVP basis set 35 for the molecular part and a PBE 36 /def2-SVP prescription for the metallic nanocluster.
The DFT-relaxed geometries of the isolated systems have been, then, used as a starting point for the study within TD-DFT of the optical behavior of both the isolated components and the total selected system. The TD-DFT calculations were performed using a PBE prescription for the correlation functional and def2-SVP for the basis set.
Regarding the geometrical orientation of the total system, as it can be seen from the sketch in Figure 1, we constructed a configuration in which the molecular counterpart has its axis perpendicular to the base of the silver nanocluster and is placed near the vertex. The molecular emitter was, then, rigidly shifted away from the silver nanoparticle to explore all the different distances. The distance was calculated as the z coordinate difference between the hydrogen atom closest to the cluster and the top silver atom of Ag20, as indicated by the black arrow in Figure 1.
For what concerns the TD-DFTB simulations, the geometry was relaxed within standard DFT using PBE/def2-SVP prescriptions for the exchange-correlation functional and the basis set, respectively. The DFT-relaxed geometries of the isolated systems have been, thus, used as a starting point for the study of the optical behavior of both the isolated components and the total selected system, for which the Amsterdam density functional 37 parallel code has been used.
As already introduced in the first section, in the framework of DFTB, the atomic pairs Kohn–Sham matrix elements, which express the interactions between the elements in the system, are calculated and tabulated in the so-called SK files. The SK parametrization used for the TD-DFTB simulations for the silver cluster is an optimized version of the one largely used in the literature, Hyb-0-1. 38 For the TD-DFTB simulations on the molecular counterpart, the used SK file is the 3ob-3-1 one. 39
Results and discussion
The TD-DFT analysis
In Figure 2, we reported the TD-DFT absorption spectra for several distances, going from 2 Å to 60 Å, with a step of 0.5 Å in the range 2–6 Å, and then with a progressively larger range, since the spectra are nearly the same starting from the distance of 6 Å.

TD-DFT absorption spectra for the system t,t-DPB interacting with Ag20. The black solid spectra correspond each to a different distance explored, as indicated by the labels on each curve. The red dashed curve is the TD-DFT absorption spectrum of the bare Ag20 and the blue dot-dashed curve is the TD-DFT absorption spectrum of the molecule. The black dashed lines show that the first peak at energy ω− in each spectrum redshifts reduces the metal–molecule distance, while the position of the second peak at energy ω0 remains substantially unchanged and does not depend on the metal–molecule distance. The spectra are obtained by applying a Gaussian broadening of 0.02 eV. TD-DFT: time-dependent density functional theory; t,t-DPB: trans,trans-1,4-diphenyl-1,3-butadiene.
In more detail, from Figure 2, it can be noted that, in the distance range going from 2 Å to 4.5 Å, each curve is characterized by the presence of two peaks, well distinguishable from 2 Å to 3.5 Å; while, starting from the distance of 5 Å, the splitting gradually disappears, as long as the single peak progressively becomes the sum of the absorption spectra of the two separated constituents, whose absorption spectra are reported in the red dashed and blue dot-dashed curves for the cluster and the molecule, respectively.
Reasoning in terms of two coupled oscillator models, the absorption spectra regarding the distance range 2–4.5 Å can be explained as follows.
The molecule is characterized by an electronic transition Sz of a transition dipole oriented along the z direction, as it appears from the transition densities plot in the panel (a) of Figure 3; this state interacts only with the z component of the cluster transition dipole, whose plasmonic excitation, due to symmetry considerations, is threefold degenerated. This makes possible the formation of two states: bonding at energy ω− and antibonding at energy ω+ (see scheme in Figure 4).

Isosurface plots of the transition densities for the molecule of trans,trans-diphenylbutadiene (a) and for the cluster of Ag20 (b) calculated within the TD-DFT framework (negative and positive values of the density are reported in blue and red color, respectively). TD-DFT: time-dependent density functional theory.

A pictorial scheme of the coupling between a plasmon and an exciton. The black thick lines indicate the excitation energies of the isolated molecule and cluster. When the counterparts are close enough to allow a coupling between their transition dipole moments, this interaction permits the formation of two states: the bright or bonding one at energy ω− represented by the blue thick line and the dark or antibonding one at energy ω+ represented by the green dashed line. For each state, we also reported the TD-DFT spectrum relative to the distance of 2 Å. The arrows on the spectra indicate the energies corresponding to the hybrid excitations. TD-DFT: time-dependent density functional theory.
The bonding state originates from the aligning along the z-axis of the two transition dipoles of the interacting components and, thus, it emits and absorbs far-field radiation, and it assumes an optically active or bright behavior. This state depends on the cluster–molecule distance, as it is evident from the redshift of the absorption peak 40 reducing the metal–molecule distance (black dashed line at energy ω− in Figure 2).
The antibonding state originates from an antiparallel alignment along the z-axis of the transition dipole moments of the two components and, consequently, it is characterized by a small total transition dipole and it results to be optically inactive or dark. These antibonding peaks blueshift by reducing the metal–molecule distance.
Between the bonding and antibonding excitations, there is the plasmonic peak of the cluster, due to the allowed states Px and Py , which do not interact with the molecule and which are fixed on the cluster (as it is evident from the black dashed line at energy ω0 in Figure 2). It results that the plasmonic peak has contributions from many orbitals. In fact, from the analysis of the transitions which compose the collective excitation, the first five dominant contributions to the transition are of the type highest occupied molecular orbital (HOMO) → lowest unoccupied molecular orbital (LUMO)+3 (weight 20%), HOMO-1 → LUMO+2 (weight 13.6%), HOMO-2 → LUMO (weight 7.9%), HOMO-1 → LUMO (weight 6.9%), and HOMO → LUMO+2 (weight 6.4%).
The interaction scheme, reported in Figure 4, was confirmed by the results obtained from the transition densities analysis computed for the bright, plasmonic, and dark peaks characterizing the absorption spectra in the distance range going from 2 Å to 4.5 Å.
A scheme of this kind of analysis is reported in Figure 5 for the distance of 2 Å.
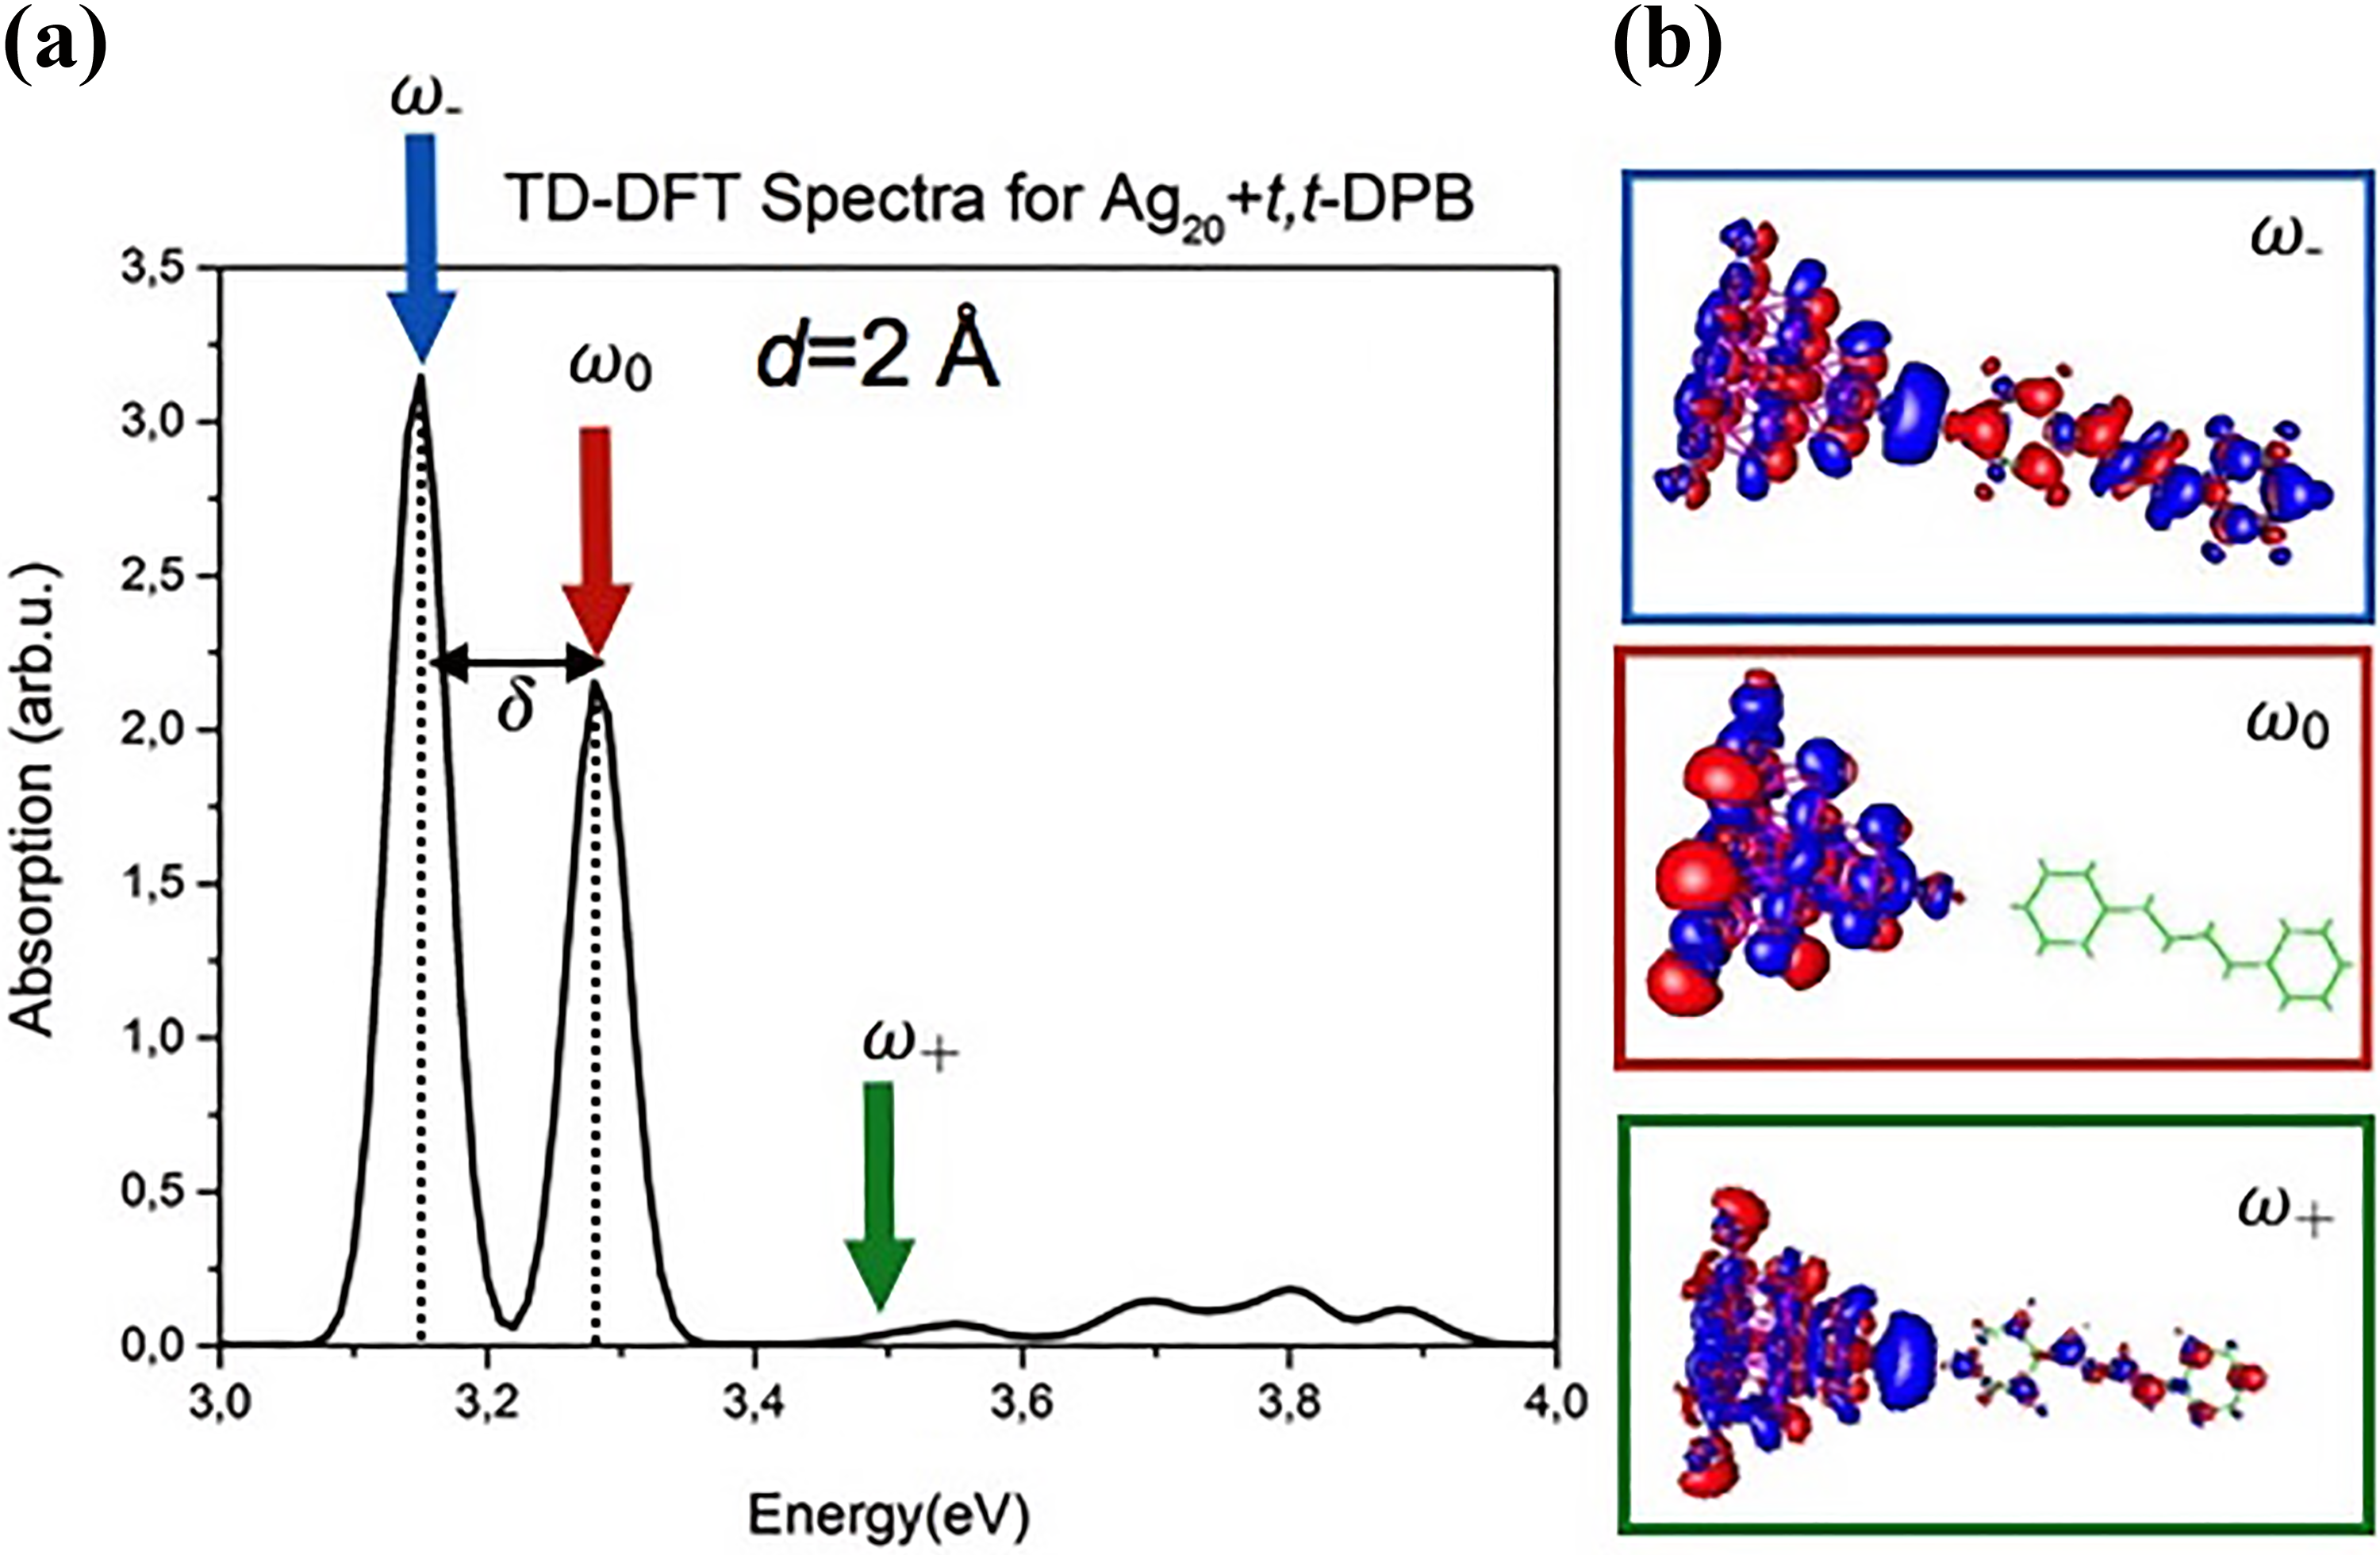
(a)TD-DFT absorption spectrum of the whole system for the metal–molecule distance of 2 Å. (b) In the insets, the transition densities corresponding to the excitations at different energies indicated by the three arrows are reported. TD-DFT: time-dependent density functional theory.
As we expected, both the excitations at energy ω− and ω+ are hybrid, while the excitation at energy ω0 is localized on the cluster and it is independent from the metal–molecule distance.
The values of the transition dipole moments for the excitations at energy ω−, ω0, and ω+ are 16.3D, 9.3D, and 0.63D, respectively. Consequently, the peak at energy ω+ is ascribed as a dark mode.
At this point, it is important to observe that reasoning in these terms, we are neglecting higher order multipole–multipole type interactions that become important when the interacting particles come very close, which is our case, thus when the relevant interactions we are dealing with are of the type of chemical effects.
To keep into account possible effects such as the charge transfer, going beyond the classical dipole–dipole interaction model, we quantified the transition densities computing the integral over x–y plane of the three-dimensional transition densities
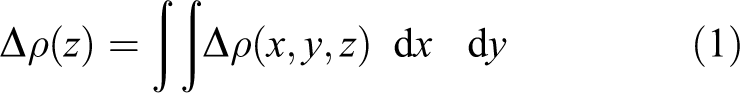
An example of this calculation, for the system at a distance of 4.5 Å, is reported in Figure 6. It emerges that the transition density at the metal cluster (gray filled circles at

Then, we evaluated the integral on the cluster z coordinates by calculating

The integration boundaries relative to the integral in equation (2) are chosen to consider all the silver z coordinates up to half the metal–molecule distance along the z-axis.
Evaluating the integral in equation (2) for the system at d = 4.5 Å, we obtained a small but positive value of 0.11e, which indicates that the charge fraction is passing from the molecule to the cluster. This analysis has been made for all the distances characterized by the presence in the spectra of the two peaks and for all of them we obtained small and positive values.
Although the coupling mechanism can be corrected taking into account a charge-transfer contribution, it is evident that it can be substantially explained in terms of a plasmon–exciton electromagnetic interaction model. Regarding this point, from an analysis of the ground-state density, it appears that the distribution of the density on the cluster at a distance of 2 Å from the molecule results slightly higher than its density distribution at 60 Å, this supporting the idea that there is a transition of the molecular charge toward the metallic counterpart. The more favorable transition goes, thus, from molecule to the cluster, but we have to take into account the presence of two barriers that the electrons of the molecule have to overcome, a spatial one and an energetic one, which diminish the transition probability, with a consequently very low charge-transfer contribution.
Toward larger systems: A TD-DFTB approach
With the future goal to study larger hybrid metal–molecule systems of experimental interest, in this section, we present a TD-DFTB analysis on the system illustrated in the panel (a) of Figure 7, which is similar to the TD-DFT one discussed in the previous sections.

(a) Schematic picture of the plasmonic nanocluster–molecular emitter system. The system is composed of a molecule of COOH-B-TS positioned perpendicularly to the base of the tetrahedral Ag20 and put near the vertex. 27 (b) TD-DFTB absorption spectra for the system. The black solid spectra correspond each to a different distance explored, going from 2 Å to 5 Å. The red dashed curve is the TD-DFTB absorption spectrum of the bare Ag20 and the blue dot-dashed curve is the TD-DFTB absorption spectrum of the molecule. The purple dashed lines show that the first peak at energy ω− in each spectrum redshifts by reducing the metal–molecule distance, as long as the position of the second peak at energy ω0 remains substantially unchanged and does not depend on the metal–molecule distance. The spectra are obtained by applying a Gaussian broadening of 0.02 eV. TD-DFTB: time-dependent density functional-based tight-binding.
The molecule selected is stilbene, the simplest molecule in the class of α,ω-diphenylpolyenes, 41 functionalized with a benzene ring and a COOH group.
Thus, as for t,t-DPB, stilbene also belongs to the class of molecular photo-switches, changing reversibly its spatial conformation passing from a cis-state to a trans-state and vice versa, through the interaction with a particular wavelength of light.
As metallic counterpart, we considered the same tetrahedral cluster of Ag20 used for the TD-DFT analysis first reported.
As it can be seen from the TD-DFTB absorption spectra on the isolated systems reported in the panel (b) of Figure 7, the chosen molecule is optically active in a spectral range exactly overlapping the Ag20 one. The black solid curves correspond to the absorption spectra of the whole system with each spectrum associated to a different explored distance, going from 2 Å up to 5 Å.
The effect of the interaction between the localized surface plasmon of the Ag20 cluster and the molecule excitation leads to the appearance, from the threshold distance of 3.8 Å, of two peaks, one at energy ω−, which progressively redshifts by reducing the metal–molecule inter-distance, and the other at energy ω0, which is independent from such distance, as it is clearly visible from the dashed lines on Figure 7, panel (b).
It is evident that such trends in the optical spectra resemble the ones obtained from the TD-DFT analysis on a similar system first reported in Figure 2, making the previous observations quite general. This fact makes TD-DFTB an attractive theoretical scheme, providing the possibility to investigate on larger systems of interest for tunneling plasmonics and molecular plasmonics, as discussed in more detail in the paper of D’Agostino et al. 38
Conclusions and outlooks
In conclusion, in this work, we have presented a TD-DFT analysis on the plasmon–exciton interactions characterizing a model system composed of a t,t-DPB molecule and a tetrahedral cluster of Ag20, treating both the metal and the molecular counterparts atomistically.
As standard TD-DFT methods become computationally unsuitable for systems with more than 1000 of atoms (i.e. for common systems of interest in molecular plasmonics), it is important to consider TD-DFTB as a more efficient scheme.
Regarding this, by looking at the absorption spectra for the model system COOH-B-TS plus Ag20, TD-DFTB provides promising results, being in agreement with the TD-DFT results on a similar system.
It is important to highlight that the same trend characterizing the absorption spectra for the TD-DFT system is present in the TD-DFTB ones: a redshift of the peak at energy ω− reducing the metal–molecule inter-distance.
Thus, the performed TD-DFTB simulations appear as an encouraging starting point to be further investigated with the future perspectives to reduce the computational costs and to study larger systems of interest for experimental groups. In fact, several recent experimental works 42 –45 focused on how to tune the plasmon–exciton coupling in hybrid systems. To fulfil this objective, the fundamental requirement is the ability to precisely manipulate light on the nanometer scale.
Such kind of systems, involving both metal plasmons and molecular excitons, could open new opportunities for novel sensing, absorption and emission spectroscopy, and light-emitting and photovoltaic devices. 46
Footnotes
Authors’ note
The study reported in this article was partially presented at Trends in Nanotechnology’s 19th Annual Conference, Lecce, 2018.
Acknowledgments
We acknowledge the support of CINECA Consortium for the HPC facilities and the computational support (Project IIT17 quantum) and the IIT computational Platform of CBN@UNILE. The authors thank E Fabiano for useful discussions. GG is grateful to G Cuniberti and R Gutierrez for inspiring suggestions.
Declaration of conflicting interests
The author(s) declared no potential conflicts of interest with respect to the research, authorship, and/or publication of this article.
Funding
The author(s) received no financial support for the research, authorship, and/or publication of this article.