
Abstract
Polycrystalline cadmium hydroxide nanomaterials have successfully been synthesized by composite-hydroxide-mediated approach with growth time variation. The influence of growth time on structural, morphological, elemental, and optical properties was explored using X-ray diffraction, scanning electron microscopy, Fourier transform infrared spectroscopy, energy dispersive X-ray spectroscopy, and ultraviolet–visible spectroscopy. X-ray diffraction results revealed the hexagonal and monoclinic phases of cadmium hydroxide along with rhombohedral impurity phase of cadmium carbonate. Fourier transform infrared spectroscopy further endorsed the X-ray diffraction results and confirmed the Cd–O bonding vibrations. Time-dependent uniform distribution of spherical morphology was observed in the scanning electron micrographs of the product. The presence of cadmium and oxygen in the energy dispersive X-ray spectroscopy results fingerprinted the purity and formation of the desired nanomaterials. Crystallite size was decreased with the increase of growth time as estimated by the Debye–Scherrer method. Furthermore, the optical bandgap was measured by Tauc’s relation using ultraviolet–visible absorption spectra and found to be in the range of 3.2–3.5 eV.
Keywords
Introduction
Nanomaterials have gained valuable attraction due to large surface to volume ratio, unique structures, and high-rated optical properties. These materials have gained enormous attention due to technological development in various fields like solar cells, photonic crystals, and sensors. 1 Recently, extensive efforts have been made to synthesize metallic hydroxides, for example, magnesium hydroxide, copper(II) hydroxide, and nickel(II) hydroxide, due to their use as precursors for the preparation of corresponding metal oxides. 2 –11 Among these divalent metallic hydroxides, cadmium hydroxide (Cd(OH)2) is an important n-type semiconductor with a number of possible applications including batteries, 12 –16 solar cell, 17 sensors, 18 supercapacitors, 19 phototransistors, photodiodes, and transparent electrodes. 20 Moreover, Cd(OH)2 is a precursor for the preparation of cadmium oxide, cadmium selenide, and cadmium sulfide. 12 A number of techniques have been employed for the synthesis of Cd(OH)2 nanomaterial including chemical coprecipitation method, hydrothermal method, and electrochemical deposition. 21 –24 In comparison of these techniques, composite-hydroxide-mediated (CHM) approach is cost-effective, more versatile, environmental friendly, and having ability to cover broad range for the synthesis of nanoparticles.
In this versatile approach, mixture of molten hydroxides (sodium hydroxide (NaOH) and potassium hydroxide (KOH)) with fixed molar ratio (51.5 and 48.5%, respectively) with no surfactants or capping reagents have been used for the synthesis of a wide range of nanostructures. 25 Moreover, the crystallite size, structure, and morphology of the nanoparticles prepared by this approach depend on the process parameters like temperature and growth time. 25 For example, Shahid et al. 26 explored the dependency of process temperature for the preparation of nickel(II) oxide nanostructures by CHM approach. This approach is widely used to produce multifunctional doped transition metal oxides for many interesting properties. 27,28 In the present work, we are aimed to synthesize Cd(OH)2 nanomaterials by CHM approach and to investigate the dependency of their structural, morphological, elemental, and optical properties on process time. According to the best of authors’ knowledge, this approach is used for the first time to synthesize Cd(OH)2 nanoparticles.
Experimental setup
Synthesis of Cd(OH)2 nanomaterials
Cd(OH)2 nanoparticles were synthesized by CHM approach. All the chemicals used are of analytical grade including cadmium nitrate (Cd(NO3)2), NaOH, and KOH, purchased from Sigma-Aldrich (St. Louis, Missouri, USA) and used as received. Mixed NaOH and KOH weighted 10 g in the ratio of 51.5 and 48.5%, respectively, were taken in Teflon beaker and placed in a preheated furnace at 200°C for 10 min. Then 3 g of Cd(NO3)2 was added in molten hydroxides mixture and shaken well for uniformity and again placed in the furnace for 12 h. After 12 h, the furnace was switched off and samples were naturally cooled down. The product was collected and then washed with deionized water and filtered to eliminate the residual salts and hydroxides. The same process was repeated to prepare the samples for process time of 24, 36, and 48 h. The following chemical reaction took place for the formation of Cd(OH)2 nanoparticles

Characterization
The crystal structure of as-synthesized product was explored by X-ray diffractometer (PANalytical-PW 340/60 X’pert PRO) with copper (Cu) Kα radiation (λ = 1.5406 Å), operated at 36 mA and 36 kV. Morphology and chemical composition were examined by VEGA3 TESCAN (Thermo scientific, US), operated at 20 kV equipped with energy dispersive X-ray spectroscopy (EDS). Fourier transform infrared (FTIR) spectroscopy was done by PerkinElmer (Arcoptix, Switzerland) spectrometer for spectral range 500–5000 cm−1. The ultraviolet–visible (UV-Vis) spectra were recorded in the spectral range 250–900 nm using PerkinElmer 950 spectrophotometer.
Results and discussion
X-ray diffraction analysis
X-ray diffraction (XRD) was performed to examine the crystal structure and phase purity of the prepared Cd(OH)2 nanoparticles. Figure 1 presents the XRD patterns of Cd(OH)2 nanoparticles prepared at different process times of 12, 24, 36, and 48 h. Sharp diffraction peaks corresponding to hexagonal (001), (100), (101), (002), (102), (110), (111), (201), (103), and (202) phase are consistent with JCPDS (01-073-0969) of Cd(OH)2. Some diffraction peaks (020), (110), (130), (220), (240), (−312), and (161), corresponding to monoclinic phase, were also observed and closely matched with the JCPDS (00-020-0179) of Cd(OH)2. The peaks represented by (•), Figure 1, corresponded to rhombohedral impurity phases of cadmium carbonate (CdCO3) as confirmed by JPCDS (00-008-0456) having planes (012), (006), (113), (202), and (116). The CdCO3 might be produced due to prolonged storage of the product in air, as we observed diffraction peaks corresponding to CdCO3 in XRD patterns of all the samples. The intensity of the peak corresponding to CdCO3 is higher, for the samples prepared for 12-h process time, than that of all other samples prepared for greater process time. It is clear from the XRD results that hexagonal phase is prominent and well-developed. The higher peak intensity of hexagonal phase depicts better crystallinity as compared to the monoclinic phase. Debye–Scherrer’s equation was used to estimate the average crystallite size (D) 29

where λ is the wavelength (λ = 1.542 Å) of Cu Kα radiations and β indicates full width at half maximum.

X-ray diffraction patterns of Cd(OH)2 nanomaterial prepared with the CHM method with variation in growth time. * Cd(OH)2-hexagonal; + Cd(OH)2-monoclinic, and • CdCO3-rhombohedral. Cd(OH)2: cadmium hydroxide; CHM: composite-hydroxide-mediated; CdCO3: cadmium carbonate.
The micro strain (ε) was calculated using the relation known as Williamson–Hall method 28

The dislocation density (δ) was calculated using formula 28

where D is referred to average crystallite size.
The grain size, micro strain, and dislocation density were estimated from the diffraction peaks corresponding to each phase in all the samples. It was observed that the grain size decreased with the increase in process time while that of micro strain increased with the process time, calculated from the hexagonal phase. The dislocation density for this phase varied between 1.1 × 10¹⁴ m−2 and 9.3 × 10¹⁴ m−2. The particles were well grown with reduced size as the process time was increased from 12 h to 24 h. The inverse behavior, of the grain size and micro strain, was observed for the case of monoclinic phase. The dislocation density was found to be almost constant for the samples prepared at 12, 24, and 36 h and decreased for the samples prepared at 48-h process time. The grain size estimated from the rhombohedral impurity phase was found to decrease with the increase in process time, whereas micro strain was increased, and an abrupt increase in the value of dislocation density was observed for the samples prepared at 48-h process time as presented in Table 1.
Structural parameters of Cd(OH)2 calculated by XRD data prepared by CHM approach.

XRD: X-ray diffraction; CHM: composite-hydroxide-mediated; Cd(OH)2: cadmium hydroxide; CdCO3: cadmium carbonate.
FTIR analysis
FTIR analysis was carried out in spectral range of 500–5000 cm−1 to examine surface characteristics and functional groups of the prepared samples of Cd(OH)2. FTIR spectra of Cd(OH)2 prepared for 12, 24, 36, and 48 h are shown in Figure 2. The absorption peaks at 500, 720, and 860 cm−1, observed in the FTIR spectra, were assigned to characteristics vibrations of Cd–O. In addition, samples prepared for 36- and 48-h process time also showed symmetric stretching modes of –OH group at 3607 cm−1, whereas the samples prepared for process time of 12 and 24 h showed weak stretching vibration around 3607 cm−1. The characteristics vibration stretching modes at 1386 cm−1 for 12-, 36-, and 48-h samples and 1400 cm−1 for 24-h sample were attributed to CO2 adsorbed from the atmosphere as assumed to be prolonged storage in the presence of air. As formation of CdCO3 was indicated in XRD results, Figure 1, therefore we can say that FTIR results endorsed the XRD results. 30
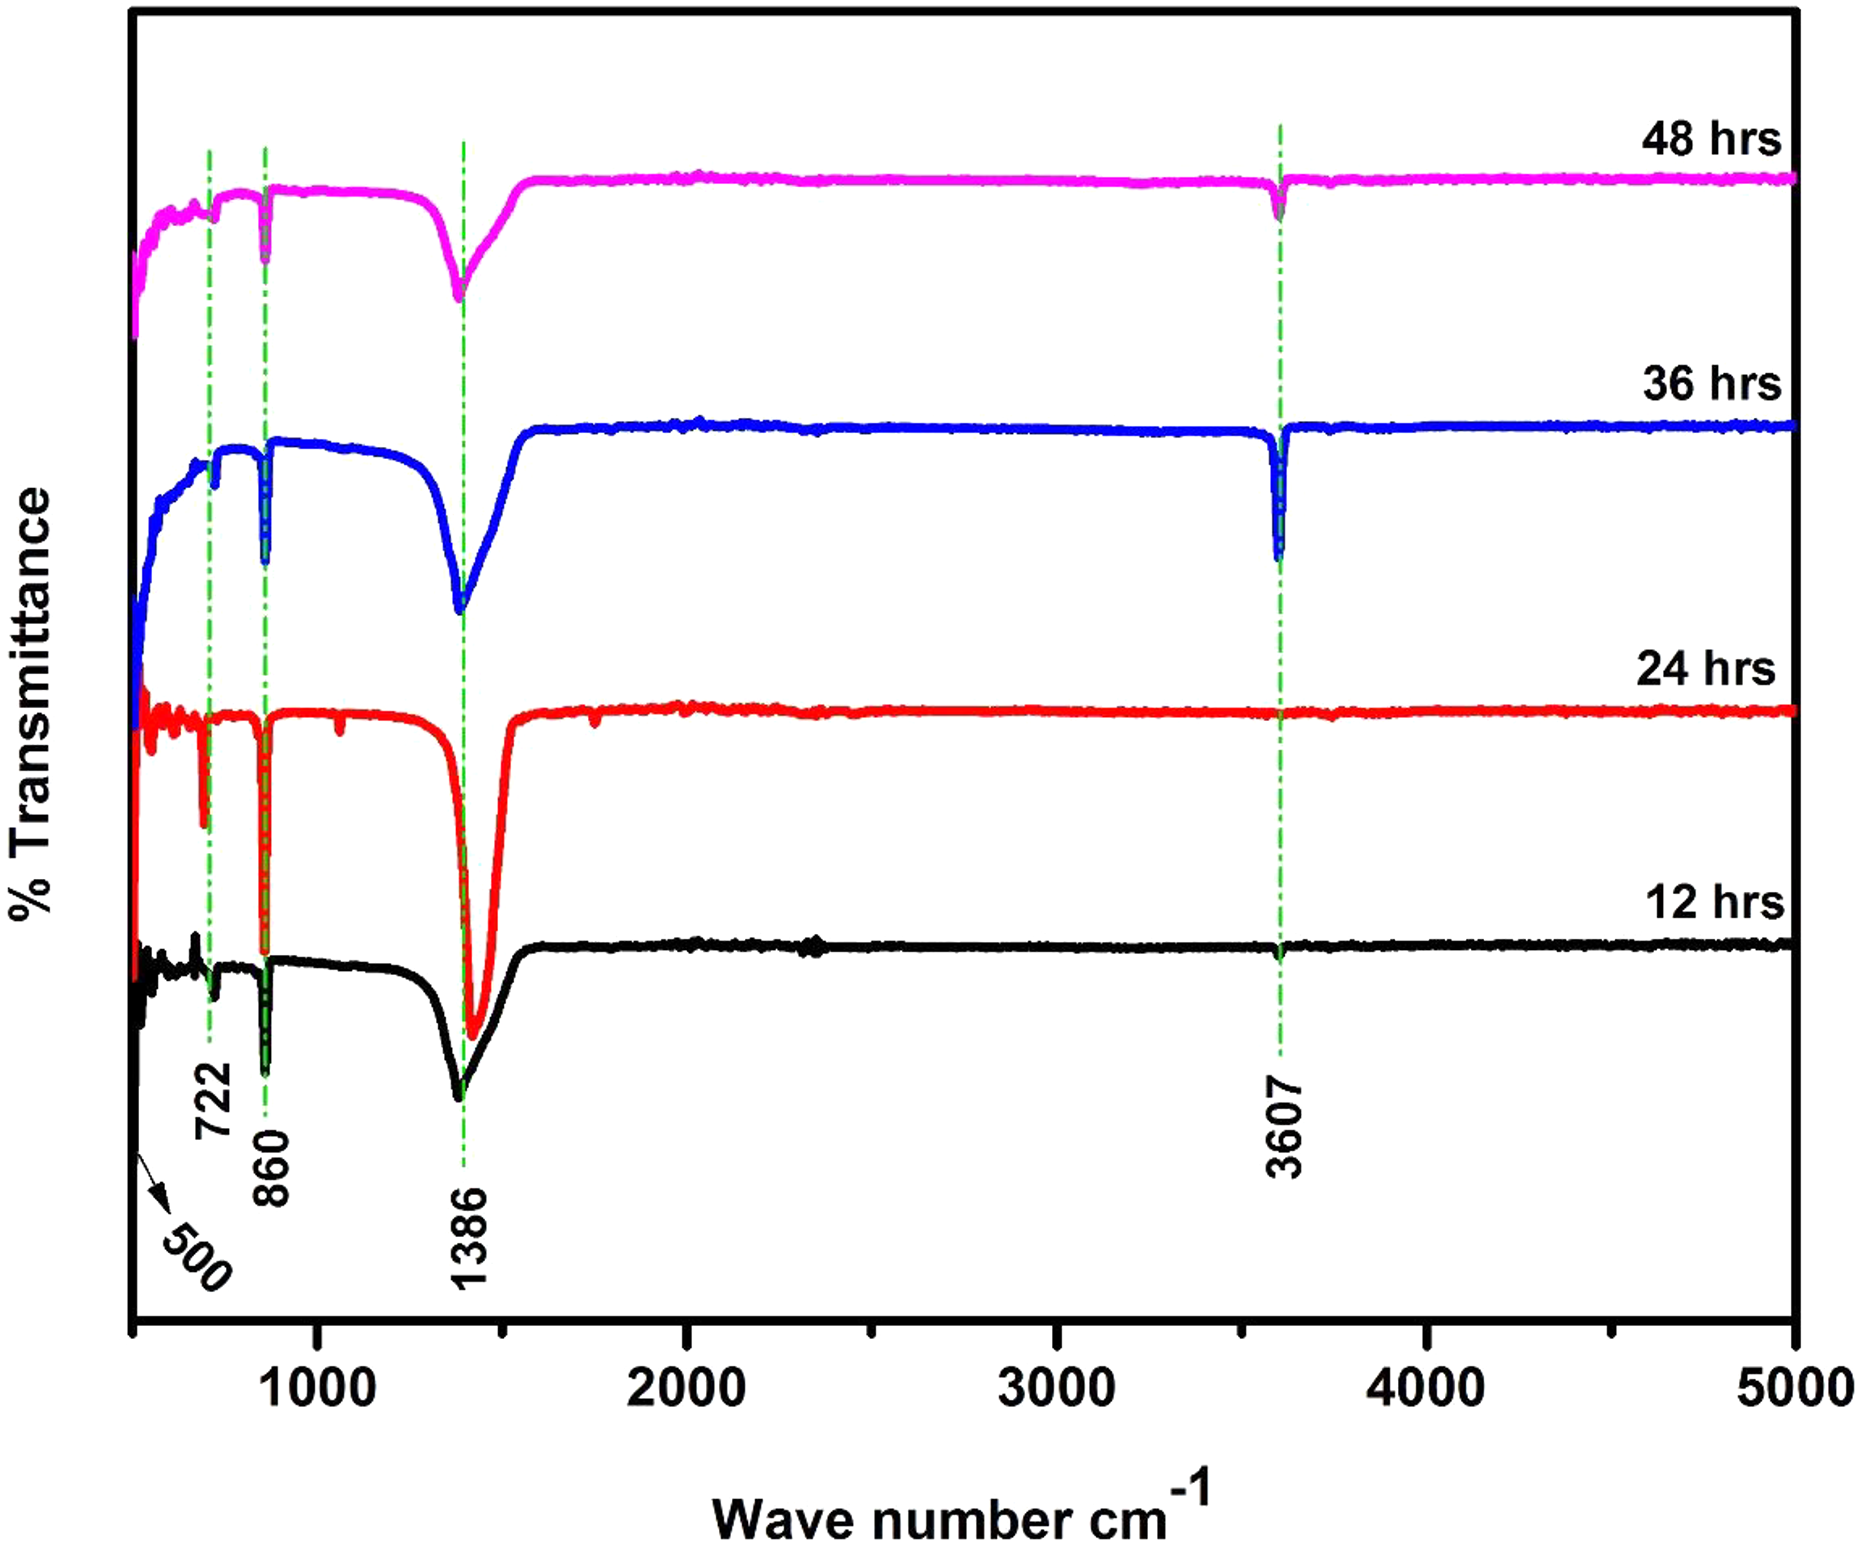
FTIR spectra of Cd(OH)2 nanostructures prepared at 200°C with growth time variation. FTIR: Fourier transform infrared; Cd(OH)2: cadmium hydroxide.
Scanning electron microscopy analysis
Scanning electron microscopy (SEM) and EDS were employed to examine the morphology and elemental composition of as-synthesized Cd(OH)2 samples. Surface of the particles was coated with carbon to prevent charge accumulation. SEM micrographs of Cd(OH)2 nanomaterials prepared for different process times are displayed in Figure 3(a) to (d). The secondary electron images showed spherical morphology of Cd(OH)2. Uniform distribution of the spherical particles was observed in all of the samples, whereas a small change in grain size was observed with increase in reaction time. The sample prepared for 12, 24, 36, and 48 h at 200°C temperature showed size distribution from 50 to 56 nm, 45 to 64 nm, 45 to 67 nm, and 42 to 76 nm, respectively. It was concluded that the size of spherical grains was increased with increasing process time. EDS was carried out to check the purity and elemental analysis of Cd(OH)2 nanoparticles prepared at different process times and are displayed in Figure 4(a) to (d). EDS spectrum confirmed the presence of cadmium and oxygen in all the samples with carbon as impurity. The size distribution was estimated using image processing software ImageJ. 31 Therefore, spherical nano-assemblies of Cd(OH)2 have successfully been prepared by a cost-effective and viable method without using any capping agent.

SEM micrographs of Cd(OH)2 nanostructures prepared at 200°C for a reaction time: (a) 12 h, (b) 24 h, (c) 36 h, and (d) 48 h. SEM: scanning electron microscopy; Cd(OH)2: cadmium hydroxide.

EDS spectra of Cd(OH)2 nanomaterial prepared by the CHM method at 200°C with growth time variation: (a) 12 h, (b) 24 h, (c) 36 h, and (d) 48 h. EDS: energy dispersive X-ray spectroscopy; Cd(OH)2: cadmium hydroxide; CHM: composite-hydroxide-mediated.
UV-Vis spectroscopy
UV-Vis absorption spectra is recorded in the range of 320–900 nm to estimate the bandgap energy of as-synthesized Cd(OH)2 nanomaterials. UV-Vis absorption spectra and corresponding calculated bandgap energies are presented in Figure 5(a) and (b). Bandgap energies of all the samples were calculated by Tauc’s relation using absorption data 32

where Eg represents optical bandgap in eV, hv indicates photon energy in eV, h specifies the Plank’s constant, B is a constant of proportionality, n represents the type of transition, n is equal to 2 for direct band transition and 1/2 for indirect band transitions, and α is the absorption coefficient calculated using the formula 32

where t is the path length of quartz cuvette and A is the absorbance of the material. 27 As the Cd(OH)2 is a direct bandgap energy nanomaterial, so a graph was plotted between (αhυ)2 versus photon energy (hv). Bandgap values could be estimated by extrapolating the straight-line part of the curve to the energy axis. The bandgap energy values were found to be 3.2, 3.5, 3.47, and 3.38 eV for the samples prepared at 200°C with different process times of 12, 24, 36, and 48 h, respectively, as presented in Figure 5(b). Our bandgap energy values for the samples of Cd(OH)2 are well matched with literature, 12 which also confirmed the successful formation of the desired samples and their potential applications. Furthermore, bandgap energy values blue shifted with the increase in process time and decrease in grain size of the nanoparticles are clear indication of quantum confinement effects. 33 Hence, the bandgap energy values of Cd(OH)2 nanomaterials, prepared by a viable, scalable, and cost-effective approach, could be tailored significantly just by varying the growth time.

(a) UV-Vis. absorption spectra of the CHM prepared Cd(OH)2 at 200°C with growth time variation, (b) The (αhv)2 versus hv plot of as prepared Cd(OH)2. Eg is the intercept of the line at the h-axis for the bandgap calculation. UV-Vis: ultraviolet–visible; CHM: composite-hydroxide-mediated; Cd(OH)2: cadmium hydroxide.
Conclusion
In summary, Cd(OH)2 nanomaterials have been successfully prepared by CHM approach. The effect of growth time is explored on average particle size, structural, morphological, and optical properties of as-synthesized Cd(OH)2 nanoparticles. XRD results confirmed dominating hexagonal structure with average grain size of about 33.4–38.5 nm. The optical absorption analysis revealed the absorption in visible region. Moreover, Cd(OH)2 nanoparticles showed direct bandgap which blue shifted with the decrease in average grain size which is an indication of quantum confinement effect. FTIR analysis confirmed the bonding and purity of Cd(OH)2 nanoparticles. The surface morphology showed time-dependent uniform distribution of nano-sized spheres having common bases. EDS analyses confirmed the composition of the product. The results showed that CHM is a versatile technique to grow a number of oxide and hydroxide nanoparticles. Further, just by changing the growth time, crystallite size, morphology, and optical bandgap can be tailored which are crucial for different practical applications, for example, solar cells, photodiodes, phototransistors, cathode materials of batteries, transparent electrodes and sensors, and so on.
Footnotes
Acknowledgments
The authors greatly acknowledge Quaid-i-Azam University, Islamabad, Pakistan, the Institute of Space Technology, Islamabad, Pakistan, and the National University of Science and Technology, Islamabad, Pakistan, for providing characterization facilities.
Declaration of conflicting interests
The author(s) declared no potential conflicts of interest with respect to the research, authorship, and/or publication of this article.
Funding
The author(s) received no financial support for the research, authorship, and/or publication of this article.