
Abstract
Recently, barium carbonate nanomaterial has been shown to be a proven versatile candidate for the catalysis and sensor applications. The catalytic and sensing efficiency can be improved by making barium carbonate composite with a suitable transition element. In this regard, the preparation of barium carbonate and its composite with nickel during the synthesis process is presented with the composite-hydroxide-mediated method, an effective, feasible, and low-temperature synthesis route. The nanomaterial produced is monitored for the structural and optical properties with various diagnostic methods. The X-ray diffraction results show the presence of orthorhombic structure of barium carbonate in both pure and 5% nickel samples. A mixed structure is formed with the phases of barium carbonate, Ba(NO3)2, and Ni(NO3)2 for the sample with 15% nickel. The average crystallite size estimated is in the range of 14–22 nm. The scanning electron microscope pictures captured on silicon (Si) covered with the product material reveal interesting rods, needle, and flower-type morphological features. The bandgap energy obtained by diffused reflectance spectroscopy is in the expected range of 5.48–5.71 eV. The proposed method seems effective to provide a feasible route for the synthesis of a broad range of nanomaterials for research purposes.
Keywords
Introduction
In recent years, nanotechnology has given birth to numerous nanomaterials due to their increased use in various sectors of research and development. To produce these nanomaterials, nanotechnology further has opened several rooms for the potential novel methods. Composite-hydroxide-mediated (CHM) method is one of the recent chemical synthesis routes that have gained considerable importance in research due to their effortlessness and versatile nature, covering a broad range of nanomaterials to prepare. Compared to other chemical methods, CHM is quite a simple and environmentally appealing method. CHM is a straightforward approach, based on the use of molten hydroxides (NaOH:KOH) and basic source material. 1 Recently, this method has been used to prepare a variety of nanostructures including BaTiO3, CdO, ZnO, NiO, and so on. 2 –5 Shahid et al. have applied this method to prepare Zn(II)-CuO composite and probed the structural and optical properties. 6 The reported results show that the method seems to be a feasible and an effective route to produce various composites directly during the synthesis process. In this work, we have considered this approach for the synthesis of barium carbonate (BaCO3) and Ni-BaCO3 composites.
In heavy metal carbonates, BaCO3 is an important material with industrial applications. 7 –18 It crystallizes into three polymorphisms (i.e. orthorhombic, hexagonal, and cubic), but only the orthorhombic phase is obtained under the ambient conditions. BaCO3 is a thermodynamically stable crystal compared to other heavy metal carbonates (ACO3, A = Sr, Pb, and Ba). Nano-BaCO3 has several potential applications in diverse fields of science and technology. 7 –18 Compared to other metal catalysts, BaCO3 nanoparticles and their composite nanostructures have shown improved catalytic activity for the excellent performance of solid-oxide fuel cell cathodes through the enhanced kinetic surface reaction process. 13 High degree of electrochemical activity has been reported for the magnesium-doped BaCO3 (BaMn0.51C0.49O3) cathode material produced by hydrothermal process. 14 In a recent report, the controlled structures and luminescence properties of lanthanide-doped BaCO3 through synthesis strategy have greatly facilitated the development of novel optical materials for photonic devices. 15 It is also a well-known precursor material for the magnetic ferrites and gas sensor application. 11,18 Even though nanosized BaCO3 can be produced. by different techniques like sol-gel techniques, auto-combustion of citrate–nitrate gel, CHM, microemulsion-mediated solvothermal route, the reversed micelles method, the semibatch crystallizer process, self-organized formation, microwave-assisted route, sonochemical synthesis, electrodeposition, CHM, and so on, 14 –34 CHM methodology is an attractive route in many aspects to synthesize BaCO3 nanomaterial in various morphologies and offers several other advantages. Technically, the method is sound, friendly to environment, and easy to apply for the preparation of a wide range of significant nanostructures. The present paper is closely relevant to the work previously done in the group. 2 –6 The aim of the work is to further investigate potential of the method for a large production of various nanomaterials for research purposes.
In this article, we have described the synthesis of pure and Ni-BaCO3 nanostructured composites with the CHM approach and examined feasibility of the method for low and high nickel contents at various synthesis conditions. The prepared nonmaterial has been monitored using X-ray diffraction (XRD), Fourier-transform infrared spectroscopy (FTIR), diffused reflectance spectroscopy (DRS), and scanning electron microscopy (SEM). Influence of the incorporated nickel has been investigated on the structural, morphological, and optical properties, and formation mechanisms are explicated. The method seems quite fit for the synthesis of pure Ni-BaCO3 composites and is expected to yield a wide range of technologically important composite nanomaterials for the sensing and catalysis applications.
Experimental
Synthesis procedure
Chemical reagents were purchased from Merck Co. (Pharmaceutical Company, Darmstadt, Germany) with quoted purity 99.99%, hence used without any further purification, which included Ba(NO3)2·3H2O, Ni(NO3)2·3H2O, NaOH, and KOH. Experimental procedure for the synthesis of nanomaterials using CHM is given in our previous reports. 2 –6 Briefly, a 10 g of mixed hydroxides (NaOH:KOH = 51.5:48.5) was taken in a Teflon vessel and heated up to 200°C in a preheated furnace. When the hydroxides were totally molten, an amount of 2.5 g of Ba(NO3)2·3H2O was added and the mixture was stirred until a uniform precursor was obtained. This procedure was also done for Ni-BaCO3 nanostructures (composites) where Ni(NO3)2·3H2O was added in the quantities as 5% and 15%. The whole procedure lasted for about 24 h. A certain amount of precursor was dissolved in various volumes of deionized water. After aging for several hours, the product was filtered and washed thoroughly by deionized water to remove residual hydroxides. The washed crystals were dried at 40°C for 24 h. For BaCO3 formation, the possible mechanism may be suggested as follows: NaOH and KOH play the same role in the composite hydroxide melts. The simplified expressions for chemical reactions are written as


Reactions up to Ba(OH)2 formation are happened in the composite hydroxide melts in the Teflon vessel at 200°C, while the last reaction is expected to occur after the product is removed from the vessel. The obtained Ba(OH)2 reacts with CO2 in the atmosphere to form BaCO3 thoroughly during the subsequent washing and drying process. NaOH and KOH are high melting point melts, but CHM approach basically involves the chemical reactions in the eutectic hydroxides melts at a temperature of approximately 200°C. These hydroxides are used as an important reaction medium to reduce the reaction temperature of the reactants for the preparation of a nanomaterial. A sketch of the procedure illustrating all the basic steps involved in the preparation of BaCO3 from the basic salts is depicted in Figure 1.

Sketch of the CHM method illustrating preparation of BaCO3. CHM: composite-hydroxide-mediated; BaCO3: barium carbonate.
Characterization methods
Various diagnostic methods were employed to examine the formation of nanomaterial. XRD was done using the PANalytical diffractometer Bruker D-8 Discover X-ray diffractometer equipped with a CuKα-radiation (λ = 1.54186 A). FTIR (Perkin Elmer NICOLET-6700) of Thermo Electron Corporation, spectral range between 400–4000 cm−1. The samples were scanned for 2θ values in the range of 20–80° with a step size of 0.02°. Morphological analysis was made on the sample with electron microscopy using a BSE detector operated at 10 kV.
FTIR spectrum was studied with a PerkinElmer FTIR spectrometer in the required spectral range of 400–3000 cm−1 to probe the functional groups and the stretching vibration of C–O bond in BaCO3. The DRS spectra of the samples were measured in the range of 200–1500 nm using a PerkinElmer Ultra-violet (UV)/Visible (VIS)/Near infrared (NIR) Spectrometer Lambda 950 and the acquired data were used to estimate the optical bandgap.
Results and discussion
XRD is employed at the first instant to test and monitor the crystallized phases and impurity traces in the prepared material. These results are displayed in Figure 2(a) and (b). For the pure and 5% samples, all the observed diffraction peaks at 2θ values correspond to the reflection planes of BaCO3. The sharp diffraction peaks demonstrate the formation of a single-phase polycrystalline orthorhombic BaCO3. In both samples, no diffraction peak was recorded for any impurity traces. The XRD pattern obtained is closely matched with the reference pattern of BaCO3 (JCPDS# 00-005-0378). The peak intensities of (111) and (112) crystallographic planes shown in Figure 2(b) suggest that the orientation of most of the crystallites is along these planes. The 2θ reflection is lower angle shifted for the 5% nickel sample, which suggests incorporation of nickel impurity at the lattice sites. For the higher value nickel content of 15%, a departure from pure in to a mixed structure was observed, with the structure composed of the identified phases of BaCO3, Ba(NO3)2, and Ni(NO3)2. The average crystallite sizes calculated are tabulated in Table 1. The value of average grain size (D) was estimated with the Debye–Schrrer formula 35

where λ is the wavelength of the Cu Kα line (in nm) used, K is the shape factor, θ is Bragg’s angle, and β is the full width at half maximum.

(a) XRD pattern of BaCO3 nanomaterial prepared with CHM method for the pure, 5%, and 15% nickel samples (b) shows how preferential growth of the nanomaterial along particular planes depends on the low and high concentration of nickel. XRD: X-ray diffraction; CHM: composite-hydroxide-mediated; BaCO3: barium carbonate.
Structural parameters of pure and Ni-BaCO3 composite nanomaterial calculated from the XRD measurements.
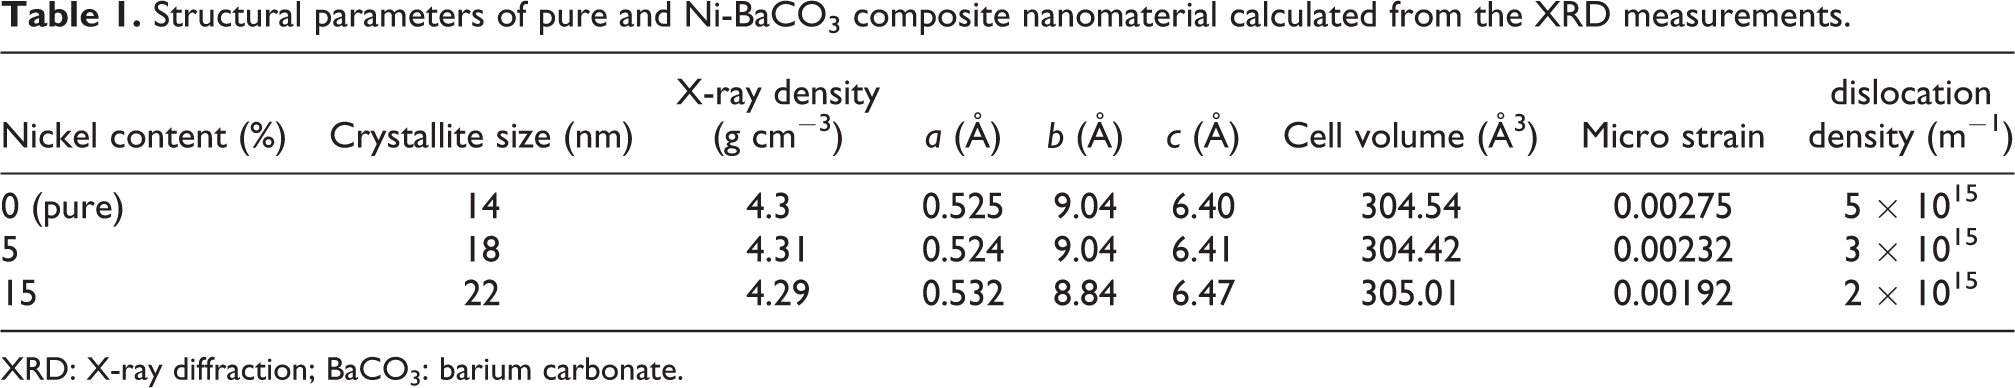
XRD: X-ray diffraction; BaCO3: barium carbonate.
The micro strain (ε) was calculated using the following relation called the Williamson–Hall method 36

The dislocation density (δ) 37 and X-ray density 38 were also calculated using the formulas


where “Z” is the number of molecules per formula unit, “M” is the molar mass, “NA” is the Avogadro constant, and V cell is the volume of unit cell. For dislocation density, the average grain size was used in equation (7). All the calculated structural parameters with average grain size are listed in Table 1. Clearly, the lattice parameters for the pure and 5% Ni-BaCO3 composites are closely in the range with standard values already reported in the literature. A significant change is noticed for the sample with 15% nickel. An overall increase in the crystallite size is observed with nickel.
For the chemical signature on the final product, FTIR spectra of the samples are given in Figure 3. The samples show characteristics vibration peaks of CO3 −2 in the range of 400–1800 cm−1. As evident from the figure, the strong absorption peaks observed at 694 and 854 cm−1 are assigned to the bending out-plane and in-plane vibrations of the (O–C–O) (CO3 −2) bonds, respectively. 39 The absorption bands at 1060 cm−1 are related to the symmetric stretching mode of C–O bond, whereas the bands at 1420 cm−1 are attributed to an asymmetric stretching vibration of the C–O bond. 40
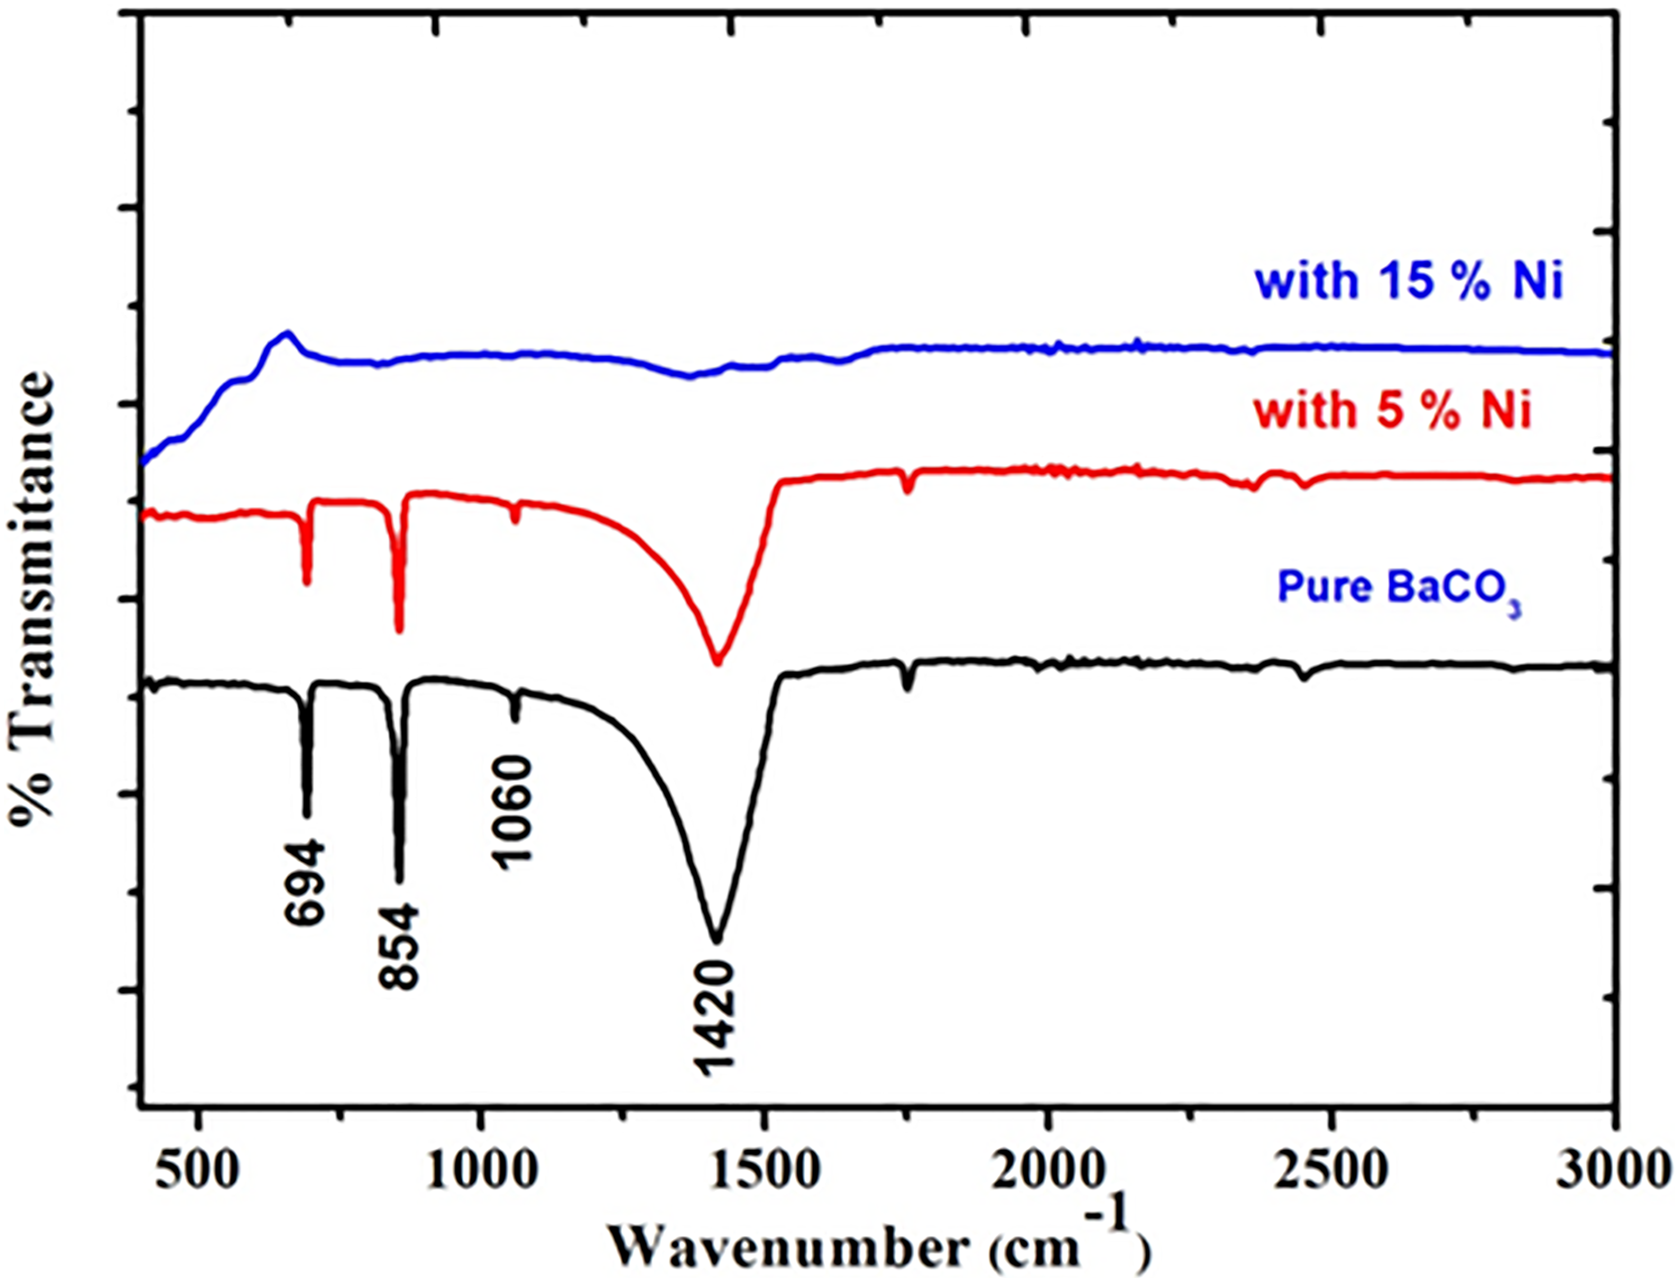
FTIR spectra of the pure and nickel-based composites (5% and 15%) of BaCO3 nanostructures prepared at 200°C for a constant reaction time of 24 h. FTIR: Fourier transform infrared; BaCO3: barium carbonate.
With the aim to assess the microstructure and morphology of BaCO3 and Ni-BaCO3 composite nanomaterials, a detailed analysis of the samples was done using electron microscopy. The SEM micrographs with low and high magnification are illustrated in Figure 4(a) to (f). Interesting hexagonal, needle, rods, and peony flower–type dense nanostructures are formed. Clearly, morphology of the nanostructure seems to change with nickel and seems strongly to depend on the added content of nickel. The microstructures are connected together on the bases, rooted in one center, and presented a beautiful rod and flower-like morphologies. The pure BaCO3 sample has rod-like orientation which is hexagonal-shaped as observed in the XRD results. From the SEM images, it seems that the rods are hollow, while the Ni-BaCO3 composite prepared at the same condition presents needle-like rods and flower-like structure. An interesting morphological structure is formed as the concentration of nickel was increased to 15%, where a mixed-type structure is formed. It is noteworthy to mention here that clearly rod-type morphology is obtained when the reaction time was reduced by four times the initial processing time. For the shorter reaction time of 6 h (Figure 4(g) and (h)), material is nucleated in the form of rods with an average diameter in the range of 0.130 to 0.54 µm. This validates the time-dependent mechanisms of crystallization of a nanomaterial with the CHM method. The nucleation and subsequent formation mechanisms of BaCO3 nanomaterial is based on the higher concentration of OH− ions in the growth solution and viscosity of the melts at the processing temperature. Both the hydroxide ions and viscosity of the melts favor to speed up formation process of BaCO3 peony flower nanostructures due to larger number of growth nuclei sites. At the beginning, only a few BaCO3 nuclei are produced; however, as the growth process progresses, surfaces of the produced BaCO3 nuclei either get a negative or a positive charge. The produced opposite charges (OH− and Ba+2) attract each other to form Ba(OH)2, which further reacted with CO2 to form BaCO3 and hydrogen molecule. The effect of kinematic viscosity of the melts on the formation of BaCO3 nanomaterial by CHM is still poorly understood due to the involved complex thermodynamics. However, it is noteworthy to mention here that a high viscosity medium reduces the speed of nucleation, aggregation, and recrystallization and results in the formation of bigger crystallites in the final nanoproduct.

SEM images of BaCO3 nanostructures captured at two different magnifications prepared by CHM at 200°C and processing time of 24 h. (a, b) Pure BaCO3, (c, d) 5% nickel, (e, f) 15% nickel, and (g, h) BaCO3 prepared at 200°C and reaction time of 6 h. SEM: scanning electron microscope; CHM: composite-hydroxide-mediated; BaCO3: barium carbonate.
DRS was performed in order to investigate the optical behavior of the prepared BaCO3 nanostructures. All the spectra were taken in the spectral range of 200–1500 nm. The DRS spectra variation of pure and composite Ni-BaCO3 prepared for 24 h at a constant temperature and reaction time are shown in Figure 5(a). The Kubelka–Munk model is applied to find the optical bandgap of the prepared samples, while the direct bandgap energies can be estimated from a plot of (F(R)hν)2 versus the photon energy (hν). 41 For this purpose, a well-known Kubelka–Munk function F(R)2 was estimated by the formula 42

and the bandgap energy was estimated by Tauc’s equation 43

where R is the reflectance, h is the plank’s constant, v is the frequency of the photon, hv is the photon energy in eV, Eg is the optical band gap in eV, A is a constant, and n is an exponent which is 2 for indirect band transitions and 1/2 for direct band transition. The direct band gap energy for the samples can be estimated by extrapolating the linear region of (F(R)hv)2 versus hv to the point F(R)2 = 0. Thus, the Eg is the intercept of the line at hv-axis. The obtained direct bandgap values are 5.51, 5.48, and 5.71 eV for the pure and 5% and 15% samples, respectively. The variation in bandgap of BaCO3 with nickel is constant and shown in Figure 5(b). The value of bandgap first drops followed up by an increase with nickel. No significant change was found by the optical study in the behavior of electronic insulation characteristics of BaCO3. A similar bandgap behavior was observed in previous study of NiO. 4 With grain size, the calculated bandgap shows quite a different behavior; initially it decreases and then increases and can be explained in two different frameworks. For the first case, we assume the decrease is due to the decrease in micro strain which reduces the strain energy and subsequently the bandgap energy drops. The internal micro strain strongly depends on the morphology which is different in our case and could be assuming coherent in our case of different morphological structures. For the second case, the crystallite size and energy bandgap (blueshift) are co-related by using the effective mass approximation. Under this approximation, the size dependence of the bandgap (E nano) can be represented as follows 44

where Enano and Ebulk are the bandgap of nano and bulk materials, respectively,
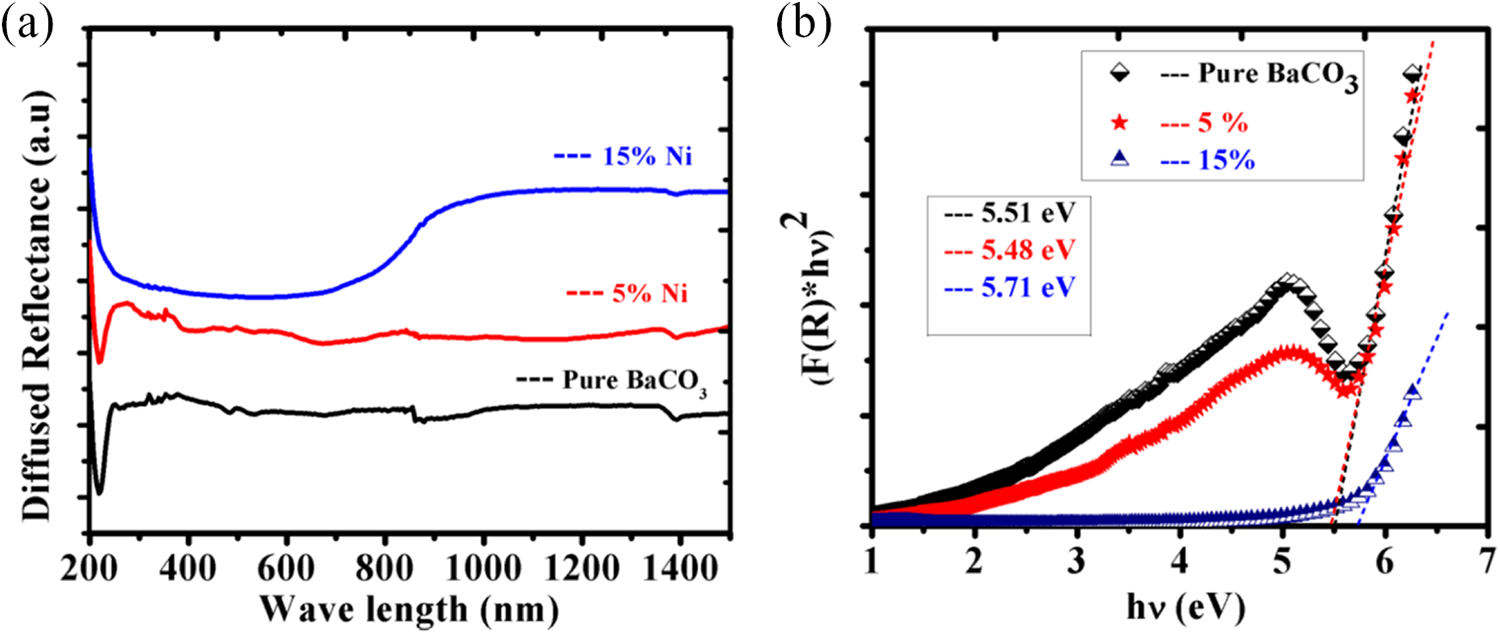
(a) Diffused reflectance spectra of the CHM prepared pure and nickel-based composite of BaCO3 nanomaterial at 200°C and constant reaction time of 24 h. (b) The (F(R) hv)2 versus hv plot of as prepared pure BaCO3 and Ni-BaCO3 composite materials. Eg is the intercept of the line at hv-axis for the bandgap calculation. CHM: composite-hydroxide-mediated; BaCO3: barium carbonate.
Conclusion
In summary, polycrystalline pure and Ni-BaCO3 nanomaterial composites were prepared with the CHM method and examined for the structural and optical properties using various diagnostic methods. The average crystallite size was in the range of 14–22 nm and increased with nickel concentration. For the lower value of nickel, nanomaterial was crystallized in a single orthorhombic phase with no impurity traces. For 15% nickel content, a mixed structure was formed and showed the solubility and reaction limit of the source materials with CHM at a particular reaction temperature and processing time. The hexagonal rods, needle-type, and flower-like structures were observed in the SEM micrographs and were strongly dependent on the nickel content and reaction time. The estimated bandgap was in the range of 5.48–5.71 eV and suggested that the electronic insulation behavior of BaCO3 was not changed considerably. These results manifest that CHM method is effective for the preparation of composite BaCO3 and can be tested for synthesis of other nanocomposites.
Footnotes
Acknowledgements
The authors greatly acknowledge Quaid-e-Azam University (XRD), National Centre for Physics (UV-visible), PIEAS (FTIR), and ICST (SEM and EDS) for all their cooperation and providing access to the existing characterization facilities presented in this article. They are also thankful to Dr Khalid Almgeer and Irfan Sabir for their appreciable cooperation in drafting this article.
Declaration of conflicting interests
The author(s) declared no potential conflicts of interest with respect to the research, authorship, and/or publication of this article.
Funding
The author(s) received no financial support for the research, authorship, and/or publication of this article.