
Abstract
Multilayer graphene-encapsulated iron nanoparticles in carbon frames were prepared through catalytic graphitization of kraft lignin as carbon sources using irons as the catalyst at the temperature of 1000°C under argon atmosphere. The effects of different iron loadings on the formation of multilayer graphene-encapsulated iron nanoparticles were investigated using thermogravimetric analysis and temperature-programmed decomposition. The evolution of gaseous products (H2, CH4, CO, and CO2) was measured using an online mass spectroscopy during the catalytic thermal decomposition of kraft lignin. Solid products were measured and characterized by elemental analysis, nitrogen adsorption, X-ray diffraction, scanning electron microscopy, high-resolution transmission electron microscopy, and Raman spectroscopy. Thermogravimetric analysis curves indicated that peak temperatures of lignin decomposition and carbonization shifted to lower temperatures with an increase of iron/lignin mass ratio. Experimental results showed that the lignin graphitization degree and conversion level to graphene materials increased significantly with the increase of iron/lignin mass ratio.
Keywords
Introduction
Lignin is the second major component of lignocellulosic biomass and the most important natural aromatics resources. 1 Lignin is generally classified into three major groups: softwood, hardwood, and grass based on their resources. 2 The chemical composition of lignin varies from different types of resources. Lignin is also classified by its different isolation processes: milled wood lignin, organosolv lignin, kraft lignin (or sulfate lignin), alkali lignin (or soda lignin), and lignosulfonates. 3 Kraft lignin is a by-product from kraft pulping process (also known as kraft or sulfate process), 4 which converts wood chips into wood pulping fibers. The white liquor containing a hot mixture of water, sodium hydroxide, and sodium sulfide is commonly used in a kraft process to break bonds linking lignin, hemicellulose, and cellulose of wood chips. Kraft lignin is then derived when pulping black liquor is precipitated and neutralized by acid washing. Kraft lignin can be precipitated from black liquor through lowering its pH value to 10 using a suitable acid because kraft lignin is only soluble in alkaline solution. Research activities were found in the development of processes of thermal decomposition of lignin to sustainable/renewable energy, 5 fuels, 6 chemicals, 7 and carbon-based nanomaterials like active carbons, 8,9 carbon fibers, 10 templated carbon, 11 graphene 12 and carbon foams. 13 –15
Magnetic nanoparticles embedded in carbon frames are effective electromagnetic interference materials which can be used to protect human being from hazards of space radiation. 16 Graphene-encapsulated metal (copper, iron, and nickel) nanoparticles can be synthesized from kraft lignin as a carbon source through a one-step catalytic graphitization process. 17,18 In the process of catalytic graphitization of kraft lignin, catalysts play an important role in accelerating involved reactions such as depolymerization, heteroatom removal, and carbonization. Moreover, Fe-based catalysts are practically suitable for lignin graphitization because of its relatively high activity and also low cost for recycling and disposal as environmental-friendly materials. Previous work 19 demonstrated that good initial iron catalyst dispersion as well as subsequent uniform distribution were critical to the performance of irons as catalysts in catalytic graphitization of lignin. The catalytic activity of an iron nanoparticles-based catalyst can be improved through uniformly blending iron nanoparticles into lignin matrix, but the enhancement of the blending on the catalytic activity is less than that is obtained through coprecipitation of iron nitrate salt with lignin. 20 The contact degree of iron catalyst to lignin can have significant effects on catalyst dispersion and activity. There are several strategies which can be adapted to increase the contact degree of iron catalyst to kraft lignin. The catalytic activity of an iron catalyst can be improved through modifying its physical and chemical structures such as crystalline size, pore structure, dispersive degree, Fe precursor phase, and Fe active phase. 21 In addition, the poor dispersion property of iron on lignin is not favorable to increase the contact of active components and lignin. Therefore, improving the dispersion of iron and controlling the size of iron nanoparticles can be alternative strategies to improve the catalytic performances of iron–lignin materials. The catalyst components dispersed on lignin are usually more active when they directly contact with lignin if considering that the graphitization degree of lignin is related to the contact degree between iron and lignin. The graphitization degree of carbon materials can be enhanced through the increase of a catalyst loading. 22,23 Theoretically, the higher a catalyst loading is, the higher contact degree can be obtained. The content of iron in an Fe-lignin mixture usually has an optimal value. When the amount of iron is low, the enhancement of catalytic activities of iron is not obvious because most of lignin is out of the reach of catalyst. On the contrary, when the amount of iron is too high, the size of iron particles may grow large quickly due to the agglomeration and sintering during the thermal treatment process, which results a process being uneconomical and having a poor catalytic performance of iron. 24
The effects of catalyst loading on direct liquefaction of coal, 25 coal combustion, 26 and coal or carbon gasification 27 were reported. Wagner et al. 26 discovered that the combustion rate of coal increased with the increase of catalyst loading. Li et al. 28 reported that coal conversion increased significantly with an increase of catalyst loading. Veraa and Bell 29 examined the effect of alkali metal catalysts on gasification of coal char and reported that coal char gasification rate was enhanced with an increase of K2CO3 loading, and the production of CO increased with an increase of K2CO3 loading, while CO2 and H2 decreased and the production of CH4 was suppressed. Sharma et al. 30 investigated the effect of catalyst addition on gasification of coals and found out that gasification rates increased with the increase of catalyst loading.
In this study, graphene-encapsulated iron nanoparticles (GEINs) embedded in carbon frame were synthesized through catalytic graphitization of kraft lignin. Catalyst loading is an important factor for catalytic graphitization of lignin. It is expected that the increase in catalyst loading could increase its catalytic performance. The effect of five iron loadings, 5% (weight percentage, i.e. 95 parts of lignin and 5 parts of iron), 7.5%, 10%, 12.5% and 15%, on the catalytic graphitization of lignin was investigated. The goal was to find out the optimal iron loading through analyzing different catalyst loadings on the formation of multilayer graphene-encapsulated iron nanoparticle (MGEINs) embedded carbon frames from kraft lignin.
Experiment
Fe-promoted kraft lignin precursors
The precursors of iron ions with kraft lignin (a product of BioChoice from Domtar, Fort mill, SC) were prepared through a coprecipitation method. Five loadings of iron nitrate nonahydrate, 20.5, 38.9, 59.9, 105.5, and 130.4 g, were added to each of five volume levels of Deionized (DI) water, 12.5, 25, 37.5, 62.5, and 75 mL, hold in a 500-mL glass beaker, respectively. All five mixtures were stirred for 30 min, followed by each of these five iron nitrate solutions being drop-like added to its respective tetrahydrofuran kraft lignin solution (100 g lignin in 100 mL tetrahydrofuran). The final all mixtures were stirred for 2 h, followed by keeping the mixtures at room temperature for 24 h, then transferring the mixtures to an oven where all mixtures were dried at 110°C for 1 day. Five loadings of Fe-promoted kraft lignin precursors (FKLPs) were ready for the next step of thermal treatment.
Thermal treatment
Fifteen grams (15 g) of each of five Fe loadings of FKLPs were packed in the middle of a 1-inch outside diameter (OD) ceramic tubular reactor for each of five runs, respectively. The heating process started with first introducing the carrier gas—argon (99.99% purity) into the reactor at a flow rate of 50 mL/min for 30 min, followed by increasing the temperature at a rate of 10°C/min to 1000°C, keeping the temperature at 1000°C for 1 h, finally, cooling down the reactor temperature by 10°C/min to room temperature. Outlet gaseous products were collected and analyzed using an Agilent 6890 gas chromatograph equipped with a thermal conductivity detector, a flame ionization detector, and a capillary column (Carboxen®-1010 PLOT column, 30 m × 0.53 mm I.D.), and argon was used as the carrier gas with a flow rate of 4.2 mL/min. Liquid products were collected by a cold trap and analyzed off-line using an Agilent quadrupole type gas chromatography–mass spectrometry (GC-MS) system.
Thermogravimetric analyses
Thermogravimetric analysis (TGA) of FKLPs was carried out in a TGA (Shimadzu TGA-50H, Shimadzu Scientific Instruments, Kyoto, Japan) through isothermal analyses. Argon (99.99% purity, 50 mL/min) was flown through the TGA at 50 mL/min as the temperature was ramped at 10°C/min.
Temperature-programmed decomposition
Temperature-programmed decomposition (TPD) experiments were carried out using an Autochem 2920 reaction system (Micromeritics, Norcross, GA). One gram from each of five loadings of FKLPs was used in each run. Volatile species from the TPD process were measured using an online residue gas analyzer (Hiden Analytical, Livonia, Michigan).
Elemental analyses
The carbon (C), hydrogen (H), nitrogen (N), and sulfur (S) contents in raw kraft lignin and solid products of thermally treated FKLPs (TFKLPs) were measured by a PerkinElmer PE 2400 CHN Elemental Analyzer (PerkinElmer, Waltham, MA).
Characterization
Surface area of TFKLPs was carried out using an automatic adsorption unit Autosorb-1, Quantachrome. The TFKLPs samples were degassed at 300°C for 5 h prior to the analysis to remove any adsorbed moisture or other impurities bounded to the surface of the sample. X-ray powder diffraction (XRD) patterns of TFKLPs were obtained to measure their crystalline structures using a Rigaku Ultima III X-ray Diffraction System (Rigaku, Woodlands, TX) operated at 40 kV and 44 mA using Cu-Kα radiation with a wavelength of 1 5406 Å, from 15° to 80° at a scan rate of 0.02°s−1 . The Jade powder diffraction analysis software from Materials Data, Inc. was used for both qualitative and quantitative analyses of polycrystalline powder materials. The mean particle size was calculated for the most intense diffraction peaks of α-Fe, γ-Fe, and Fe3C using the Scherrer formula. The morphology of a TFKLP was investigated with a scanning electron microscope (SEM). All SEM samples of TFKLPs were pre-coated with 10 nm Pt before introduced into the vacuum chamber. The system was operated with an accelerating voltage of 10 kV. The particle sizes of TFKLPs were examined with a JEOL JEM-100CX II transmission electron microscope (JEOL, Peabody, MA) (TEM) operated at an accelerating voltage of 200 kV. All TEM samples of TFKLPs were sonicated in ethanol solution for 1 min before transferred to copper grids. Raman spectra of TFKLPs were obtained on a Jobin-Yvon microspectrometer equipped with an excitation laser source emitting an incident power at 514 nm around 1 mW on a thin surface to identify the presence of graphite and disordered amorphous carbon in measured TFKLPs. Twenty spectra were collected for each sample run. Deconvolution of the spectra was performed with the assumption of mixed Gaussian/Lorentzian peaks describing both main D- and G-bands and two minor ones. The D, G, and 2-D peaks were fitted with Lorentz functions. The I D/I G ratio was calculated using the height of D and G peak intensities.
Results and discussion
Thermal analyses
Thermogravimetric analysis
TG and differential thermogravimetry (DTG) curves (Figure 1) of FKLPs with five iron loadings show that their mass loss had four stages. The peak temperature, mass loss, and maximum mass loss rate at each four stages were compared (Tables S1 to S3).
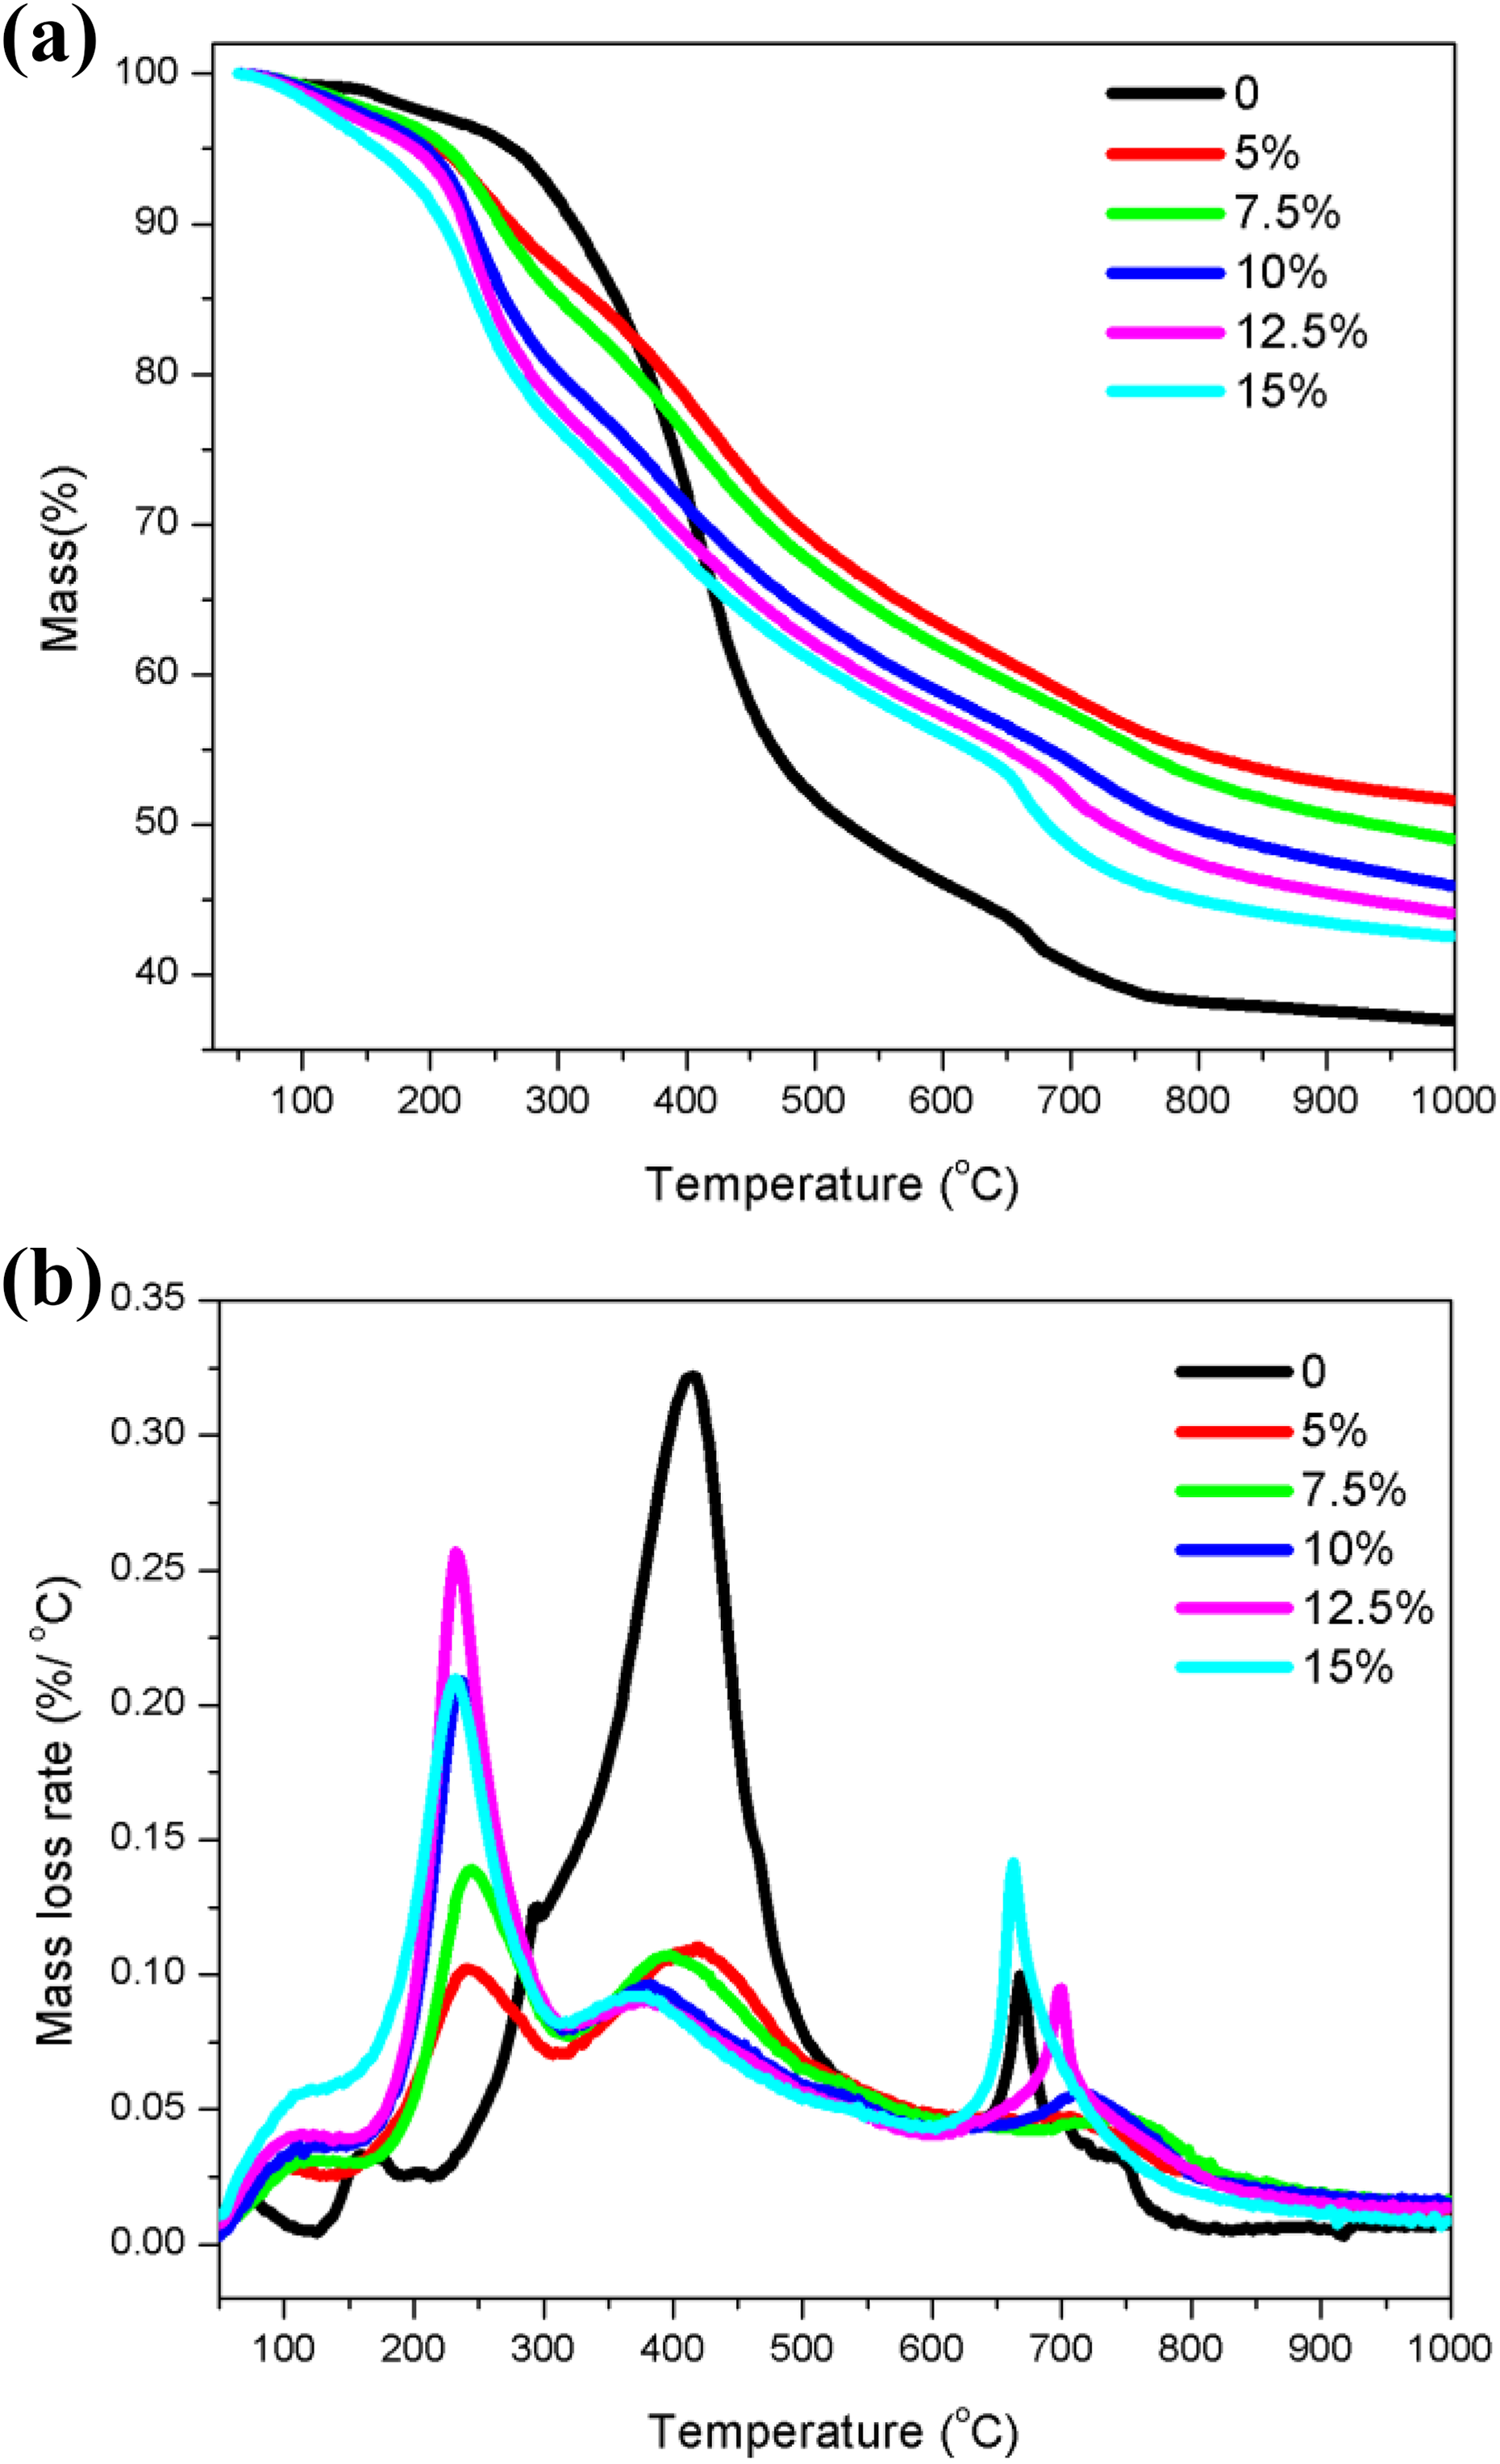
TG (a) and DTG (b) curves of kraft lignin promoted with five different iron loadings. TG: thermogravimetric.
The initial mass loss occurred between 50°C and 160°C was because of the loss of physically adsorbed water. The peak temperatures of FKLPs in the first stage were (Table S1) 102.5°C, 110.5°C, 112.5°C, 115°C, and 120°C for 5%, 7.5%, 10%, 12.5%, and 15% of Fe loadings, respectively. Table S2 shows that the mass losses of FKLPs because of the desorption of absorbed water were 1.48%, 2.69%, 3.10%, 3.63%, and 5.13% for 5%, 7.5%, 10%, 12.5%, and 15% of Fe loadings, respectively, indicating that the mass loss increased with the increasing of iron loading in FKLPs because adsorbed water binding to iron ions increased with the increasing of iron loading in FKLPs.
The second stage of mass loss was observed in the temperature from 160°C to 317°C because of the depolymerization of kraft lignin and decomposition of iron species. All the oxygen-containing groups in the alkyl side chain of lignin basic units were catalytically decomposed. The rapidly decreased mass was because of the breakage of large amounts of ether bonds and C–C bonds connected on the phenyl propane units, simultaneously generating a lot of small-molecule gases and macromolecular condensable volatiles. 19,20 The peak temperatures in the second stage were 240°C, 239°C, 237.5°C, 232.5°C, and 232.5°C for the five iron loadings of 5%, 7.5%, 10%, 12.5%, and 15% in FKLPs, respectively, showing peak temperature decreasing with increasing of iron content in FKLPs. The mass loss of this stage (Table S2) increased with increasing of iron loading from 5% to 12.5% but decreases from 12.5% to 15%. The peak mass loss rates were 0.100%/°C, 0.139%/°C, 0.209%/°C, 0.257%/°C, and 0.210%/°C for the five iron loadings of 5%, 7.5%, 10%, 12.5%, and 15% in FKLPs, respectively.
The most mass loss occurred between 317°C and 588°C corresponding to the decomposition of kraft lignin char from the second stage. The peak temperatures in the third stage (Table S1) decreased with increase of iron content. The mass loss of this stage (Table S2) decreased with the increasing iron loading because more functional groups were left in FKLPs with lower iron content in the second stage. The peak mass loss rates were 0.110, 0.107, 0.096, 0.090, and 0.090%/°C for the five iron loadings of 5, 7.5, 10, 12.5, and 15% in FKLPs, respectively (Table S3).
The last mass loss stage was characterized with a further carbonization and graphitization process of char residues in FKLPs within a wide temperature zone between 588°C and 1000°C. In this zone, the mass loss was mainly because of the decomposition of phenols, ethers, and C–H groups in FKLPs, releasing out CO and H2 as main products. The peak temperatures in this stage decreased with the increase of iron content in FKLPs. The mass losses (Table S2) and loss rates (Table S3) of catalytic carbonization/graphitization of FKLPs increased as iron loading increased from 5% to 15%.
Temperature-programmed decomposition
Figure 2(a) shows the typical trends of hydrogen releasing which increased with an increase of heating temperature during TPD of raw kraft lignin and FKLPs. Observed hydrogen evolution peaks were because of catalytic cracking CH x (x = 1–3) groups in kraft lignin. Raw kraft lignin materials began its H2 releasing at 520°C and reached its maximum releasing value at 726°C. The starting temperature of hydrogen evolution shifted to lower values as iron loading in kraft lignin increased, that is, the observed starting temperature was 450°C, 447°C, 422°C, 417°C, and 410°C for five iron loadings of 5%, 7.5%, 10%, 12.5%, and 15% in FKLPs, respectively. H2 peak temperatures and their peak intensities also decreased with iron loading in FKLPs increased.

Hydrogen (a), methane (b), carbon monoxide (c), carbon dioxide (d), and hydrogen sulfide (e) evolutions for TPD of raw kraft lignin and FKLPs heated to 1000°C at a heating rate of 10°C/min under argon atmosphere. TPD: temperature-programmed decomposition; FKLP: Fe-promoted kraft lignin precursor.
Methane started its release below 500°C (Figure 2(b)) mainly because of the fragmentation of side chains and demethylation of aromatic methoxy groups (–O–CH3) of kraft lignin. 20 The methane formation at the temperature above 500°C was mainly because of the breaking of aromatic ring skeletons. Two methane formation peaks, one relative narrow and sharp peak at 250°C and one wide and strong peak above 400°C, were observed. The methane evolution peak at the low temperature region shifted to a lower temperature compared to that of raw kraft lignin, that is, from 455°C to 240°C. The methane formation area in high temperature regions increased significantly as iron loading decreased because iron promoted the decomposition of kraft lignin. The intensity of the methane evolution peaks decreased with increasing iron loading due to the catalytic activity of iron cracking light hydrocarbons to hydrogen and carbon at high temperature: With increased iron loading, the surface iron atom number increased, and hence more active sites are available for catalytic cracking of hydrocarbon molecules, therefore, light hydrocarbon contents decreased with increasing of iron loading.
Released CO (Figure 2(c)) was mainly because of the cracking of ethers (C–O–C) and carbonyl (C=O) in kraft lignin. Two CO evolution temperature peaks observed for raw kraft lignin were 418°C at the low temperature region which mainly because of the decomposition of carbonyl (C=O) groups, and 770°C centered in the high temperature region which was because of the cracking of ethers (C–O–C). Three observed CO formation peaks for FKLPs were a sharp one centered at 230°C, a wide shoulder one at 640°C, and a strong CO evolution one at 800°C. The formation of CO at 230°C was because of the decarbonylation of the carbon on C3 side chains of kraft lignin which was catalytically decomposed at the low temperature by Fe3+ iron. The CO peak at 640°C was because of the cracking of ethers (C–O–C), while the higher temperature CO peak at 800°C was most likely because of the secondary pyrolysis, that is, the thermal cracking of the char residue of kraft lignin. The intensity of CO peaks increased with the increase of iron loading at the high temperature. This means the more CO was formed when FKLPs had a high iron loading.
The released CO2 (Figure 2(d)) was because of the decomposition of carboxyl (decarbonylation) and ester groups in kraft lignin. There were two CO2 formation peaks, that is, 407°C at the low temperature region which was mainly because of carboxyl (–COO− → CO2), and 642°C at the high temperature region which was because of ester groups. Three CO2 formation peaks were observed for FKLPs, that is, one sharp peak centered at 230°C, one wide strong peak was at 630°C, and one weak flat CO2 evolution peak was at 860°C. The formation of CO2 at 230°C was because of the decarbonylation of carboxyl (–COO−) and COOH groups in kraft lignin which was catalytically decomposed at the low temperature by Fe3+ iron. The CO2 peak at 630°C was because of the cracking of ester groups, while the high temperature CO2 peak at 860°C was because of the secondary pyrolysis. Both CO2 peaks at 630°C and 860°C shifted to lower temperatures with the increase of iron loading. Like CO formation, the intensity of CO2 evolution peaks also increased with an increase of iron loading.
When lignin is depolymerized, sulfur can be presented in many components of gas phases, such as dimethyl sulfide (CH3–S–CH3), carbonyl sulfide (COS), and hydrogen sulfide (H2S). The H2S evolution was monitored during the decomposition of raw kraft lignin and FKLPs (Figure 2(e)). The H2S from raw kraft lignin formed in the temperature range of 210°C to 646°C with a maximum temperature at 341°C. H2S formation profiles for the Fe-lignin samples were significantly different with those of the raw lignin in intensity and temperature range. The H2S evolution peaks shift to low temperature for the Fe-lignin samples, and the peak intensity decreases with increasing iron loading. No H2S was detected for the 10%, 12.5% and 15% samples; sulfur content in kraft lignin of these samples seemed to be absorbed by iron components during the decomposition process, iron sulfide was formed over the surface of iron particles (Fe2+ + H2S → FeS + 2H+).
Iron loading effects on product yields
Table 1 summarizes the solid (dry basis excluding iron), gas, and liquid products’ distributions of TFKLPs, indicating that in general the catalytic performance of the thermal treatment process was enhanced with an increase of iron loading. All these were evidenced by the fact that raw kraft lignin had a solid carbon yield of 36.5%, while FKLPs with 5%, 7.5%, 10%, 12.5%, and 15% iron loadings yielded 35%, 33.1%, 31.3%, 30.5%, and 29.0%, respectively.
Effects of iron loading on weight percentage (wt%) distributions of final products from the catalytic decomposition of raw kraft lignin and FKLPs at the temperature of 1000°C for 1 h.

FKLP: Fe-promoted kraft lignin precursor.
In general, a higher iron loading led to an increase in gas production while the liquid fraction significantly reduced (Table 1). The liquid yield of raw kraft lignin was 23.2%, and adding 5% iron lowered the liquid yield of kraft lignin to 20.2%. The liquid yield of thermally treated kraft lignin can be further reduced through adding more iron and reached its minimum value of 13.8% at the iron loading of 15%. Also, in general, increasing iron loading increased the gas fraction (Table 1).
Iron loading effects on gaseous phase compositions
Table 2 summarizes the compositions of gas species such as CO, H2, CO2, and light hydrocarbons observed during the catalytic thermal treatment of raw kraft lignin and FKLPs with different iron loadings. Gaseous phase composition results indicated that increasing iron loading led to the increase of CO2 and CO contents, while the decrease of the contents of H2, CH4, and other light hydrocarbons. Raw kraft lignin had a higher percentage of H2 in volume (13.1%) than FKLPs, and also hydrogen content decreased with an increase of iron loading. This phenomenon was caused by (1) the reverse water-gas shift reaction (RWGSR) (CO2 (g) + H2 (g) = CO (g) + H2O (g)) and (2) the reduction reaction of iron oxide (FeO + H2 → Fe + H2O). Part of hydrogen from the thermal cracking reaction was consumed through RWGSR since more CO2 was generated from FKLPs and iron was also very active for the RWGSR under the process conditions. Methane made up 23.9% in volume of all gases produced in raw kraft lignin, while the corresponding values for FKCPs with iron loadings of 5%, 7.5%, 10%, 12.5%, and 15% were 21.2%, 20.1%, 17.8%, 15.3%, and 14.5%, respectively. Other light hydrocarbons (C2’s–C4’s) decreased with an increase of iron loading. The increase in catalyst loading increased the number of iron atoms and hence more active sites were available for the catalytic cracking hydrocarbon molecules, therefore, light hydrocarbon contents decreased with the increase of iron loading. The content of CO was 29.7%, 32.9%, 34.5%, 36.8%, 38.4%, and 39.7% for kraft lignin with iron loadings of 0%, 5%, 7.5%, 10%, 12.5%, and 15%, respectively. Like the formation of CO during the decomposition of FKLPs, CO2 formation decreased with the increase of iron loading (Table 2).
Gas compositions observed during the decomposition of raw kraft lignin and FKLPs.

FKLP: Fe-promoted kraft lignin precursor.
Solid products characterization
Elemental analyses
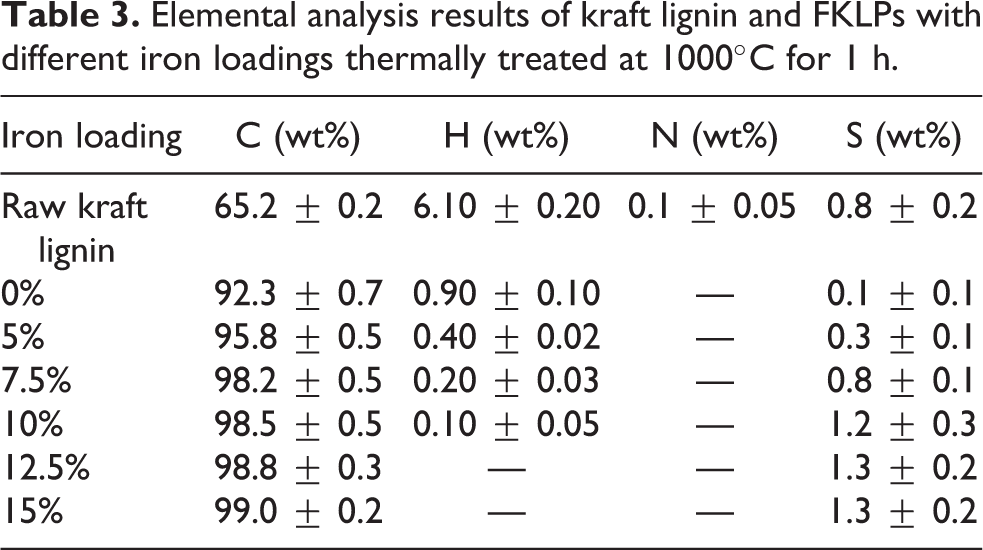
Table 3 summarizes the results of C–H–N–S elemental analyses performed for raw kraft lignin and TFKLPs. The weight contents of C, H, N, and S in raw kraft lignin were 65.2%, 6.1%, 0.1%, and 0.8%, respectively. Carbon content in TFKLPs increased with the increase of iron loading. Chars produced from raw kraft lignin had the lowest carbon weight percentage of 92.3%, while chars from TFKLPs with a 15% of iron loading contained the highest carbon weight percentage of 99.0%. Hydrogen weight percentages decreased with the increase of iron loading as shown in Table 3, and no hydrogen was detected in both TFKLPs with 12.5% and 15% of iron loadings. No nitrogen was detected in all tests. Sulfur contents were 0.1%, 0.3%, 0.8%, 1.2%, 1.3%, and 1.3% for kraft lignin materials with iron loadings of 0%, 5%, 7.5%, 10%, 12.5%, and 15%, respectively.
Elemental analysis results of kraft lignin and FKLPs with different iron loadings thermally treated at 1000°C for 1 h.
BET surface area
Table S4 indicates that Brunauer–Emmett–Teller theory (BET) surface areas were 11.3, 78.3, 97.8, and 108 m2/g for kraft lignin materials with iron loadings of 0%, 5%, and 7.5%, respectively, indicating that surface areas increased with the increase of iron loading from 0% to 10%, and 100.2 and 85.6 m2/g for 12.5% and 15% of iron loadings, respectively, indicating that BET surface areas decreased as iron loading increased from 10% to 15%. In TFKLPs, active metal iron played a direct role in the formation of physical structures of solid residues. Therefore, the change in metal loading might result in the formation of a maximum surface area of the solid residues. This could be explained by two different roles of iron on the sample structures: (1) iron played a catalytic role in the decomposition and carbonization of lignin structure, therefore lignin conversion increased with an increase of iron loading, and (2) at higher iron loadings, more lignin structure decomposing caused the decrease of sorption capacity of micropores and the significant increase of mesopore surface, therefore the surface areas of solid residues further reduced because the graphitization degree increased with the increase of iron loading. On the other hand, excessive iron would agglomerate and sinter to larger particles.
X-ray diffraction
The XRD profiles of TFKLPs of five iron loadings indicated that in general TFKLPs with different iron loadings had different crystalline structures. Specifically, TFKLPs with 5% and 7.5% of iron loadings had the body-centered cubic iron (α-Fe) and the face-centered cubic iron (γ-Fe) formed. TFKLPs with 10% of iron loading mainly consisted of cementite (Fe3C), austenite (γ-Fe), and ferrite (α-Fe). As iron loading increased to 12.5% and 15%, the solid residues of TFKLPs had the stronger cementite diffraction peaks and weaker austenite and ferrite peaks.
The selected diffraction patterns (2θ = 41–48°) were fitted using Jade 2010 software. The relative fraction of α-Fe, γ-Fe, and Fe3C was defined as the area ratio of fitted peak of each iron phase to the total fitted area. Table S5 and Figure S1 show the calculated results of relative fraction values of α-Fe, γ-Fe, and Fe3C. The relative fractions of α-Fe and Fe3C all decreased with the increase of iron loading. The relative fraction of γ-Fe increased from 62% to 70% when the iron loading increased from 5% to 7.5%, and then decreased to 35% when increased to 15%. The change of relative fraction of α-Fe, γ-Fe, and Fe3C indicated interconversion of iron phases at different iron loadings. As the Fe loading increased from 5% to 7.5%, α-Fe converted to γ-Fe. As the Fe loading increased from7.5% to 15%, both α-Fe and γ-Fe converted to Fe3C.
The mean particle sizes of α-Fe, γ-Fe, and Fe3C were determined from fitted peaks through applying Scherrer equations. Table S5 and Figure S2 summarize the calculated particle sizes of α-Fe, γ-Fe, and Fe3C. The mean size of α-Fe nanoparticles increased from 9.6 to 22.7 nm with the increase of iron loading from 5% to 15%. The mean size of γ-Fe nanoparticles increased from 16.7 to 18.2 nm with the increase of iron loading from 5% to 7.5%, and then decreased to 9.8 nm when iron loading increased to 10%. The mean size of γ-Fe nanoparticles increased from 9.8 to 15.2 nm as the iron loading further increased to 15%.
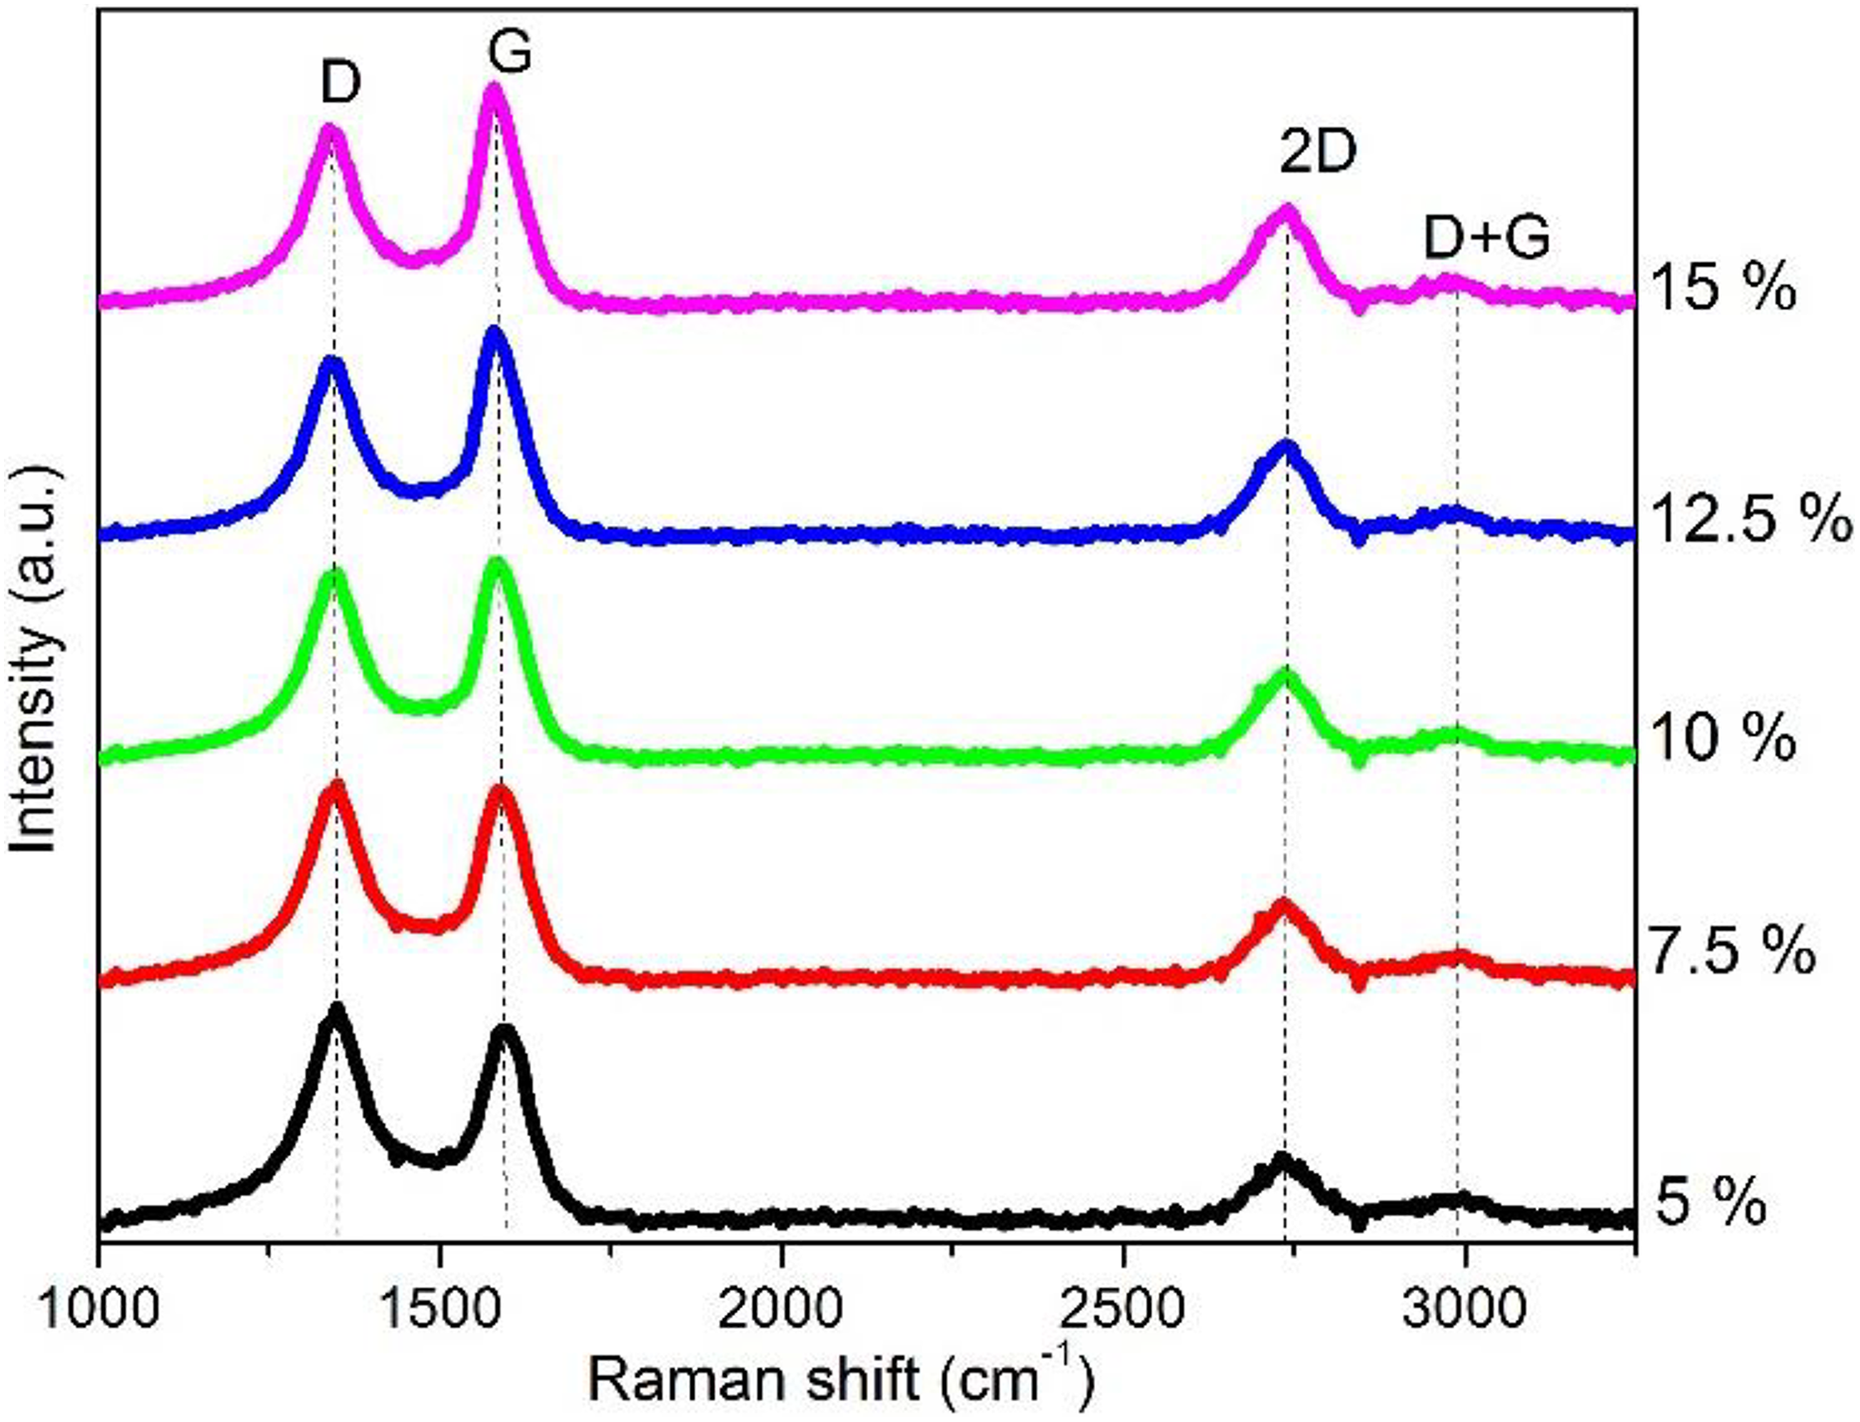
Raman
Raman spectra of TFKLPs (Figure 5) exhibited two strong peaks at the D- and G-bands, respectively. The D-band was the Raman band at a shift of 1368 cm−1, and while the G-band was the Raman band at a shift of 1600 cm−1 which was because of the stretching vibration mode of graphite C=C bonds. The summary of the fitting results of Raman spectra of the samples with different iron loading (Table S6) indicates that the values of I D/I G of TFKLPs decreased from 1.57 to 1.17 as the iron loading increased from 5% to 15%, that is, an increase in the uniformity of carbonaceous structure as the degree of graphite increased with iron loading, but the loading of iron as the catalyst had no effect on the positions of both D- and G-band peaks in Raman spectra. The La value was estimated from the Cançado equation. The values of I D/I G decreased with an increase of iron content after thermal treatment, an increase in the uniformity of carbonaceous structure, that is, as the degree of graphite increased with iron loading. From Table S6, it can also be found that the crystalline size of graphite increased with increasing of iron loading.
Morphology
Figures 4(a1) to (a3) are SEM images of TFKLPs with 5% of iron loading, indicating that formed macroporous carbon frame materials maintained their large pore volumes and had their pore sizes varying from 0.1 μm to 5 μm and wall thickness ranging from 0.05 to 0.5 μm. There were two types of nanoparticles observed on macropore surfaces: (1) majority nanoparticles had their diameters less than 10 nm and embedded in bulk carbon as well as on the surface of carbon frame walls (Figure 3). The carbon frame wall between pores was filled of uniform shape nanoparticles sized 3–8 nm in diameter (Figure 3). There were also some micro pores formed over the wall (Figure 3). (2) There were also some larger nanoparticles with quasi-spherical shapes distributed over the frame wall surface (Figure 3). These nanoparticles had their diameters ranging from 20 to 100 nm.

Raman spectra of TFKLPs with five different iron loadings. TFKLP: thermally treated Fe-promoted kraft lignin precursor.
SEM images of TFKLPs with five iron loadings of 5% (a), 7.5% (b), 10% (c), 12.5% (d), and 15% (e). SEM: scanning electron microscopy; TFKLP: thermally treated Fe-promoted kraft lignin precursor.
Figures 4(b1) to (b3) are SEM images of TFKLPs with 7.5% of iron loading, also showing macroporous carbon frame maintaining large pore volumes with their pore sizes varying from 0.1 to 1.5 μm and wall thickness ranging from 0.05 to 0.5 μm. There were more large-size nanoparticles (Figure 5(b2)) and micro pores observed over pore walls (Figure 5(b3)) of TFKLPs with 7.5% of iron loading if compared with ones with 5% of iron loading. The TFKLPs of 10% iron loading had more and larger (0.1 to 10 μm) macropores in formed carbon frames (Figures 4(c1) to (c3)) compared to the two TFKLPs with lower iron loadings. The 12.5% iron loading TFKLPs formed 3-D porous structures with interconnected channels (Figures 4(d1) to (d3)) and had even more and larger (1 to 10 μm) macropores in carbon frames compared to TFKLPs with iron loading less than 12.5%. The formed channels were composed of nanoparticles and mesopores/micro-pores (Figure 5(d1)). There were large-size nanoparticles distributed over the pore wall surface (Figure 5(d2)). The 15% iron loading TFKLPs had porous carbon materials formed with interconnected channels (0.1 to 5 μm) that maintain large pore volumes (Figure 5(e1)). The thickness of the carbon frame wall ranged from 0.05 to 0.5 μm (Figure 5(e1)). Nanoparticles with quasi-spherical shapes were observed over pore surfaces (Figure 5(e2)), and these nanoparticles had their diameters ranging from 20 to 100 nm.
High-resolution transmission electron microscopy
High-resolution transmission electron microscopy (HRTEM) images of 5% iron loading TFKLPs show that nanoparticles homogenously embedded in amorphous carbon framework (Figure S3(a)) were the spherical shape and dark cores enclosed by light shells, and these core-shell structures sized 5–10 nm in diameter (Figure S3(b)). Figure S3(c) indicates that cores were γ-Fe phase of (111) crystallographic planes with an averaged d-spacing value of 0.208 nm and shells were 2–5 layers of graphene structure. Figure S3(d) indicates cores were γ-Fe phase of (200) planes with an averaged d-spacing value of 0.1805 nm and were shelled with 6 layers of graphene structure. These HRTEM images indicate that core-shell structured nanoparticles had γ-Fe as the core and ordered planes of layered graphene as the shell, and these nanoparticles were named as MGEINs. The formation of γ-Fe phase observed in 5% iron loading TFKLPs through HRTEM also agrees with XRD results. In addition, onion-like graphitic carbon nanostructures without iron cores were also observed in 5% iron loading TFKLPs (Figure S3(b) to (c)).
The HRTEM images of 7.5% iron loading TFKLPs show the nanoparticles homogenously embedded in amorphous carbon framework were also the spherical shape and dark cores enclosed by light shells (Figure S4(a)), and these nanoparticles were 5-15 nm in diameter (Figure S4(a) to (b)). Most of these MGEINs had iron cores (5–10 nm in diameter) of (111) and (200) planes of γ-Fe phase shelled with 3–5 layers of graphene structure (Figure S4(c) to (d)). The formation of γ-Fe phase observed in 7.5% iron loading TFKLPs through HRTEM also agrees with XRD results.
The morphologies of 10, 12.5 and 15% iron loading TFKLPs (Figure S5 to S7) were significantly different from ones observed in 5 and 7.5% iron loading ones in terms particle sizes and iron phases. Two different sizes of MGEINs were observed in TFKLPs with iron loading greater than 7.5%, that is, one size ranged from 5 to 10 nm in diameter and the other size was from 30 to 50 nm. Three (031), (112) and (210) planes of Fe3C phase were found in 10, 12.5and 15% iron loading TFKLPs, which also agrees with the XRD results.
In situ formation of iron nanoparticles embedded in carbon frames
Formation of lignin char frames
Lignin is a complex natural polymer with its cross-linked phenolic macromolecules being no order in the molecules, and its phenolic units are completely randomly arranged. Therefore, lignin is an amorphous polymer. 31 Kraft lignin will be first softening at 124–174°C. 32,33 when heat-treated, but will be not melt if further heating rather than starts its decomposition process, 34 that is, its side chains become unstable and begin to release gases and volatiles and form char. 35 In this experiment, the raw kraft lignin softened at approximately 190°C; with the increase of the temperature, kraft lignin decomposed and charred in a wide temperature zone of 200–650°C. TGA (Figure 1) and TPD (Figure 2) results indicated that showed FKLPs decomposed and charred in a narrow temperature region of 160–317°C. Significant gaseous products (Table 1) released during the decomposing and charring process of kraft lignin, that is, gases were bubbling in the soften lignin, and pores and channels were generated while the char frame was formed. At elevated temperatures, the char frame continuously underwent the carbonization to carbon structure.
In situ formation of MGEINs in carbon frames
When the char frame was growing, iron nitrate was simultaneously decomposed to iron oxide nanoparticles and trapped in the char. At elevated temperatures, the lignin char was catalytically carbonized and released gaseous products carbon monoxide, methane, carbon dioxide, and hydrogen (Figure 2). These reducing agents diffused in the carbonaceous matrix and reacted with iron oxide nanoparticles distributed in the char at around 360–420°C based on TGA results (Figure 1). Therefore, metallic iron particles would be formed during the thermal treatment process; transition metals like iron and nickel are excellent catalysts for cleaving carbon–carbon and carbon–hydrogen bonds. 20 Iron nanoparticles act as a catalyst to accelerate carbonization/graphitization of the carbon frame, producing a lot of volatiles (Figure 2). Meanwhile, under the heating treatment temperature, the disorder carbons around iron particles tended to diffuse and dissolve into iron. A saturated carbon solubility in iron nanoparticles reached under the thermal treatment temperature after a certain period of time. When the temperature decreased, the iron particles saturated with the disordered carbon supersaturated with carbon. Subsequently, carbon re-precipitated in the form of graphite crystals to the free enthalpy difference between the two forms of carbon, that is, graphite is the highly ordered carbon with the lowest Gibbs free energy while the disordered carbons having a higher activity. Carbon atoms deposited and rearranged on the surface of iron nanoparticles and formed MGEINs. Two type of GEINs formed from the catalytically thermally treated kraft lignin, that is, the nanoparticles embedded in the carbon wall with a narrow range of particle size being less than 10 nm in diameter and a wide range of particle size from 10 to 100 nm. Most of these MGEINs had their iron core diameters of 3–8 nm and carbon shells were composed of 3–5 layers of graphene structure (SEM and HRTEM results). This type of nanoparticles formed from the disorder carbon in char through the dissolution-precipitation process. The number of graphene layers was limited by the maximum concentration of carbon in iron at the heating treatment temperature.
There were also some nanoparticles with spherical shape and dark cores enclosed by 10–50 layers of concentric graphene shells (HRTEM results). This type of nanoparticles formed from carbonaceous gases (CO and CH4) through a catalytic vapor decomposition (CVD) process. These nanoparticles distributed on cell wall surface with their diameters ranging from 10 to 100 nm (SEM and HRTEM results). Thermal decomposition of lignin generated carbonaceous gases, that is, CH4, aromatics and CO, at a wide range of temperature from 300 to 1000 ºC, as shown in TPD-MS spectra (Figure 2). Many iron nanoparticles distributed on wall surface, while carbonaceous gases can re-deposit through CVD process to form graphene materials over iron particle surface
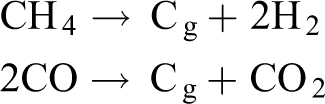
SEM images (Figure 5) show that the number of large nanoparticles on wall increases with the increase of iron loading. This may be contributed by (1) part of iron particles sintered with the increase of iron loading; (2) more naked iron particles formed because of more lignin char catalytically converted with the increase of iron loading (Table 1). Moreover, cementite (Fe3C) phase formation was observed with the increase of iron loading (Figure 4). The formation of Fe3C is usually associated with the carbon precipitation from the gas phase. 36 Fe3C has been produced from the reduction and carburization of iron oxides using different gas mixture as the following reactions:


XRD patterns of TFKLPs with different iron loadings of (a) 5%, (b) 7.5%, (c) 10%, (d) 12.5%, and (e) 15%. XRD: X-ray diffraction; TFKLP: thermally treated Fe-promoted kraft lignin precursor.
Gaseous phase products increased with the increase of iron loading, and more lignin char was gasified with a higher iron loading, then more naked iron particles exposed to reaction atmosphere. Therefore, more Fe3C produced in the higher iron content TFKLPs (Table S5 and Figure S1). Once carbon deposition occurred at the reacting surface, Fe3C formation was terminated. For the similar heating temperature and heating time, the sizes of Fe3C in different TFKLPs were very similar, that is, all were around 20–23.8 nm (Table S5 and Figure S1).
Conclusions
MGEINs embedded in carbon frames were prepared by catalytic graphitization of kraft lignin at temperature of 1000°C. The effect of iron loading on the formation of carbon frames embedding with MGEINs was investigated using TGA and TPD experiments. The TG and DTG curves demonstrated the peak temperatures related to lignin decomposition and carbonization shifted to lower temperature with the increase of iron loading. The iron loading had a significant effect on the yields of the different thermal decomposition products. The experimental results showed that the catalytic performance increased with an increase of iron loading. A higher iron loading led to an increase in the gas production while the liquid fraction significantly reduced. By increasing the iron loading, the gas fraction increased from 40.3% for the noncatalytic experiment to 56.9% of the 15% iron loading. A lignin mixture with iron produced a gas with a relative concentration of CO2 and CO as well as hydrogen and light hydrocarbons.
Experimental results also indicated that both the graphitization degree and lignin conversion levels were found to be increased with the increase in iron loading. The carbon frames were generated through a catalytic thermal treatment process including the steps of lignin softening, decomposing, charring, and carbonization. Two types of MGEINs were in situ embedded in carbon frames from the catalytic thermal decomposition of kraft lignin, that is, the nanoparticles embedded in the wall had a narrow range of small particle size being less than 10 nm in diameters and the nanoparticles over the wall surface had a wide range of large size particles ranging from 10 to 100 nm. The smaller nanoparticles formed from the disorder carbon in char through the dissolution-precipitation process. The formation of larger size particles was related to the re-deposition of carbonaceous gases through CVD process to form graphene materials over naked iron particle surface.
Supplemental material
supplementary_material-2018-05-26... - In situ formation of graphene-encapsulated iron nanoparticles in carbon frames through catalytic graphitization of kraft lignin
supplementary_material-2018-05-26... for In situ formation of graphene-encapsulated iron nanoparticles in carbon frames through catalytic graphitization of kraft lignin by Qiangu Yan, Jinghao Li, Xuefeng Zhang, Jilei Zhang, and Zhiyong Cai in Nanomaterials and Nanotechnology
Footnotes
Acknowledgments
The authors would like to acknowledge Domtar Corp., North Carolina for providing kraft lignin for this study. The assistance of Ms. Amanda Lawrence of the Institute for Imaging & Analytical Technologies (I2AT) at Mississippi State University is gratefully acknowledged.
Declaration of conflicting interests
The author(s) declared no potential conflicts of interest with respect to the research, authorship, and/or publication of this article.
Funding
The author(s) disclosed receipt of the following financial support for the research, authorship, and/or publication of this article: This work was supported by the USDA Forest Service through Grant No. 16-JV-11111124-075.
Supplemental material
Supplemental material for this article is available online.
References
Supplementary Material
Please find the following supplemental material available below.
For Open Access articles published under a Creative Commons License, all supplemental material carries the same license as the article it is associated with.
For non-Open Access articles published, all supplemental material carries a non-exclusive license, and permission requests for re-use of supplemental material or any part of supplemental material shall be sent directly to the copyright owner as specified in the copyright notice associated with the article.