
Abstract
In general, shear thickening fluids show a marked increase in viscosity beyond a critical shear rate, which can be attributed to the hydrodynamic clustering effects, where in any external energy acting on a shear thickening fluid is dissipated quickly. However, there is a lack of theoretical modeling to predict the viscosity curve of shear thickening fluids, which changes continuously with the increasing shear rate. In this article, a phenomenological continuous viscosity modeling for a class of shear thickening fluids is proposed. The modeling predicts shear thickening and thinning behaviors that are naturally exhibited by shear thickening fluids for high and high enough values of the shear rate. The result shows that the phenomenological modeling provides a very good fit for several independent experimental data sets. Therefore, the proposed modeling can be used in numerical simulations and theoretical analysis across different engineering fields.
Keywords
Introduction
Nanomaterials having dimensions of roughly 1–100 nm can display different physical and chemical properties from those of their bulk counterparts. 1 Generally, nanomaterials can be divided into four categories: nanopowders, nanofibers, nanofilms, and nanoblocks. Among them, nanopowders have been widely used in the synthesis of new composite materials. 2 –4 Shear thickening fluids (STFs) are highly concentrated colloidal suspensions consisting of monodisperse nanoparticles suspended in a carry fluid and have the capacity to display both flowable and rigid behaviors, when subjected to sudden stimuli. 5 In other words, the rheological properties (e.g. shear modulus and viscosity) of an STF can be changed with stimuli. It is widely recognized that this change results from the formation of jamming clusters, which are bound together by hydrodynamic lubrication forces, and are often termed as hydroclusters. 6,7 More importantly, a range of parameters, such as the particle size distribution, particle shape, volume fraction, particle–particle interaction, and suspending phase viscosity, 8 significantly depend on the rheological behavior of STFs.
A typical STF includes three characteristic regions in general: a shear-thinning region at a low shear rate, followed by a sharp increase in viscosity over a critical shear rate and a subsequent shear-thinning region at a high shear rate. Based on the advantages of the second region, STFs primarily have industrial applications in compositing of different materials, such as fabrics, 9 –11 foam, 12,13 fiber-reinforced polymer, 14,15 and ceramic polymer, 16 for improvement of their damping performance and impact resistance. However, a very rare study has reported the application of the STF in vibration control fields, such as civil engineering, aerospace engineering, and automotive engineering. One possible reason is that the STF exhibits the behavior of shear thinning when the shear rate is relatively low. The behavior of shear thinning may reduce the structural safety of engineering structures under external loadings. Another reason is the absence of a theoretical model that is used to predict continuously the viscosity behavior of STF with the external load.
In this study, the research background is that the STFs are used as a medium in some devices, such as dampers and isolators, to resist seismic responses of civil structures and control undesirable vibrations in automobile and aerospace engineering and so on. The aim of this study is to present a theoretical model of STFs with only shear thickening and thinning behaviors in a significantly high range of the shear rate (as seen in Figure 1) that can be directly used in the above control engineering fields. Based on the experimental data presented in the literature, 17 –20 a continuous model for describing the viscosity of STFs is proposed, and parameters are determined by employing a nonlinear least-squares optimization method. Different from the physical-based models, this new modeling method only relies on the input–output experimental data of the STFs, which is completely phenomenological. The developed model can produce similar behaviors but without necessarily providing physical insight into the modeling problem. Finally, comparison with independent experimental data indicates that the model presented accurately describes the continuous viscosity of the class of STF materials and is suitable for application in vibration control fields.

Schematics of STF. STF: shear thickening fluid.
Overview of the available viscosity modeling
The viscosity modeling most often used to fit the viscosity data of shear thickening materials is the power-law modeling. 21 –23 Viscosity can be described according to this modeling as follows

where η is the viscosity, K is a material dependent constant,
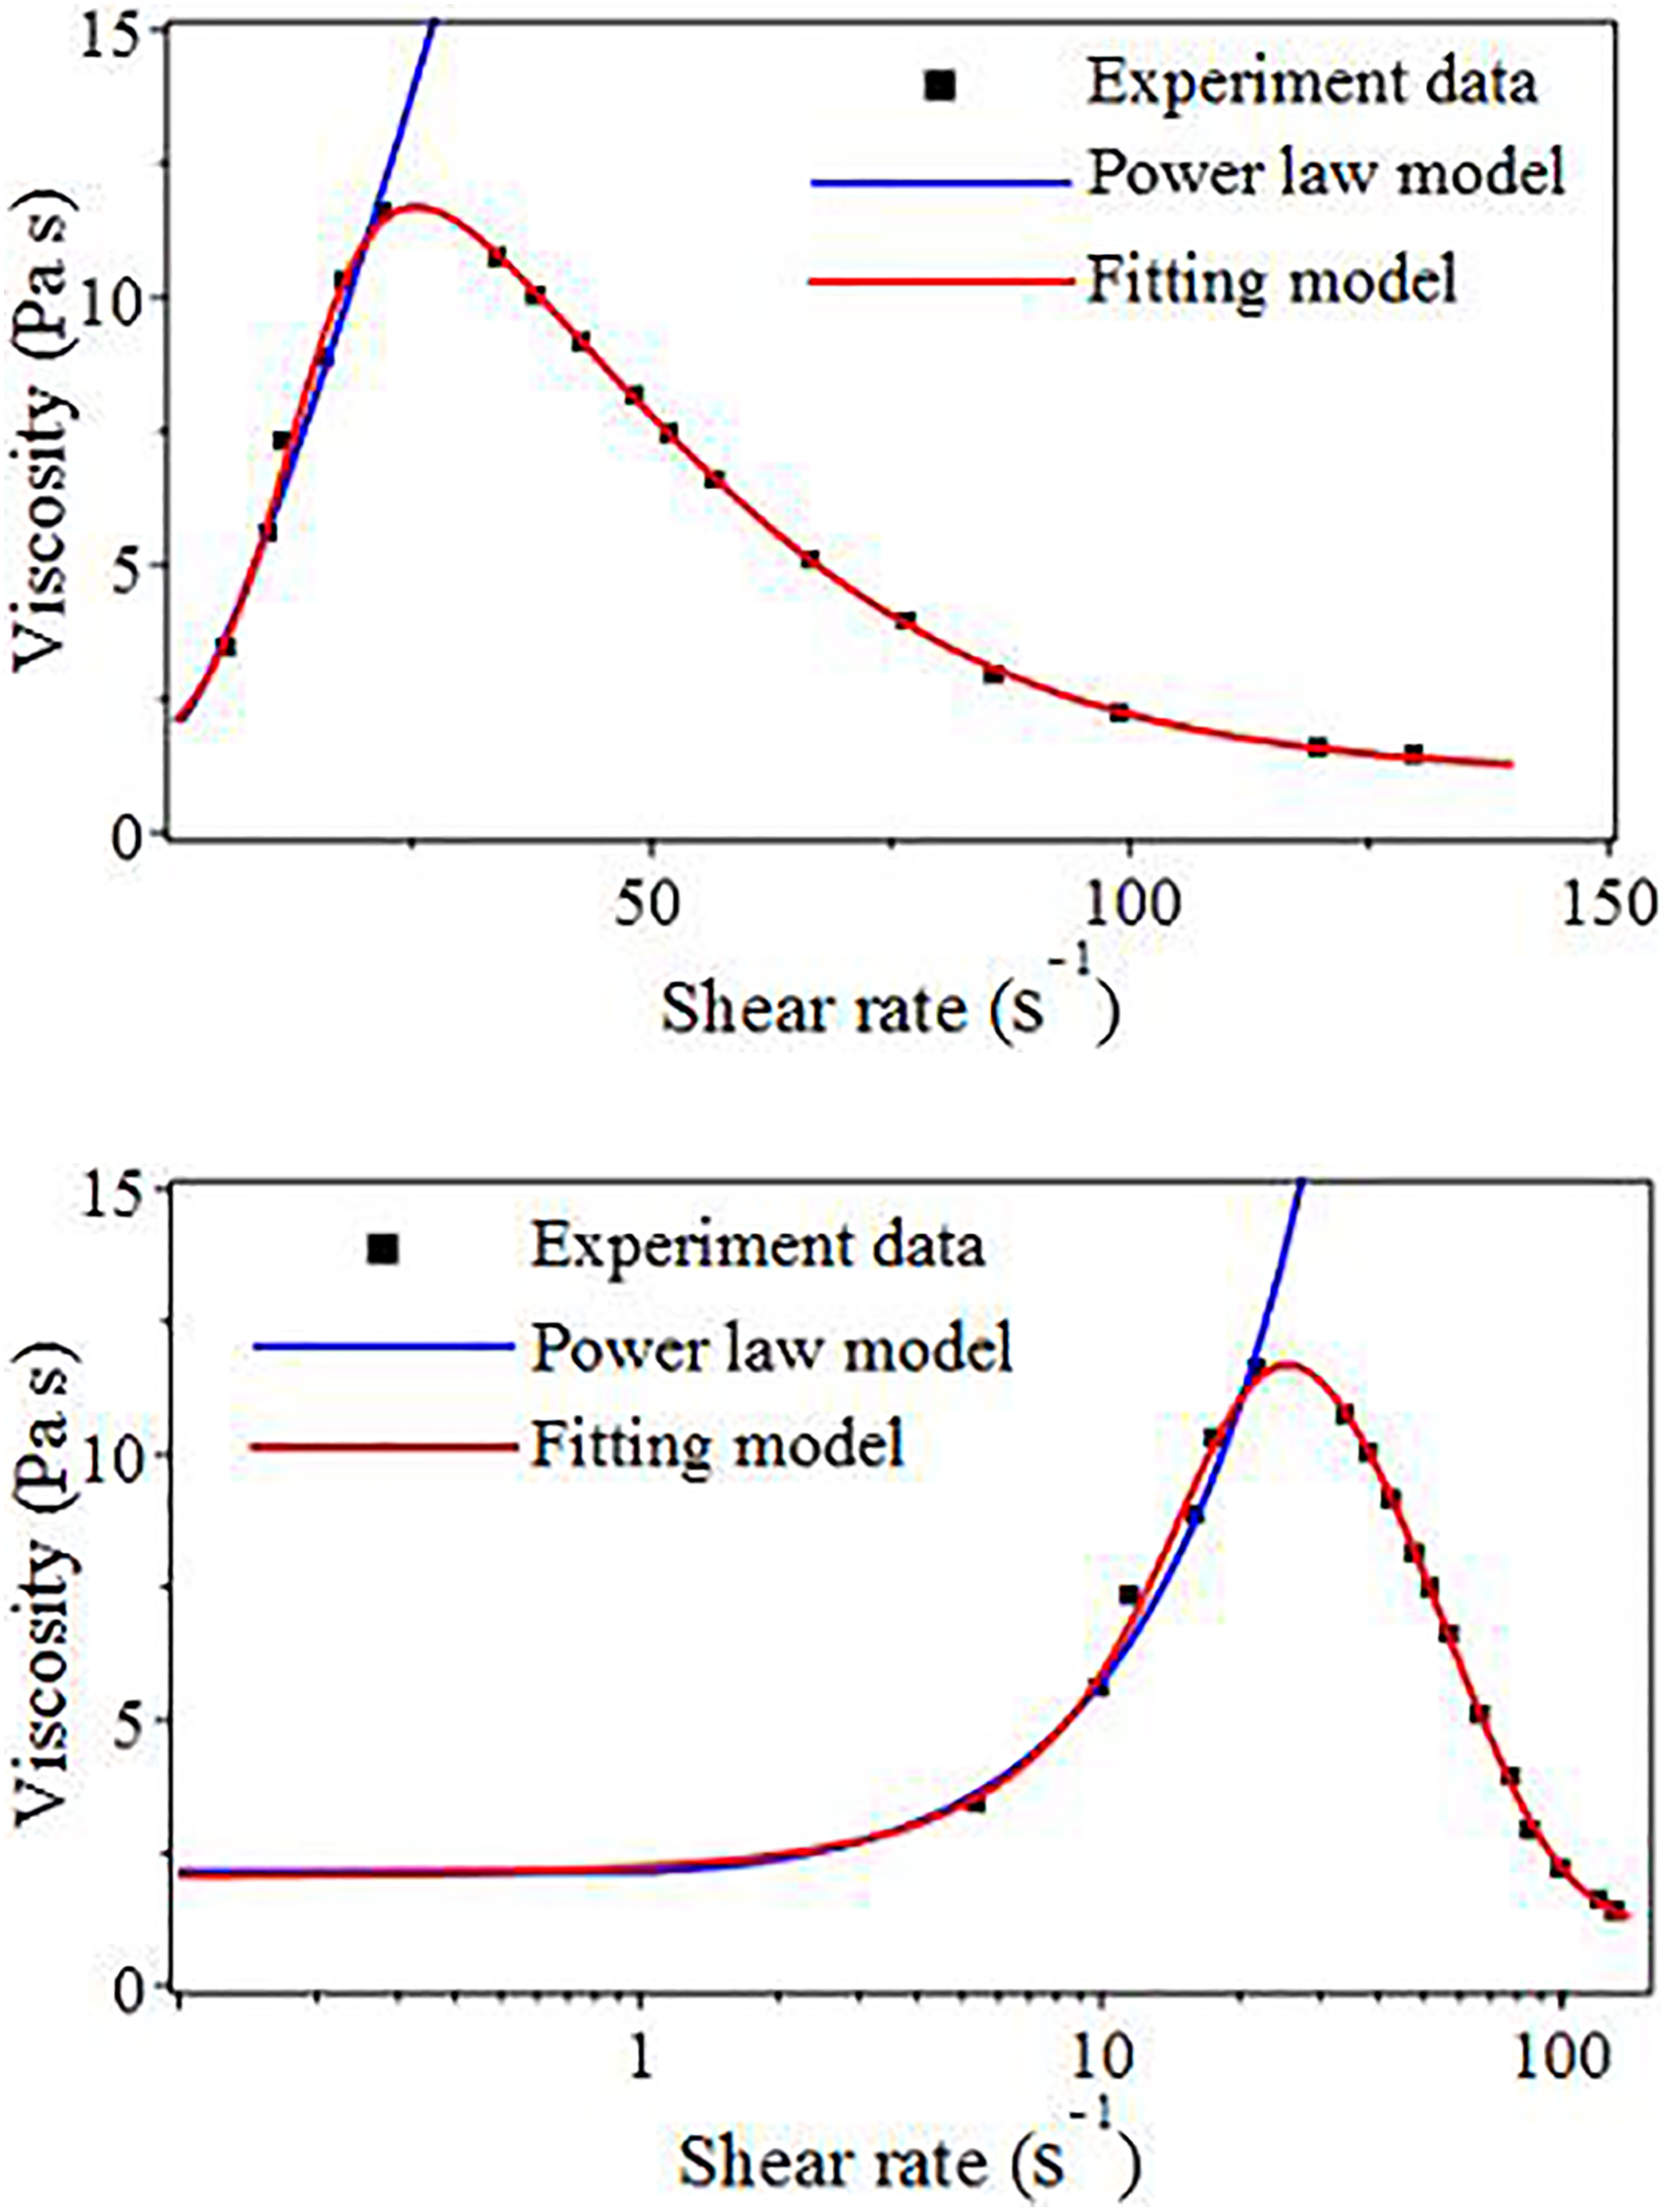
Equation (1) implies an infinite viscosity in the limit of zero shear rates. Such behavior is not compatible with the continuity equations of the fluid since these equations govern complex flows. 24 Moreover, as seen in Figure 2, the prediction of infinite viscosity yields rather poor curve fittings to data pertaining to STF shear thinning behavior. An alternative, when the shear thinning range is not of interest, is to discard the curve data. However, doing so may render the STFs used in engineering unsafe.

Comparison between predicted and experimentally obtained viscosity curve for the power-law function.
Another alternative with a more suitable qualitative STF behavior was proposed by Galindo-Rosales et al. 25 The equations for STF viscosity are given by
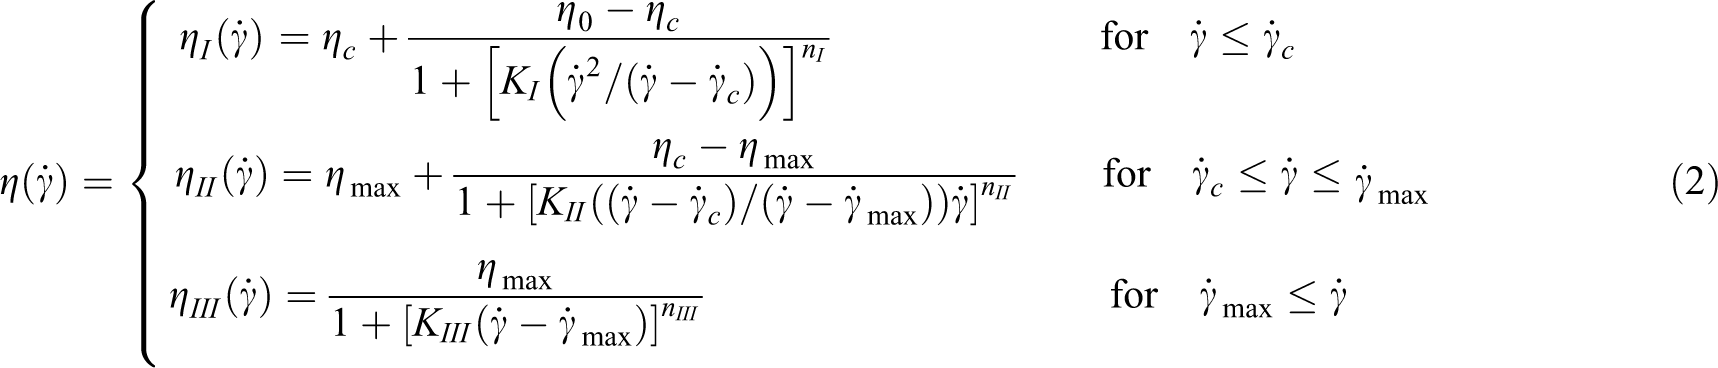
This viscosity modeling involves three different expressions applicable to three different ranges of shear rate, respectively. Thus, the proposed modeling represents these three characteristic regions of the typical STF viscosity curves. However, as can be seen from equation (2), there are 11 independent parameters, 4 of which must be obtained from the experimental data prior to the iterative fitting procedure. 25 This makes the parameter identification of the modeling more difficult. On the other hand, the proposed modeling is not particularly suited for numerical simulations because of its piecewise definition, even though it has a continuous derivative and can be used in numerical simulations in principle. The inconveniences with the piecewise ranges of the modeling are that they are delimited by the STF shear rate, which depends strongly on the variation in the external excitation. 26 Thus, a computer program must be developed in order to determine the relationship between the shear rate and any external excitation.
Proposed modeling and validation
In this section, a model for predicting the viscosity of STFs based on the phenomenological theory is proposed in this context

in which η 0 denotes the initial viscosity; η max denotes the max viscosity; and k 1, k 2, w 1, and w 2 are the adjusting parameters of the curve.
The parameters for the continuous modeling in equation (3) are chosen to be η 0 = 3.461, η max = 11.609, k 1 = 0.277, k 2 = 0.068, w 1 = −4.037, and w 2 = −2.846, which fit the viscosity curve of the proposed modeling to the STF used by Yeh et al. 27 In the experiments described in the references, the STF solvent used is a polar liquid, which was prepared using hydrophobic fumed silica nanoparticles (R972) with a size of 12 nm and a specific surface area of approximately 200 m2/g. The matrix fluid is polypropylene glycol (H[OCH(CH3)CH2] n OH), which has a molecular weight of 1000 g/mol. The predicted curve is then compared with the corresponding experimental data, as shown in Figure 3. It is evident that the proposed STF modeling predicts the viscosity behavior accurately across all regions. Its characteristics include the shear thickening behavior at high shear rates and the shear-thinning behavior at high enough shear rates.
Comparison between predicted and experimentally obtained viscosity curve for the proposed function (the suspensions of hydrophobic fumed SiO2 nanoparticles R972 in PPG and the mass of SiO2 is 10%). 27 (Parameters of fitting model: η 0 = 3.461, η max = 11.609, k 1 = 0.277, k 2 = 0.068, w 1 = −4.037, and w 2 = −2.846; parameters of power-law model: η 0 = 2.143, K = 0.25, b = −1, n = 2.21). SiO2: silica; PPG: polypropylene glycol.
To better understand the advantage of this present model, the power-law model for simulating this STF viscosity is also shown in Figure 3. As seen in Figure 3, although the power-law model can simulate the initial value well, the critical shear rate and the peak value of the STF’s viscosity, data are diversified when the shear rate is higher. Therefore, the characteristic behavior in the shear-thinning range cannot be predicted. Although this range is meaningless if the STF is used in the composted materials field, such as impregnating fabric and fiber-reinforced polymer, the research background in this study is that the STFs are used as a medium in dampers or isolators to control vibrations in some engineering fields as mentioned in the “Introduction” section. In these devices, the STFs are put inside a closed space and cannot be thrown out. Thus, the STFs may exert a certain residual viscosity due to the closed space constraint even if it is decreased in this range. On the other hand, this range is also post yield. According to previous studies on the electro-rheological fluid (ERF) 28 and magneto-rheological fluid (MRF), 29 –31 this post yield can be further used in the vibration control field. Therefore, in order to better comprehend the dynamic behavior of the engineering vibration control, the curve data should be stayed when STF is used in vibration control engineering fields.
In order to extend the applicability of the proposed modeling to a more general formalism, in every fitting procedure, we introduce a nonlinear least-squares algorithm, which is used to identify the parameter values that match the simulated behavior of equation (3) as closely as possible to the experimental data, within the least-squares error. Therefore, the proposed modeling fitting problem can be recast as a nonlinear optimization problem as follows

where N is the number of experimental data, i is the experimental value of viscosity at the ith data, and ηi is the simulated value.
The governing equation can be approximated using the finite difference method, which can convert the nonlinear modeling fitting problem described above to a conventional constrained optimization problem. Considering the fitting results of Figure 3 as an example, the correlation coefficient R 2 can be estimated as 0.997, which validates the proposed modeling.
Fitting capability of the proposed modeling
Figures 4 to 8 show the fitting capability of equation (3) to the viscosity data of STFs used in the industry. Here, the main purpose is to demonstrate the general fitting capability of equation (3) to the STF data, rather than discussing the measurement technique or rheological behavior of the materials. All data presented in this article are obtained from the references.

Phenomenological function simulating the continuous viscosity of the STF (the suspensions of SiO2 in EG and its mass is 34%). 18 (η 0 = 4.702, η max = 44.093, k 1 = 0.180, k 2 = −0.019, w 1 = −5.261, and w 2 = −0.325). STF: shear thickening fluid; SiO2: silica; EG: ethylene glycol.

Phenomenological function simulating the continuous viscosity of the STF (the suspensions of SiO2 in EG and its mass is 38%). 18 (η 0 = 40.525, η max = 1395.51, k 1 = −0.147, k 2 = −1.822, w 1 = 4.476, and w 2 = 9.345). STF: shear thickening fluid; SiO2: silica; EG: ethylene glycol.

Phenomenological function simulating the continuous viscosity of the STF (the suspensions of Sigma-Aldrich S5505 in EG and the mass of SiO2 is 30%). 17 (η 0 = 0.4625, η max = 25.4245, k 1 = 0.0145, k 2 = 0.0028, w 1 = −5.9835, and w 2 = −6.3759). STF: shear thickening fluid; SiO2: silica; EG: ethylene glycol.

Phenomenological function simulating the continuous viscosity of the STF (solution of α,ω-Mg carboxylate polyisoprene (M n = 21,000 g/mol) in decahydronaphthalene at 25°C). 32 (η 0 = 447.353, η max = 1780.01, k 1 = 1.256, k 2 = 0.197, w 1 = −3.755, and w 2 = −2.178). STF: shear thickening fluid.

Phenomenological function simulating the continuous viscosity of the STF (poly(methyl methacrylate) volume fraction suspensions: 50% and 55%). 19 (For the 50%, η 0 = 1.501, η max = 12.994, k 1 = −0.010, k 2 = −0.148, w 1 = 2.566, and w 2 = 2.856; for the 55%, η 0 = 3.294, η max = 27.879, k 1 = −0.0187, k 2 = −0.3266, w 1 = 2.472, and w 2 = 3.082). STF: shear thickening fluid.
From Figures 4 to 8, we can observe that the fittings are generally of good quality, because the qualitative behavior of equation (3), throughout the whole range of the shear rate, is essentially the same as that of the data. Therefore, discarding data pertaining to the shear-thinning range is not necessary. Moreover, it is an important component of the data, and the evaluation of the entire viscosity curve cannot be solely dependent on the engineering safety aspects when the STFs are used independently in different engineering fields. In addition to the graphical evidence of the reasonability of approximation by the proposed modeling, the fitting procedure does not require repeated initialization of the values of these parameters to the nearest target values using the experimental data, and carrying out such initialization once is sufficient.
Conclusions
This article proposes a continuous modeling for describing the viscosity of STF materials. The modeling is purely phenomenological and is based on fitting of the experimental data and hence can be applied to broad engineering fields. The modeling is continuous and has continuous derivatives; therefore, it is convenient for numerical simulations and curve-fitting procedures. Its qualitative behavior is similar to the one shown in the class STFs of interest, that is, a low viscosity plateau at low shear rates, followed by a sharp increase of the viscosity level, and then a sharp region of drop.
Footnotes
Acknowledgments
The authors are extremely grateful to the anonymous reviewers for their valuable comments and suggestions for improving the quality of the present study.
Declaration of conflicting interests
The author(s) declared no potential conflicts of interest with respect to the research, authorship, and/or publication of this article.
Funding
The author(s) disclosed receipt of the following financial support for the research, authorship, and/or publication of this article: This work was financially supported by the National Natural Science Foundation of China (grant nos. 51578347, 51608335, 51678375), Natural Science Foundation of Liaoning Province (grant no. 2015020578), and basic scientific research projects of Liaoning Colleges and Universities (grant no. LJZ2017045).