
Abstract
The mechanical blending of polypropylene and low-density polyethylene is an economical and simple method for producing new polymeric materials for specific applications. However, the reduction in mechanical properties of the blend is one of its main shortcomings. In this study, a filler masterbatch including nano-silicon dioxide, compatibilizer, lubricant agent, and antioxidant agent was prepared, and polypropylene–low-density polyethylene composite parts with different content of filler masterbatch were fabricated and tested for mechanical properties at two tensile test speeds. Also, to investigate the underlying mechanism of the mechanical properties improvement, the tested samples were carefully analyzed and compared and further characterized by scanning electron microscopy and differential scanning calorimetry. The results indicate that the mechanical properties, including tensile strength, moduli, and elongation, can be all drastically improved simultaneously with the addition of the filler masterbatch. The results also suggest that the compatibility of the two phases increases with the increase in the filler masterbatch, and the crystal size decreases and distribution uniforms owing to the addition of the filler masterbatch. Furthermore, it was also found that there is a close relationship between the mechanical properties and morphological structures, which are improved by the existence of the filler masterbatch.
Introduction
Polypropylene (PP) and low-density polyethylene (LDPE) are both widely used polyolefin polymers owing to their advantages such as low density, high stiffness, high softening temperature, and good chemical inertness. More important, in addition, is the cheapness and ease with which they can be processed. The mechanical blending of PP and LDPE, if they result in a combination of the mechanical performance of both components, may prove to be a more economical and easier method for producing new polymeric materials for specific applications. 1 –3 In the past decade, high volume commodity PP and LDPE have been blended in hopes of combining the mechanical performance of both components. 4 –8 Furthermore, with their more similar chemical structures, the possibility of recycling plastic waste—mainly constituted by polyolefins 9,10 —and avoiding the complex and expensive processes of separation of the different components have been investigated. Generally, blending PP and PE yields properties in between those of the original homopolymers. However, the main shortcoming of the blends is the drastic reduction in toughness and elongation at break. 4,5 Hence, for the successful application of PP–LDPE blends, improvement in toughness and elongation at break is important.
It is generally believed that the compatibility is an important influencing factor on the mechanical properties of polymer blends. For PP and LDPE, it has also been proven that they are incompatible in the melt, and the blend exists as a two-phase mixture. 11 Therefore, adding compatibilizers is often viewed as a conventional method to improve the poor interfacial bond strength between both phases of polymer blends. 12 There have been many elastomers proven to be effective for PP–LDPE blends, for example, styrene-butadiene-styrene, 13 ethylene-propylene-diene rubber, 14 ethylene-propylene-ethylidene norborene copolymer (EPCAR-847), 15 PE-g-poly(2-methyl-1,3-butadiene), 9 and so on. In addition, one can introduce micro or nanoparticles—such as talc, 16 carbon nanotube, 17 nanoclay, 18 nano-silicon dioxide (nanoSiO2), 19 nanoTiO2, 20 SiO2/TiO2, 21 and cellulose nanofibers 22 —into the blended material to enhance the mechanical properties of a component fabricated by polymer or polymer blends. However, it was often reported that tensile strength, elastic modulus, and stress at break of the blends with a compatibilizer or nanofiller decreased while impact strength and elongation increased and vice versa. This motivated us to explore other methods of improving the mechanical performances including the strength and elongation simultaneously of PP–LDPE blends.
Considering the role of nanofillers and compatibilizers in the enhancement of mechanical performances of polymers, it is expected that the appropriate addition of nanofillers and compatibilizers into a PP–LDPE blend system may have a synergistic effect and further improve its strength and elongation. In this study, a method of introducing both nanoparticles and compatibilizers into PP–LDPE blends, which could produce counterparts with improved strength and elongation simultaneously, was introduced, and the influences of compatibilizer and filler content on the structure–property relationship were carefully compared. A better understanding of the properties-enhancing mechanism was gained from the results and from comparisons with common blended parts.
Experimental work
Materials
The PP (Huajin T30 S) and LDPE (Maoming 951-000) used in this study were commercial products made in China. Their melt flow indexes were about 3.2 g/10 min (190°C, 21.6 N) and 2.17 g/10 min (230°C, 21.6 N), respectively. Ethylene-vinyl acetate copolymer (EVA) was used for the carrier of the masterbatch. The content of vinyl acetate was about 28.0 wt%. PP-graft-maleicanhydride (PP-g-MA) with a graft ratio of 8.0 wt% was used for the compatibilizer. It was supplied by Sigma-Aldrich Co., Ltd, St. Louis, USA, and its melt flow index was about 5 g/10 min (190°C, 21.6 N). Polyethylene wax (H1001) and hindered phenolic (B225/1010) were used as a lubricant and antioxidant agent, respectively. The nanoSiO2 with average radius of 5 nm was used for a nucleating agent. All the materials were strictly selected after a series of experiment and comparison, and the screening procedure was omitted.
Sample preparation
Sample preparation could be mainly classified into two stages, filler masterbatch (FM) preparing and sample processing. The FM preparing stage was realized in three steps. First, all the materials were dried and weighted. Second, the components of the FM, including EVA, PP-g-MA, nanoSiO2, H1001, and B225/1010, were blended using a high-speed mixer, and the weight ratio of EVA, PP-g-MA, nanoSiO2, H1001, and B225/1010 was kept as 60:18:20:1:1 for brevity. Finally, the mixed materials were melted and extruded through a Φ3-mm filament die by a two-screw extruder (SHJ-30, Nanjing Keya Machinery Co., Ltd, China). The extruded material was cooled down once exited from the die and then pelletized using a QLJ-300 pelletizer. Some key processing parameters of the FM fabrication are listed in Table 1.
Processing parameters of the FM fabrication.

FM: filler masterbatch.
Once the FM was prepared, PP, LDPE, and the pelletized FM can be mixed for the next sample fabrication. For brevity, the weight ratio of PP–LDPE was fixed on 3:1. As to the FM, its content varied across a range of 5–15 wt%, depending on the process used. As a result, the nanoSiO2 content in the PP–LDPE–FM composite was 1.0–3.0 wt%. Using the conventional sample without the FM for comparison, there were four FM sample formulations by weight: 0%, 5.0%, 10.0%, and 15.0%, and the nanoSiO2 contents were 0%, 1.0%, 2.0%, and 3.0%, respectively. The four kinds of sample were named as PLN0, PLN1, PLN2, and PLN3, respectively. The detailed content of the four samples are listed in Table 2. The sample was then fabricated using the different PP–LDPE–FM composites in a conventional injection molding (CIM) machine (HTF-80, Ningbo Haitai Co., Ltd, China). For comparison, PP–LPDE–EVA, PP–LDPE–PP-g-MA, and PP–LDPE–nanoSiO2 samples were also prepared by a direct procedure of mixing. For being close to PLN3, the ratios of their composition were fixed as 67.82:22.61:9.57, 72.69:24.23:3.08, and 72.44:24.15:3.41, respectively.
Materials used for processing samples of PP–LDPE composites.

PP: polypropylene; LDPE: low-density polyethylene; EVA: ethylene-vinyl acetate copolymer; PP-g-MA: PP-graft-maleicanhydride.
It should be noted that the dispersity of the nanoSiO2 in the stage of FM preparation is a very important influence factor to determine mechanical properties of the composites. The distribution of nanoSiO2 in PLN3 and PP–LDPE–nanoSiO2 samples were first investigated by the following scanning electron microscope (SEM) observation, and the results are shown in Figure 1(a) and (b), respectively. It is easily found that the nanoSiO2 can be distributed in the PP–LPDE matrix more uniformly in the PLN3 sample compared to the PP–LDPE–nanoSiO2 sample. Therefore, the EVA used in this study not only helps to increase the compatibility of PP and LDPE owing to its structure but also is a good carrier. It also actually functions as a dispersion agent.

Comparison of the distribution of the nanoSiO2 in PLN3 (a) and PP/LDPE/nanoSiO2 (b) using SEM observation. nanoSiO2: nano-silicon dioxide; PP: polypropylene; LDPE: low-density polyethylene; SEM: scanning electron microscope.
The conventional procedure of injection molding is well known. First, the raw material is heated to its melting temperature. By high pressure, the melted polymer is injected into the cavity via a delivery system and a gate. When filling is nearly completed, the cavity is maintained at a constant pressure for the packing stage. Packing pressure is used to fill the remaining volume of the cavity and to compensate for shrinkage in the cooling stage, the shrinkage results in the decrease of the dimensions as the cavity cools down. After the interior of cavity has become stable, the product is ejected from the mold. It is also well known that defects of the products, such as warpage, shrinkage, sink marks, and so on, are caused by many factors during the production process. These defects influence the quality and accuracy of the products. Therefore, it is of critical importance to effectively control the factors of influence during the molding procedure. The processing parameters during the injection molding mainly include melt temperature, mold temperature, injection pressure, injection time (rate), packing pressure, packing time, and cooling time. After many tests, the optimal processing parameters were obtained as follows: injection machine melt temperature of 200°C, mold temperature of 50°C, injection pressure of 60 MPa, injection time of 1 s, packing pressure of 70 MPa, packing time of 5 s, and cooling time of 20 s. As such, it was still difficult to avoid the shrinkage of the molded samples owing to the high crystallinity of the raw materials (PP and LDPE). A standard tensile test bar mold was used to mold the parts, and its temperature was controlled by circulating oil from a thermal controller. The volume of the cavity was about 9.582 × 103 mm3, and a detailed description of the molded sample is shown in Figure 2. According to the volume of the cavity, a shrinkage rate of volume could be calculated for all the molded samples. It was found that the shrinkage rate of volume has a slight increase with the increases in the FM. The shrinkage rate of volume for PLN0 sample is about 3.78% and that of PLN3 is about 4.02%. It was possibly owing to the variation in the crystallization with the addition of the FM.

A detailed description of the preparation of the molded sample.
Sample test
The molded tensile bars were tested on a screw-driven universal testing instrument (MTS, Sintech 10/GL, MTS Systems Corporation, Eden Prairie, USA) per ASTM D638-03 at a room temperature of 25°C. Two crosshead speeds, 10 and 500 mm/min, were used to study the stress and strain behavior. At each test speed, seven tensile bars were tested for each material, and five values were selected and analyzed excluding the biggest and the smallest values. The mean and range of the modulus of elasticity (Young’s modulus), ultimate tensile strength, and strain at break for each group sample were calculated. In this study, the tensile strength was nominal, and it was obtained by dividing the load by the original cross-sectional area.
The morphologies of the selected molded specimens were first examined using an SEM (JEOL JSM-6480) with an accelerating voltage of 20 kV. The SEM specimens were taken from the cross-section at the middle of the molded tensile bar (shown in Figure 2) which was fractured in liquid nitrogen. The surfaces of the fractured specimens were sputter coated with gold prior for a period of 50 s to observation using a Cressington 108Auto sputter coater (Cressington Scientific Instruments Ltd, UK). To better characterize the morphological distribution in the molded samples, the fractured surfaces were chemically etched and then also observed using a field emission SEM (JEOL JSM-7100F) with an accelerating voltage of 10 kV. Etching was used to remove the noncrystals material and get to know the distribution of crystals. The etchant used was a solution of potassium permanganate in a mixture of 10:4:1 by volume of concentrated sulfuric acid, phosphoric acid, and distilled water (1 g of potassium permanganate in 100 ml of mixture). The etching lasted for 6 h at a temperature of 60°C, and it partially revealed the surface topography. After that, the etched surfaces were washed, dried, and covered with a thin layer of gold.
A Perkin–Elmer DSC-8000 (Waltham, USA) apparatus was used to analyze the thermal properties of the selected samples with a series of procedures. The temperature was calibrated with indium. All differential scanning calorimetry (DSC) sample weights were strictly limited in the range of 4.9–5.1 mg in order to avoid the possible influence of the sample size. Samples were loaded to the DSC at 25°C, and liquid nitrogen was used as the cooling fluid. The samples were heated to 240°C and kept at this temperature for 3 min to eliminate any residual crystals and prior thermomechanical history. Then, they were cooled to 60°C and kept for 3 min. Finally, the samples were reheated to 240°C. For brevity, all of the heating/cooling rates were fixed at 10°C/min.
Results and discussion
Mechanical properties
Tensile tests were performed on the injection molded specimens of PP–LDPE nanocomposites. Properties such as the strength, modulus, and strain at break were measured. PP–LPDE–EVA, PP–LDPE–PP-g-MA, PP–LDPE–nanoSiO2, and PLN0 samples mentioned before were first investigated by the tensile test. The results of the tensile strength and the strain at break at the tensile speed of 10 mm/min were shown in Figure 3. It can be seen from Figure 3 that the tensile strength and the strain at break are almost equivalent to the PP–LDPE–PP-g-MA, PP–LDPE–nanoSiO2, and PLN0 samples, which suggests that the effect of the separate PP-g-MA and nanoSiO2 on the mechanical properties of PP–LDPE blends is less significant. As to the PP–LDPE–EVA sample, which has a relatively low tensile strength and high strain-at-break compared to that of the PLN0 sample, it indicates that the elongation increases and the strength decreased with the addition of EVA. It is possibly attribute to the low strength of EVA and the enhancing compatibility of PP and LDPE owing to the existence of EVA. It can be concluded from these results that one single composition of EVA, PP-g-MA, and nanoSiO2 has less influence on the mechanical properties of PP–LDPE blends.

A comparison of tensile strength and strain-at-break of the molded PP/LDPE sample with different composition (tensile rate of 10 mm/min). PP: polypropylene; LDPE: low-density polyethylene.
However, the EVA, PP-g-MA, and nanoSiO2 have a synergistic effect on the improvement in the mechanical properties of PP–LDPE blends. Figure 4 shows an illustrative comparison of the tested samples at the tensile speed of 10 mm/min. For the neat PP–LDPE blended parts—those with an FM content of 0 wt%—yielding and then necking were observed to occur. However, the necking only lasted a short distance and then the part ruptured (Figure 4(b)). For the filled parts, the necking spread and measured several hundred percent strain. As the FM content increases, the necking can spread more smoothly. When the FM content was 15.0 wt% (PLN3, Figure 4(e)), the necking can spread throughout all the gauge length. As a result, a 650% elongation can be found and the sample is not actually ruptured (exceeds the limits of the experimental apparatus). This deformation behavior is similar to typical semicrystalline polymers capable of undergoing chain orientation. An interesting phenomenon can also be observed from Figure 4 in that a lot of threadlets (small thread- or hair-like protrusions) formed on the surface of the samples with 15.0-wt% FM content. The more ductility the sample had, the rougher the surface was, and the more threadlets were found. It is possibly attribute to a small portion of surface material separate from the kernel and break in advance owing to the heat release in the last stage of the tensile test.

Pictures of the molded sample with different amounts of FM before and after the tensile test. (a) Untested sample. (b) to (e) Tested samples. The scale bar is 100 mm. (f) and (g) The magnification of the picture (b) and (d). FM: filler masterbatch.
Figure 5 shows the representative engineering stress–strain curve of the four samples at a test speed of 10 mm/min. From Figure 5, one can clearly see that the PLN3 sample exhibits the more ductile fracture characteristics than the PLN2, PLN1, and PLN0. Especially, apart from regions including the elastic region, yield point, stress drop region, cold drawing, and fracture point can be observed in all these curves, the strain hardening region is easily found after 450% strain of the PLN3 sample. Furthermore, the tensile strengths and moduli are also found to be increased with increasing the FM content. The results are in agreement with the results shown in Figure 4, and it can be attributed to the presence of the FM.

Representative tensile stress versus strain of the molded sample with different amounts of FM (tensile rate of 10 mm/min). FM: filler masterbatch.
For further comparison, the results of tensile strength, strain at break, and moduli of the samples with different amounts of FM are shown in Figure 6. The properties reported here are the actual readings measured for the specimens without taking into account the variation in the sectional dimension and slight elongation after rupture. It can be seen from the figure that the tensile strengths, strain at break, and Young’s moduli of the samples with filled FM are all higher than the unfilled ones. Therefore, it can be concluded that the filled samples had better mechanical properties than the unfilled ones. Furthermore, with an increase in FM content, the tensile strengths, strain at break, and Young’s moduli of the filled samples all obviously increased. The best result of the mechanical properties occurred when the FM content was 15.0 wt% and showed approximately 25.2-MPa tensile strength, 650% strain-at-break, and 1270-MPa Young’s modulus.

The (a) tensile strength, (b) strain-at-break, and (c) Young’s modulus of the molded sample with different amounts of FM (tensile rate of 10 mm/min). FM: filler masterbatch.
It must be noted that the tensile test could not stop immediately when the samples were partially fractured owing to a small portion of material still keeping unbroken at the low-speed tensile test (10 mm/min). As a result, the tested value of the strain-at-break may be influenced by the delay. Hence, in order to examine the energy required to perform tensile testing until rupture more exactly, a tensile speed as high as 500 mm/min, which is the upper limit of the testing equipment, was also used to determine the stress–strain behavior of the different molded samples. As can be seen from Figure 7, four representative stress–strain plots were selected for comparison among samples with different amounts of FM. For the filled and unfilled parts, no matter what the FM content was, yielding was first observed at approximately 10% strain. Necking took place next. It should be noted that high-speed tensile tests have a different effect on samples when compared to low-speed tests. In a high-speed test, the necking doesn’t have enough time to spread and cold drawing is difficult, so cracks propagate rapidly. Hence, the high-speed tensile test is a good way to measure the energy required to perform tensile testing until rupture of a part. As a result, it can be concluded that the longer the necking lasts, the better the ductility is. Thus, from Figure 7, it can be seen that the filled parts had better ductility than the unfilled ones and that the parts with 15.0-wt% FM performed the best.

Representative tensile stress versus strain of the molded sample with different amounts of FM (tensile rate of 500 mm/min). FM: filler masterbatch.
For convenient comparison, the following integral expression of the stress–strain curve was used to describe the energy required to perform tensile testing until rupture quantitatively

where τ is the apparent tensile stress, ∊ is the corresponding tensile strain, and ∊ b is the strain at break. As a result, the integral value is symbolized as E, and the units are kilojoule/cubic meter. This result is similar to the tensile impact strength except that the speed of the tensile test used in this study was still lower than that of the standard tensile impact test as specified in the ASTM-D1822. Hence, the data were simply used here as a direct comparison among all foamed samples. In general, the higher the integral result is, the more ductile the tested sample is. According to equation (1), the result of the four stress–strain curves is listed in Table 3. As shown in Table 3, the highest value calculated was 1182.71 KJ/m3, corresponding to the most ductile sample with a filler content of 15.0 wt%.
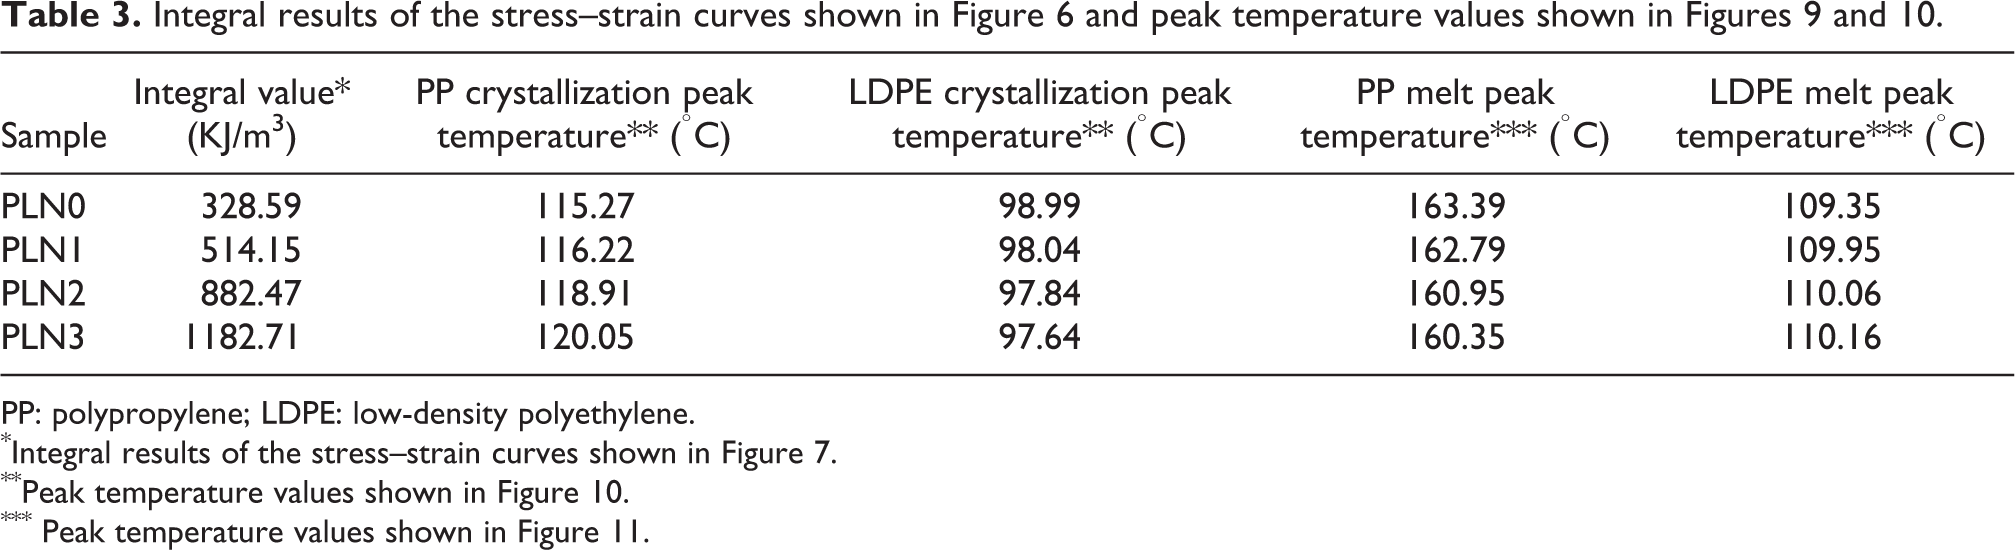
PP: polypropylene; LDPE: low-density polyethylene.
*Integral results of the stress–strain curves shown in Figure 7.
**Peak temperature values shown in Figure 10.
*** Peak temperature values shown in Figure 11.
A conclusion can be drawn from the above experimental results and discussion. For the PP–LDPE 3:1 composites, the presence of the FM presented in this study can help to drastically improve the mechanical properties, which include strengths, strain at break, and moduli, simultaneously. Furthermore, the mechanical properties increase with increasing the FM content within limits. This demonstrates the reinforcement effect of the filler on the PP–LDPE composites.
However, it must be noted that the FM, which is mainly comprised of EVA and PP-g-MA, has actually relatively small tensile strength and modulus compared to the neat PP–LDPE material. Hence, the dramatically increased mechanical performance for the FM-filled samples remains a mystery. For getting to be known it, the FM content was further increased, and it was found that further increasing the FM content could lead to the deterioration in tensile performance. For example, when the FM content is 20 wt%, it was omitted for brevity, the tensile strength and modulus of the sample will apparently show a low value compared to that of the PLN2 sample, and almost the strain at break of both is roughly the same. As a result, it is necessary to clarify the mechanism of properties enhancing more completely.
Relationship of morphology, structure, and mechanical properties
The SEM is one of the most popular ways to identify microstructural characteristics of the molded samples. SEM images provide information on the microstructure, including the phase morphology distribution and the fracture characteristics of the specimens. Figure 8 shows representative SEM images of the fractured surfaces of the molded PP–LDPE composites with different amounts of the FM. As can be seen in Figure 8, the increased miscibility of the PP and LDPE materials could be gradually observed with an increase in the amount of the FM. In Figure 8(a), the immiscibility can be clearly observable. With an increase in the FM content, the phase dispersion became gradually confused, as shown in Figure 8(b) and (c). This suggests that the LDPE and PP were relatively miscible with the addition of the FM. In Figure 8(d), the FM content was 15.0 wt%, and the phase dispersion was difficult to determine. It can be concluded from the figure that the presence of the FM has a great effect on the compatibility of the PP–LDPE composites, which greatly influences the micromorphological structure and mechanical performance.

SEM images of the molded sample. The FM content by weight was (a) 0%, (b) 5.0%, (c) 10.0%, and (d) 15.0%, respectively. SEM: scanning electron microscope; FM: filler masterbatch.
To better characterize the morphology structures of the samples, the same slices analyzed by the previous SEM were chemically etched according to the procedure described in “Sample test” section and then also observed using SEM. The resulting surface topography images are shown in Figure 9.

SEM images of the etched sample. The FM content by weight was (a) 0%, (b) 5.0%, (c) 10.0%, and (d) 15.0%, respectively. SEM: scanning electron microscope; FM: filler masterbatch.
The crystals dimension and distribution of the molded samples with different FM content can be clearly observable from Figure 9. In Figure 9(a), for the neat PP–LDPE binary blends, the crystals have an average radius of about 30 μm, and the distribution of crystals is not uniformed relatively. With the addition of the FM, the crystals size decreases obviously as shown in Figure 9(b) and (c). The crystals shown in Figure 9(d) have an average radius of about 20 μm, and further, almost all the crystals have the same size, which suggests a uniformed distribution of the crystals. This result was not unexpected and could be attributed to the nucleating effect of the nanoSiO2. Up to now, it is well known that nucleating agents of polymers can fasten the crystallization and diminish the sizes of crystals. Hence, the added nanoSiO2 could be concluded to have contributed to improved crystallization behaviors and mechanical properties of the PP–LDPE composites.
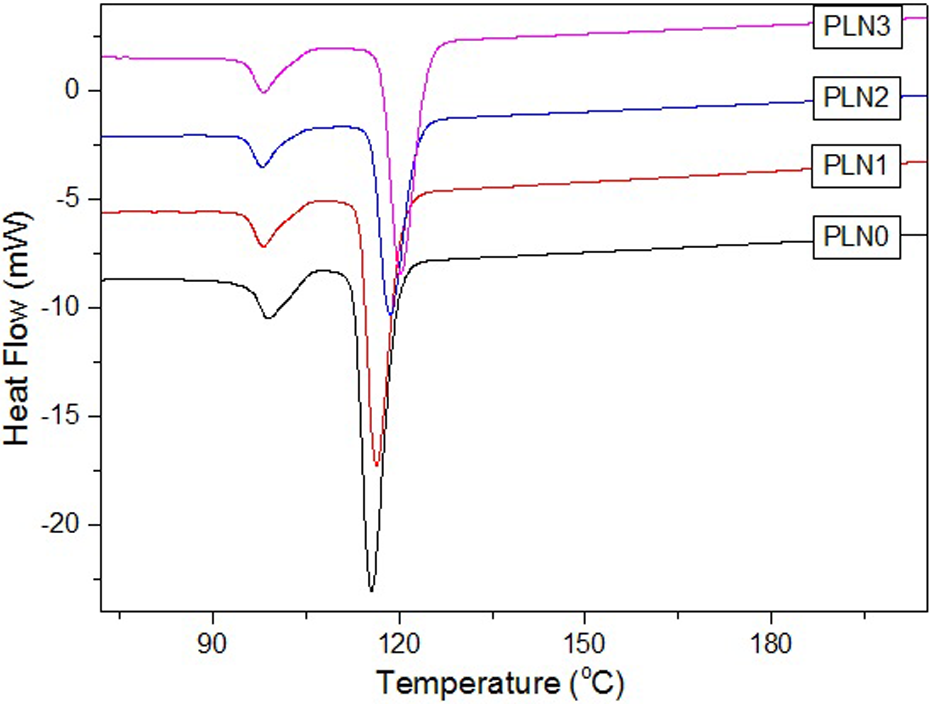
The different compatibilities and crystallization at different compositions of PP–LDPE composites can be further characterized and verified by DSC testing, the results of which are shown in Figures 10 and 11. As shown in Figures 10 and 11, although two distinct crystallization and melting peaks can be seen in the curves of all of the composites—thus indicating that the two phases of PP and LDPE are strongly immiscible—the remelted peak (Figure 11) of PP was shifted to the peaks of LDPE (Table 3) when the amount of the FM was relatively high. According to Teh et al.’s review, 23 a simple and fast method to ascertain compatibility is to run a DSC test on the blend to find out whether there is any shift in melting points and/or change in enthalpy of fusion. Therefore, a conclusion can be concluded that the LDPE and PP were relatively miscible with the presence of the FM. It is in agreement with the trend of the increased mechanical properties appeared with the increases in the FM content. Furthermore, the crystallized peak (Figure 10) of PP was shifted to high temperature with the addition of the FM, which indicated that the crystallization fastened owing to the nucleating effect of the nanoSiO2. It can be concluded from the agreement between the DSC and the SEM results that the mechanical properties improvement can be attributed to the improvement of the compatibilities and crystallization of PP–LDPE composites, which is deeply influenced by the presence of the FM.
DSC curves of cooling after heating of the molded samples with different amounts of FM. DSC: differential scanning calorimetry; FM: filler masterbatch.

DSC curves of second heating of the molded samples with different amounts of FM. FM: filler masterbatch.
Conclusions
In this study, the compatibility and crystallization, which influenced by the compatibilizers and nanofiller, of PP–LDPE composites parts molded by CIM were investigated. It was found that the fabricated FM, which included nanoSiO2, compatibilizer, lubricant agent, and antioxidant agent, has the potential to improve the mechanical properties of PP–LDPE composites. In particular, tensile strength, strain at break, and modulus can be enhanced simultaneously once the dosage of the FM is selected optimally. The mechanism explaining the significant improvement in mechanical properties of PP–LDPE composites parts by CIM has been investigated, and it is proposed that the fundamental cause was the improvement in the compatibility and the crystallization structures, which was determined by the addition of the FM. Considering the advantages of the FM method, such as easy storage and flexibly, it is believed that the improvement in mechanical properties based on the method suggested and proposed in this study—which only depends on the dosage of the FM—is highly beneficial for academic research and industrial application.
Footnotes
Declaration of conflicting interests
The author(s) declared no potential conflicts of interest with respect to the research, authorship, and/or publication of this article.
Funding
The author(s) disclosed receipt of the following financial support for the research, authorship, and/or publication of this article: This work was financially supported by the National Natural Science Foundation of China (grant number 51373048), the Postgraduate Research Innovation Program of Jiangsu University of Science and Technology (grant number YCX16S-19), and the Postgraduate Research and Practice Innovation Program of Jiangsu Province (grant number KYCX17_1833).