
Abstract
We systematically investigated highly ordered pyrolytic graphite film doped by low-energy atomic nitrogen ion of 20 eV, addressing major issues that include the effect of treatment time on the oxygen reduction reaction activity of highly ordered pyrolytic graphite film, and the influence of treatment time on the chemical and physical structures of highly ordered pyrolytic graphite surface. From the experimental results, it was clarified that the treatment for 60 s or less in nitrogen plasma was effective to modify the highly ordered pyrolytic graphite surface with improved oxygen reduction reaction performance, where the oxygen reduction reaction current increases by about 2 times as compared to that of untreated specimen. Moreover, we discussed the content of various C–N bonds, the strain which derived from the substitution of carbon and nitrogen, and a modification of the highly ordered pyrolytic graphite surface due to treatment, on the basis of the results of Raman spectroscopy, X-ray photoelectron spectroscopy, and atomic force microscopy.
Introduction
Carbon has been widely studied as a cathode catalyst in polymer electrolyte membrane fuel cell and lithium battery through the development of non-noble metal catalysts for the high oxygen reduction reaction (ORR) activity. As one possible alternative to the conventional platinum-based cathode catalyst, it has been reported that nitrogen-doped graphite shows high ORR activities. 1 –6
Nitrogen ion doping into carbon-based materials, such as highly ordered pyrolytic graphite (HOPG), graphene, and carbon nanotube, is used as one of most effective ways to substitute nitrogen atoms for carbon atoms. The irradiation energy of nitrogen ion treatment was mainly carried out between several hundreds of electron volts and several kilo electron volts. 7 –12 Kondo et al. irradiated a HOPG surface with an N+ beam more than 200 eV, where the conventional ion beam gun was used. 8 They observed two types of nitrogen species, that is, pyridinic-N and graphitic-N. However, such high energy may cause a significant damage on the surface morphology of carbon material.
In the present study, atomic nitrogen ions with very low energy of 20 eV were used to irradiate the HOPG sheet and the treatment was carried out in a short time of 180 s or less, where the surface damage can be much reduced. The nitriding process was performed in the electron beam excited plasma (EBEP). 13 –18 The conventional ion beam gun uses discharge plasma, in which it is difficult to dissociate nitrogen molecules into nitrogen atoms. Because electrons in the discharge plasma suffer frequent inelastic collisions with gas molecules to lose the energy, consequently few energetic electrons over 10 eV exist. On the other hand, energetic electron in the region from 40 eV to 100 eV has a large cross section of nitrogen molecule dissociation into atomic nitrogen. In the EBEP source, high current electron beam controlled in this energy region is used to produce the plasma. So, the EBEP source can generate the higher density nitrogen atoms and ions than the conventional ion beam source. In fact, the HOPG films prepared in our experimental conditions, that is, at the treatment time of 20 s using the atomic nitrogen ion of 20 eV, indicated that the relative X-ray photoelectron spectroscopy (XPS) intensity of graphite-N increased by about 3 times compared to that of pyridinic-N, though it is difficult to obtain by nitrogen ion beam of higher energies more than several hundreds of electron volts. 7 –12 By means of new doped technique using low-energy atomic nitrogen ion, we experimentally examined the relationship between the ORR activity and the surface properties of HOPG film.
Experimental methods
Specimen films (12 × 12 mm2) were prepared by mechanical exfoliation of HOPG sheets (12 × 12 × t1 mm3, PGCX04; Panasonic Corporation, Japan) using double-sided tape (667, 3M) under atmospheric condition. Mosaic spread by X-ray diffraction with a copper K α of the HOPG sheet was 0.4°–0.5°.
After the specimens of exfoliated HOPG (about 20 μm thickness) without thermal annealing were put on an aluminum (Al) plate (20 × 60 × t1 mm3), the specimens were electrically connected to the Al plate by conductive carbon adhesive sheets (Nisshin EM Co., Ltd, Japan). The Al plate was transferred immediately from atmosphere to a nitrogen plasma treatment chamber, as shown in Figure 1, which was attached to the EBEP system. 13 –18

Schematic diagram of nitrogen plasma treatment using EBEP system. EBEP: electron beam exited plasma.
The EBEP system consists of three sections: (I) a plasma cathode region (not shown in figure), (II) an electron acceleration region (not shown in figure), and (III) an EBEP region as describe earlier. The base pressure of the chamber was 2.0 × 10⁻⁴ Pa. The nitrogen gas was fed into the chamber and the gas pressure in the chamber was controlled to be 2.7 × 10⁻² Pa using a mass flow controller. Electrons in the plasma cathode region (I) were accelerated by an acceleration voltage (80 V). The electron density of about 109 cm−3 in nitrogen plasma was produced in the chamber by the electron beam. For the nitrogen plasma treatment, the specimens were exposed to nitrogen plasma for 20, 60, 180 s under the application of a DC voltage of −20 V to the Al plate. It should be noted that the specimens are treated by positive N+ with a kinetic energy of 20 eV, as the space potential of the plasma was almost 0 V. The measured specimen current was 1.2 μA/cm2 (7.5 × 10¹² ion/s cm2) during the treatment.
After the aforementioned treatments, the morphology of the specimen was examined using atomic force microscopy (AFM) in tapping mode (5100N; Hitachi-Technologies Corp., Japan). The structure and quality of the specimen were determined using a Raman spectroscopy system (inVia Reflex, Renishaw plc, UK). Raman measurements were performed at 532 nm with 1.8 cm−1 resolutions and integration times were 50 s at 10 mW diode-pumped solid-state laser power. The spectral profile in the range of 800–2000 cm−1 was fitted using two profiles with a mix mode (Gaussian and Lorentzian) of a different width intensity and peak location. The binding energy analysis was carried out using an XPS (VG-350, VG Scienta, Sweden) to investigate the relative content of various C–N bonds in the specimen films.
The electrochemical measurements were performed in 0.16 mol/L perchloric acid using a conventional three-electrode cell. The reference and counter electrodes were reversible hydrogen and platinum electrodes, respectively. Fabrication of the working electrode was done by putting the specimen onto a glassy-like carbon disk electrode (φ4 mm; BAS Inc., Eatonville, Washington, USA) with a conductive carbon paste (XC-32; Fujikura Kasei Co., Ltd, Japan). The potential of the electrode was controlled by an automatic polarization system (HZ-5000; Hokuto Denko Corp., Japan). All electrochemical measurements were performed at room temperature. The electrochemical stability was evaluated with cyclic voltammetry (scan rate 50 mV/s, from 0.05 to 1.2 V vs. reversible hydrogen electrode (RHE)) after nitrogen gas bubbling for 20 minutes (200 cm3/min). The electrochemical activity for the ORR was determined with scan voltammetry after oxygen gas bubbling for 20 min (200 cm3/min). Oxygen reduction voltammogram was obtained with rotating the working electrode (100, 400, 900, 1600, 2500 r/min) by sweeping the potential (scan rate 10 mV/s, from 0.2 to 1.2 V vs. RHE).
Results and discussion
The variations in cyclic voltammogram (CV) of specimens treated at different times are shown in Figure 2. The specimens for shorter treatment time had the greater reduction current and CV curve under a nitrogen atmosphere. In the case of 20-s treated specimen, the greatest reduction current was particularly observed at potential of about 0.05 V. The CV curves in the potential range around 0.05 V represent the reduction current corresponding to hydrogen evolution reaction on the HOPG surface. Increase of capacitance at double layer region for the 20-s and 60-s treated specimens suggests higher roughness of the surfaces.

CV of HOPG films treated at different times. CV: Cyclic voltammograms; HOPG: highly ordered pyrolytic graphite.
Figure 3 shows the potential versus ORR current curves measured at 10 mV/s and various rotation rates of the working electrode under an oxygen atmosphere for the untreated, the 20-s treated, the 60-s treated, and the 180-s treated specimens, respectively. On the ORR curves in Figure 3, the background current, which was calculated from the CV obtained under oxygen-free (N2) condition with the different scan rate, 50 mV/s, as shown in Figure 2, could be estimated 0.2 μA or less. The value of the estimated background current consists with current at onset potential, approximately 1.0 V, of ORR. Therefore, it is considered that the obtained ORR voltammograms are not influenced by the current taken under oxygen-free conditions. Since the ORR current of the untreated specimen hardly changed by the rotation rate, it is therefore thought to be a poor catalytic activity for the ORR performance. In contrast, the ORR current of the 20-s treated specimen increased with the increasing rotation rate. To estimate the ORR performance of the 20-s treated specimen, the ORR current at 0.85 V, where mass transport effects of the oxygen in bulk solution are negligible, versus RHE was calculated by Koutecky–Levich plot, 19 as shown in Figure 4. From the linear regressions in Figure 4, the I ORR current at 0.85 V, which is corresponding to the kinetic current, 20 could be quantified from the y-axis intercepts. In aqueous solutions, there are primarily two reaction pathways in the ORR: a four-electron process in which oxygen is reduced to H2O and a two-electron process in which oxygen is reduced to hydrogen peroxide. The number of electron transfer (n) during oxygen reduction can be estimated by the slope of the Koutecky–Levich plot in Figure 4. 21 Since the n values of 20-s and 60-s treated specimens were 3.1 and 3.3, respectively, the ORR activities have contributed from these two processes.

Potential versus ORR current curves measured at various rotation rates of the working electrode under an oxygen atmosphere for (a) untreated, (b) 20-s treated, (c) 60-s treated, and (d) 180-s treated HOPG films. ORR: oxygen reduction reaction; HOPG: highly ordered pyrolytic graphite.

Koutecky–Levich plots of 20-s and 60-s treated HOPG films. Symbols are experimental data calculated from the ORR voltammograms at 0.85 V versus RHE in Figure 3(b) and (c). HOPG: highly ordered pyrolytic graphite; ORR: oxygen reduction reaction; RHE: reversible hydrogen electrode.
Figures 5 and 6 show the reduction current at 0.05 V (IN2) observed by CV measurement and the resultant ORR current at 0.85 V (IORR). The IORR of untreated specimen was −2.8 μA/cm2, as shown in Figure 6. In the case of 20-s treated specimen, the IORR increased to −5.6 μA/cm2. Furthermore, the IORR of 60-s treated specimen increased up to −6.3 μA/cm2 and gradually decreased to −1.8 μA/cm2 at treatment time of 180 s. As shown in Figure 5, on the other hand, the greater IN2 was obtained at the 20-s treated specimen. From the aforementioned results, it is suggested that HOPG films fabricated using the nitrogen plasma can give the high ORR performance by the shorter treatment time, that is, 60 s or less.

Relationship between the treatment time and the reduction current (I N2) of HOPG films. Potential sweep rate was 50 mV/s. HOPG: highly ordered pyrolytic graphite.

Relationship between the treatment time and the ORR current at 0.85 V (I ORR) of HOPG films. Potential sweep rate was 10 mV/s. HOPG: highly ordered pyrolytic graphite; ORR: oxygen reduction reaction.
To determine the effect of treatment time on the structure of HOPG specimens, the specimens were examined by Raman spectroscopy. Figure 7 shows Raman spectra for the specimens treated at different times. The literature generally splits these into a graphite or G-peak at 1580 cm−1 in crystalline graphite and another band around 1360 cm−1 referred to as the D-peak or disorder peak. 22–24 The experimental findings suggest that the D-peak in the 20-s treated specimen was larger than those of untreated and 180-s treated specimens. It is thought that the D-peak at about 1354 cm−1 is generated by strain of the five- and six-membered rings, which are derived from the substitution of carbon by nitrogen.
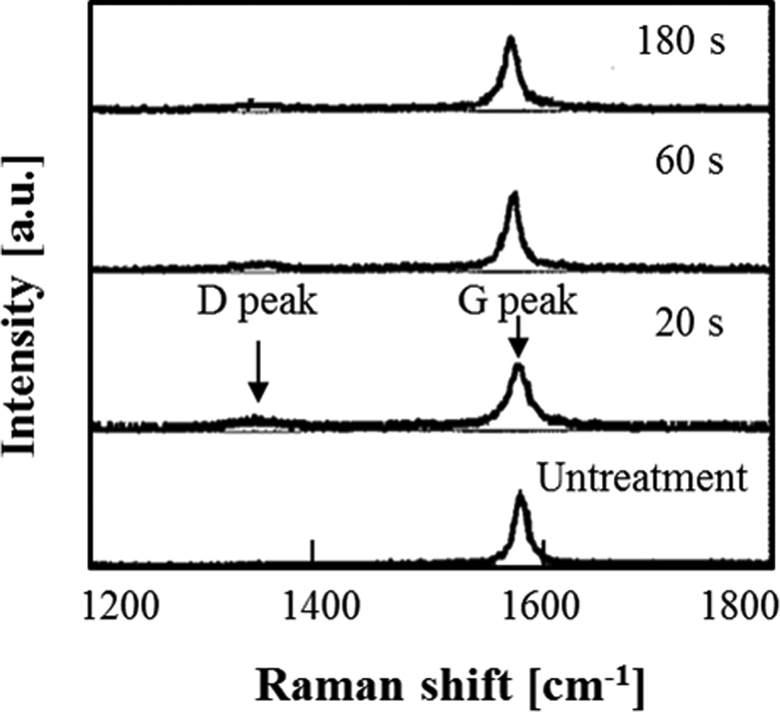
Raman shifts of HOPG films at different treatment times. HOPG: highly ordered pyrolytic graphite.
Figure 8 shows the I D/I G ratio of specimens on treatment time. The I D/I G ratio of specimen increased with decreasing treatment time. Thus, the increasing of I D/I G suggests that the specimens at shorter treatment time had greater concentration of imperfection, which indicated the substitution of carbon by nitrogen. The behavior of the I D/I G ratio of specimen consists with the results obtained from the electrochemical measurements, that is, CV and ORR measurements.

I D/I G ratio of HOPG films at different treatment times. HOPG: highly ordered pyrolytic graphite.
XPS is used mainly to analyze the relative content of various C–N bonds in the nitrogen-doped HOPG films. 6,7 –12 Figure 9 shows the C1s and N1s spectra of the 20-s-treated HOPG film. Typical atomic concentrations were 89%, 8%, and 3%, for C, O, and N, respectively. The C1s and N1s spectra were apportioned into three (graphite at 284.5 eV, C–N bond at 285.3 eV, and C–O bond at 288.5 eV) and four (pyridinic-N at 398.6 eV, pyrrolic-N at 399.6 eV, graphitic-N at 401.1 eV, and N–O bond at 403.1 eV) components, respectively. 7 –11 The pyridinic-N and graphitic-N components are attributed to a nitrogen atom bonding two and three carbon neighbors in a six-membered ring, respectively. In the pyrrolic-N component, a nitrogen atom is connected between two carbon atoms in a five-membered ring. Since the HOPG films obtained in our experimental conditions have not carried out a thermal annealing, it is supposed that the HOPG films have reactive surface defects as passivates and/or absorbed by oxygen species upon exposure to atmosphere. Therefore, the N1s component at 399.6 eV might include amine 12 and/or pyridonic-N6 besides pyrrolic-N component. Increasing the treatment time, on the other hand, the intensity of three peaks for the C1s spectra almost unchanged.

(A) C1s and (B) N1s XPS spectra of 20-s treated HOPG film. X-ray photoelectron spectroscopy; HOPG: highly ordered pyrolytic graphite.
Figure 10 shows the XPS intensity of the graphitic-N, pyridinic-N, and pyrrolic-N components for the specimens at different treatment times. The XPS intensities of pyrrolic-N and graphitic-N components were decreased with increasing treatment time, as shown in Figure 10. Most importantly, the treatment by shorter time, that is, 20 s, significantly increased the intensity of graphitic-N component. In contrast, the intensity of pyridinic-N was increased with increasing treatment time. 9 –11 That is, the prolonged bombardment by nitrogen ions leads to a continuous increase of pyridinic-N and thus to more defects but to no increase in graphitic-N components, because of termination of hole edges with pyridinic nitrogen, as reported by Zao et al. 11
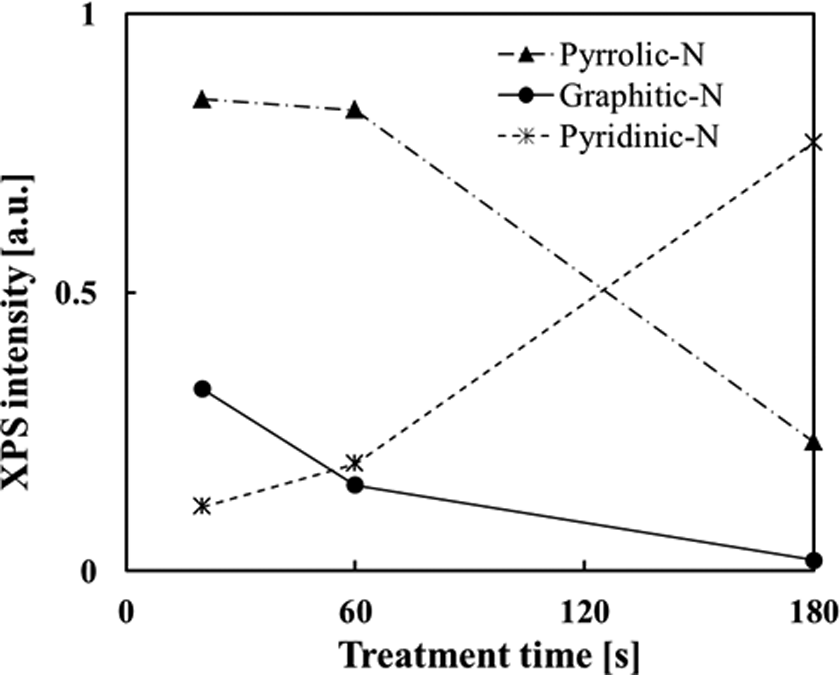
XPS intensities of the graphitic, pyridinic-N, and pyrrolic-N components for the HOPG films at different treatment times. XPS: X-ray photoelectron spectroscopy; HOPG: highly ordered pyrolytic graphite.
The variation of XPS intensities is considered to be due to the strain of the graphite structure which is derived from the substitution of carbon and nitrogen, that is, I D/I G ratio, as shown in Figure 8. Since the 20-s treated specimen indicated the greatest I D/I G ratio, as shown in Figure 10, it is thought that pyrrolic-N and graphitic-N are the dominant components leading to the defect signal I D in Raman spectrum. In the case of the 60-s treated specimen, the XPS intensity of graphite-N relatively decreases and it suggests that the other species are converted to pyridinic-N by the collision and reflection due to nitrogen ions, as shown in Figure 10. It has been reported that the pyridinic-N component is a stable configuration in which nitrogen atom is bonded to two sp 2 carbon atoms, resulting from nitrogen doping in single-walled carbon nanotubes. 9 In the case of the 180-s treated specimen, therefore, it is considered that pyridinic-N-rich surfaces are obtained with the collision and reflection due to high-dosed nitrogen ions, as shown in Figure 10.
Ikeda et al. have reported that the graphitic-N component of N-doped graphite plays an important role in ORR as a fuel cell catalyst. 1 From the aforementioned results, the high ORR performance by shorter treatment time, that is, 20 s and 60 s, is concluded to be due to the increases in the graphitic-N component and strain of graphite structure resulting from the substitution of C–N bond. On the other hand, the importance of pyridinic-N of HOPG film by nitrogen doping was discussed in experimental and theoretical investigation. 6 The experimental study by Guo et al. has indicated that the pyridinic-N component is much more effective rather than graphitic-N component concerning the ORR activities. 6 On the contrary, the ORR performance obtained in our experiments, that is, I ORR current at 0.85 V, was decreased with increasing of the intensity of pyridinic-N component, that is, at the treatment time of 180 s. Under the experimental condition of Guo et al., it is supposed that the conventional nitrogen ion beam contains both N+ and N2 + ionic species, in contrast to the predominant nitrogen ions generating by the EBEP system. 13 –18 The differences between the ORR performance and the two components of HOPG surface therefore are considered to be due to the mixing of different types of nitrogen species in the HOPG film which is inevitable in the doping process.
The AFM images in Figure 11 clearly show surface structure changes depending on the treatment time, where nanometer-scale irregularities are present at the specimen surface. The roughness (Rz: mean value of 30 data) of the 20-s treated specimen was about 1.1 nm. The observed roughness of the 20-s treated specimen suggests an increase of active sites on the HOPG surface, which relates the electrolytic double layer. Therefore, it is supposed that the greater I N2 was obtained at the 20-s treated specimen. Furthermore, the Rz of the 60–s treated specimen increased to about 3.3 nm. The layer structure of HOPG is held together by van der Waals forces with the interlayer distance of about 0.34 nm. That is, the surface irregularities of the 20-s and 60-s treated specimens occur corresponding to the thickness of about 3 and 10 layers of HOPG, respectively. Observed modification in the surface structure of HOPG suggests that the increasing of surface area is dependent on the surface structure imperfections.

AFM images of HOPG films at different treatment times. AFM: atomic force microscopic; HOPG: highly ordered pyrolytic graphite.
From the results of I D/I G ratio and XPS intensity of graphitic-N, which correspond to the imperfection and C–N bond component of HOPG surface, one sees that a difference exists between the 20-s and 60-s treated specimens. In fact, the preceding experiments indicate that the I ORR of 60-s treated specimen is greater than that of 20-s treated specimen despite it has the lower I D/I G ratio and intensity of graphitic-N. Under the hypothesis that the 60-s treated specimen led to the increase of surface area, that is, the modification of 10 layers in HOPG surface, therefore, we suppose that the 60-s treated specimen has a higher catalytic activity for the ORR performance, which is showing the greatest current at 0.85 V (I ORR), that is, −6.3 μA/cm2. It has recently been reported that the non-nitrogen doped carbon based materials (multi-walled carbon nanotube and graphene nanosheet) have a high ORR activity. 25,26 The origin of high ORR activity has been suggested to be the roles of carbon restructuring and defect structure. Accordingly, it is considered that the topological defects of 10 layers in HOPG surface is one possible mechanism for the high ORR activity at the 60-s treated specimen, beside the graphitic-N component. The Rz value of the 180-s treated specimen was about 0.5 nm, on the other hand, it is considered that the irregularities decreased for the surface structure modification by the sputtering process. Since the HOPG lattice is strongly perturbed during the treatment time of 180 s, the sputtering also leads to variation of C–N bonds through the removal of carbon by the impinging N+. 5 However, further studies are needed for a confirmation of the phenomena.
Conclusions
We determined that the treatment time in the nitrogen plasma has an optimum value for improving the ORR performance of HOPG specimen. In the case of specimen at shorter treatment time, that is, 60 s or less, the ORR current increases by about 2 times as compared to that of untreated specimen.
It is concluded that the nitrogen plasma treatment for shorter time induces effectively (I) a greater concentration of imperfection, that is, the strain which derived from the substitution of carbon and nitrogen, (II) an increase of graphitic-N component, (III) an increase of surface area due to a modification of 10 layers or less in the HOPG surface.
These results provide important findings in terms of a fabrication of carbon-based catalyst using nitrogen plasma treatment.
Footnotes
Acknowledgment
The authors would like to thank Associate professor Masanori Hara at Toyota Technological Institute for valuable comments and advice and Ms. Mieko Kondo for her beneficial assistance in carrying out the electrochemical experiments.
Declaration of conflicting interests
The author(s) declared no potential conflicts of interest with respect to the research, authorship, and/or publication of this article.
Funding
The author(s) received no financial support for the research, authorship, and/or publication of this article.