
Abstract
This study investigates the effects of commercial nanoparticles on thermal and mechanical performance of rigid polyurethane foams. Two different types of nanoparticles are considered as fillers, spherical titania and rod-shaped halloysite clay nanotubes. The aim of this study was to produce rigid polyurethane foams modified with titania nanocrystals and nanohalloysite in order to obtain polyurethanes with improved properties. The laboratory scale-up will be suitable for the production in many branches of industry, such as construction and automotive production. In particular, these foams, added with commercial nanoparticles, characterized by better thermal and mechanical properties, are mainly used in construction for thermal insulation of buildings. The fillers were dispersed in the components, bringing rates up to 10%. In these investigations, the improvement of the thermal properties occurs by adding nanoparticles in the range 4–8% of titania and halloysite. The mechanical properties instead have been observed an improvement starting from 6% of nanoparticles addition. All data are in agreement with scanning electron microscope observations that shown a decrease in the average cell size and an increase in the cell density by adding nanoparticles in foams.
Keywords
Introduction
The foams optimized with nanoparticles exhibit increased strength and damping properties over traditional foams. 1 –10 Foams added with nanoparticles are defined as composites with a polymer matrix and fillers that are less than 100 nm in at least one dimension. The nanoparticles offer a convenient opportunity in the formation of polymer foams for several key reasons 2 : to function as heterogeneous nucleation sites; to provide conductivity or mechanical strength of the foam while not decreasing other properties; to change the rheological properties; to reduce the energy for bubble nucleation; and to change the structure and density of the foam.
Therefore, the use of nanoparticles may lead to a sensible variation of foam morphology, with an enhancement of thermal insulating properties, a reduction of the thermal aging phenomena and an enhancement of the mechanical properties. 1 –10
Standard polyurethane (PU) foams have some limitations, such as low mechanical strength and low thermal stability. 1,2 The properties of PU depend not only on the intrinsic properties of the raw materials but also on the foam morphology, such as cell density, cell size and size distribution. Therefore, one of the most important aspects of PU research is to enhance the strength of the foam without compromising its lightweight. There are two approaches to solve this issue. The first one is to decrease the average cell size without decreasing the foam density, meant as the final bulk density of the product. The second approach is to use fillers to reinforce the polymer matrix. A special interest is addressed in the use of nanofillers to decrease cell size and at the same time to reinforce the polymeric matrix.
In very recent works, 11 –13 materials for the building containing synthesized nanoparticles have been tested in the laboratory, and the improved properties were attributed to surface treatments of nanofillers. In this work, some commercial nanoparticles have been employed in building sites due to their low cost, instead of those synthesized in the laboratory. The originality of this work is due to the choice of the nanoparticles. The titania (TiO2) has been used for its particular property of absorbing the solar radiation. In this way, the TiO2 becomes reactive and allows oxygen to react with the organic substances dangerous for humans, transforming them into the anhydrite carbon dioxide and water. Since the shape of the TiO2 is spherical, it has been decided to put it in comparison with a commercial elongated nanoparticle such as halloysite. Halloysite clay nanotubes (HNTs) have two dimensions at the nanometric scale while the third is larger, these particles possess an elongated structure. TiO2 nanoparticles have all three dimensions at the nanometric scale.
This choice has been due to the previous work 12 in which the behaviour of elongated nanoparticles is better than the spherical shape ones, but this effect is still under investigation.
Cell size, size distribution and cell density depend on the cell nucleation and cell growth mechanisms, all of which contribute to the final bulk density of the product. The cell size is inversely proportional to the number of nucleation sites, and the percentage of nanofillers can increase the nucleation rate 14 –26 ; for this reason, in this work, we have used the percentage of filler up to 10%. An improvement of thermal and mechanical properties has been reached, and these results have been compared with morphological analyses performed with scanning electron microscopy (SEM).
Materials and methods
Raw materials
The main components for a PU foam are as follows: polyols (Varanol RH 360, CP 260, Dow Chemical Company, Italy) and the isocyanate (Voranate M 600, Dow Chemical Company, Italy). In the foam formulation, a primary polyol and a secondary polyol were used. The characteristic of the primary polyol (Varanol RH 360, Dow Chemical Company, Carpi, Correggio, Italy) is of having many hydroxyl groups, while the secondary polyol (CP 260, Dow Chemical Company, Carpi, Correggio, Italy) promotes the reaction. The contribution of CP 260 must remain low, because it causes an opening of the cells. The isocyanate is very reactive towards components that have active hydrogen (polyols). As regards the preparation of rigid foams, it has been considered appropriate to use an oligomeric diphenylmethane diisocyanate. The kinetics of polymerization have been favoured adding the catalysts supplied with Air Product (Polycat 5 and Polycat 8, Dow Chemical Company, Italy). Among the physical foaming agents, cyclopentane has been chosen (provided by Sigma Aldrich, Milan, Italy) for its good solubility in the polymer matrix and low thermal conductivity. These characteristics led to the production of the PU with good insulation and physical properties.
To improve the stability and the cellular regulation, the polyol mixture has been added to a silicon reagent (copolymer polyester–polysiloxane) provided by Evonik: Tegostab B 8474.
The particles introduced are commercial purified dehydrated HNTs, obtained from Applied Minerals, Inc. (New York City, New York, USA), and Aeroxide TiO2 (P25) nanocrystals chosen for its characteristic of being inexpensive and non-toxic. 27 P25 nanocrystals are a commercial product made by pyrolysis and consist of 80% of anatase crystal phase and 20% of rutile.
Foam formulations and densities are reported in Table 1.
Foam formulations and densities. 12

Foam preparation
The rectangular panels have been realized through the foaming in batch and are accomplished by pouring the reaction mixture into a plastic mould of size 400 × 400 × 40 mm (Figure 1). The mould is coated with an aluminium sheet of thickness 1 mm, to avoid the reaction between the plastic mould and the reagents of the reaction mixture.

Mould for foaming.
The mould is designed to resist to an internal pressure of 2–3 bar; there are three holes to allow the evacuation of the gases, produced during the foaming. The nanoparticles have been dispersed using an UltraTurrax DI 18 Basic, with speed 23,000 r/min for 1 h. This period has been needed to not overheat the mixture and to have a good dispersion of the nanoparticles. In the preparation of PU, the amount of each reagent must meet strict stoichiometric ratios. After having established the grams of polyols (100 g), to determine the right amount of isocyanate to use, it is necessary to ensure that the isocyanate groups –NCO react only with a hydroxyl group –OH. The number of hydroxyl n OH is 28

where f is the functionality and MW is the molecular weight. The equivalent weight in gram per mole is defined by

Replacing equation (1) in (2), the equivalent weight of the hydroxyl groups is obtained

Similarly, the equivalent weight of the isocyanate groups can be obtained

where %NCO is the concentration of the –NCO group reactive in the isocyanate compared to the weight. The number of equivalent (n eq) can be defined by

where g is the weight in grams. The grams of isocyanate are

As already mentioned, the isocyanate groups react by following a unitary relationship with the hydroxyl groups. Therefore, it is better expressed using equation (4) in terms of the equivalent of hydroxyl. It refers to a weight of 100 g and employing equation (4), equation (6) becomes
Using equation (4), we obtain

Operating with a mixture of polyols with different hydroxyl numbers and considering the chemical agent water, the n OH of equation (8) is the weighted average of all hydroxyl numbers, and for this, equation (8) becomes

Equation (9) is used to calculate the grams of isocyanate. In this equation, not only the hydroxyl groups are taken into account but also all the polyols put in the mixture, including water –OH, where
Practically, this index has been set equal to 1.1 ÷ 1.3; in fact, if a greater index had been used, what would result is an excess of reactive isocyanate with a consequent worsening of the mechanical properties.
For the amount of blowing agent used, it is necessary to apply an appropriate equation. It is known that putting an excessive amount of blowing agent compared to the theoretical value obtained, it will have negative consequences on the structure of the foam that will be less thick and very porous with disastrous results both on the mechanical properties and on the thermal conductivity. In fact, minimum values of conductivity are obtained for a density ranging between 30 and 40 kg/m3; if they differ from these values, the conductivity increases.
The mass of blowing agent (cyclopentane and water) to add has been calculated in this way 28

where m PU is the mass PU, while m BA is the mass of blowing agent. The volume V can be approximated to that of the expanding gas, because the foam is made to 97% by gas. Usually, the value assigned to the ratio T/T 0 is included in the range 1.3 ÷ 1.6.
The

It has been noticed that although equation (12) has been applied and then employed the precise amount of blowing agent, the density result was not coincident to the real.
It is very important to calculate the amount of foaming agents, particularly water, because the residual water makes even more difficult to control the density of the final material. This probably depends on the interactions that the different types of nanoparticles have with water.
Morphological analysis
The morphology of the foams has been studied by means of SEM (Carl Zeiss Merlin, Jena, Germany). The material has been cut with a razor blade, and the fracture surface was sputter-coated with gold before observation; the accelerating voltage is set at 5 kV to avoid degradation of the sample. The morphological characterization has been used to study the filler dispersion and the mean cell size. The cell density (Nf ) was calculated according to equation (13) and then normalized to the ratio between the nanocomposite foam density and the neat PU foam cells 19 –21

where n is the number of cells, A is the area in a SEM micrograph and M is the magnification factor.
Thermal conductivity measurements
Thermal conductivity measurements of PUs are obtained using a transient technique called hot disc experiment. The Hot Disk Thermal Constants Analyzer (Göteborg, Sweden) is a system designed to measure the thermal transport properties of a sample: thermal conductivity, thermal diffusivity and specific heat. The system is based on a patented transient plane source technique that follows DIN EN ISO 22007-2; it can be used to study materials with thermal conductivities from 0.005 W/m K to 500 W/m K and covering a temperature range from 30 K to 1000 K. The reproducibility of the instrument is typically better than 1%, and the accuracy is better than 5%. The measurements have been carried out according to UNI EN 13165 29 , and the analysis procedure of the Hot Disk was reported in the following documents. 30,31 The predefined shape of the sample is not important; it is essential that the sample has a flat surface in each of the two halves, which has been obtained from the band saw, and has been thermostated for 24 h at 23°C. During the measure, the temperature follows a transitory with an increase of around 0.5°C above the temperature environment.
Physical–mechanical properties
The tests have been made on specimens of prismatic side with square base, with a nominal thickness of 25 mm and a relative error within 0.5%, according to the UNI EN 826, 32 due to the cut of the band saw, with which the tests have been cut. The width of the specimens must not be less than their thickness in order not to reduce the accuracy of the result. It has been applied a load of 250 Pa and press the sample at a constant crosshead speed with a servo-hydraulic TECNOTEST testing system. The machine for compression test provided two parallel smooth plates of steel, having at least the diameter equal to the side of the specimen under test. One of the plates has been fixed, but having the possibility to move with a constant speed, while the other is movable, consisting of a ball joint positioned centrally, so as to ensure that the specimen is subjected exclusively an axial force. The machine consists of a device for the measurement of the displacement and a sensor fixed to one of the plates to measure the force produced by the reaction of the specimen on the plates. For PUs when the stress maximum corresponds to a deformation lower than 10%, it is defined ‘compressive strength’.
The specimens have been conditioned for at least 6 h at 23 (± 5)°C, and the test has been conducted at 23 (± 5)°C. The placing of the specimens occurs between the parallel plates of the machine for the compression test; it is very important that the base of the specimen is normal to the direction of compression and that has been applied a preload of 250 (± 10) Pa. The specimen was compressed with the mobile plate set at a constant speed of 2.5 mm/min, and the test continued until reaching a deformation of 10%.
Results and discussion
Morphological characterization
When a filler is introduced into a polymeric material, the ideal is to have a regular granulometry and that its particles are sufficiently small to enable better distribution in the matrix. Figure 2 presents the image obtained with transmission electron microscopy of commercial TiO2 Aeroxide P25 and SEM of commercial HNTs.

(a) TEM image of TiO2 Aeroxide P25. (b) SEM image of HNTs. TEM: transmission electron microscopy; SEM: scanning electron microscopy; HNTs: halloysite clay nanotubes; TiO2: titania.
Nanoparticles act as nucleation agents and promote the cell nucleation because of an effective decrease in the required energy for creating bubbles. According to the ‘classical’ theory of homogeneous nucleation, the formation of a gas bubble in a liquid mass is associated with a change in Gibbs free energy. The free energy expression of Gibbs has a maximum point in correspondence with the critical radius Rc value. For values of radius less than Rc , the bubbles formed tend to dissolve again into the liquid. Their growth, in fact, is thermodynamically a disadvantage, since it requires an increase in free energy. For higher values of radius Rc , the bubble tends to grow, because this growth corresponds to a decrease in free energy.
Any solid element introduced into the mixture, such as nanoparticles, tends to decrease the value of ▵G and thus promote the nucleation. When the nucleation occurs near the interface with a third phase, generally solid, it is called heterogeneous nucleation.
The energy barrier for the heterogeneous nucleation is much reduced compared to the homogeneous one; in particular, the higher the solid–liquid surface tension and the lower the bubble–solid surface tension, the more it decreases. In this study, there has been a higher nucleation in the case of halloysite, carrying out an improved thermal conductivity, due to the higher solid–liquid surface tension.
Nanoparticles in comparison with conventional nucleating agents have a very extensive surface contact with the polymer matrix and very high surface density. Compared to conventional micron-sized filler particles used in the foaming processes, nanoparticles offer unique advantages for enhanced nucleation. The improved nucleation efficiency is reported in many studies for different polymer/nanoparticle systems at very low particle content rations. 4,17,33 –42
The extremely fine dimensions and large surface area of nanoparticles provide a more intimate contact between the particles, polymer matrix and gas. Probably, the rod shape of halloysite, compared to the spherical shape of TiO2, constitutes a major impediment in the mixture of the liquid that will generate the PU foam. As it has been mentioned earlier, every obstacle it contributes lowers the Gibbs free energy by promoting the nucleation, thereby increasing the insulating properties.
Furthermore, a significantly higher effective particle concentration can be achieved at a low nominal particle concentration.
The morphology of nanocomposite foams was evaluated by SEM ( AIS-2100, Seron Technology, Korea). The foam mean cell size (Figures 3 and 4) has been measured by ImageJ (autocad autodesk) software, and the values have been obtained as an average of minimum 200 cells; the cell density (Table 1) was calculated from SEM micrographs. By analysing foams morphology in detail, it has been shown that the filler dispersion has been always fairly good: No agglomeration of great dimensions can be found.

Cell size (μm) of polyurethane foam additivated with TiO2 P25 nanoparticles. TiO2: titania.

Cell size (μm) of polyurethane foam additivated with HNTs nanoparticles. HNTs: halloysite clay nanotubes.
All foams exhibit polygons closed-cell structures with energetically stable pentagonal and hexagonal faces. The neat PU foam has fewer cells and a larger cell size than PU nanocomposite foams. From SEM images, the cell size, wall thickness and density were measured and summarized in Table 2. From the figure, it can be seen that the cell size is different for the pure PU foam and the nanoreinforced foam. PU foams containing nanoparticles have a higher cell density Nc and smaller cell size d, suggesting that the dispersed nanoparticles act as heterogeneous nucleation sites during cell formation. With the addition of nanoparticles, the overall cell structure has become less uniform, the cell walls have become thicker, and there is a larger amount of broken cells, above all in the samples prepared adding 10% of nanoparticles, in which, also, a decrease in cell walls has been observed.
Wall thickness (nm) and density (Nf ) (cells/cm3) of pure foam (neat) and nanoreinforced foams with TiO2 P25 and HNTs.

HNTs: halloysite clay nanotubes; TiO2: titania.
Alterations in the cell morphology are due to the presence of nanoparticles that affect the process of cell nucleation.
In general, a decrease in the cell size of the foam containing nanoparticles is due to nanoparticles serving as nucleation points, resulting in the formation of a larger number of cells and, hence, a smaller cell size. Thus, the key issues in decreasing the cell size and increasing the cell density are addition of small amounts of nanoparticles and their uniform dispersion within the matrix material.
Figure 5 shows SEM images of the fractured surface of PU foams.
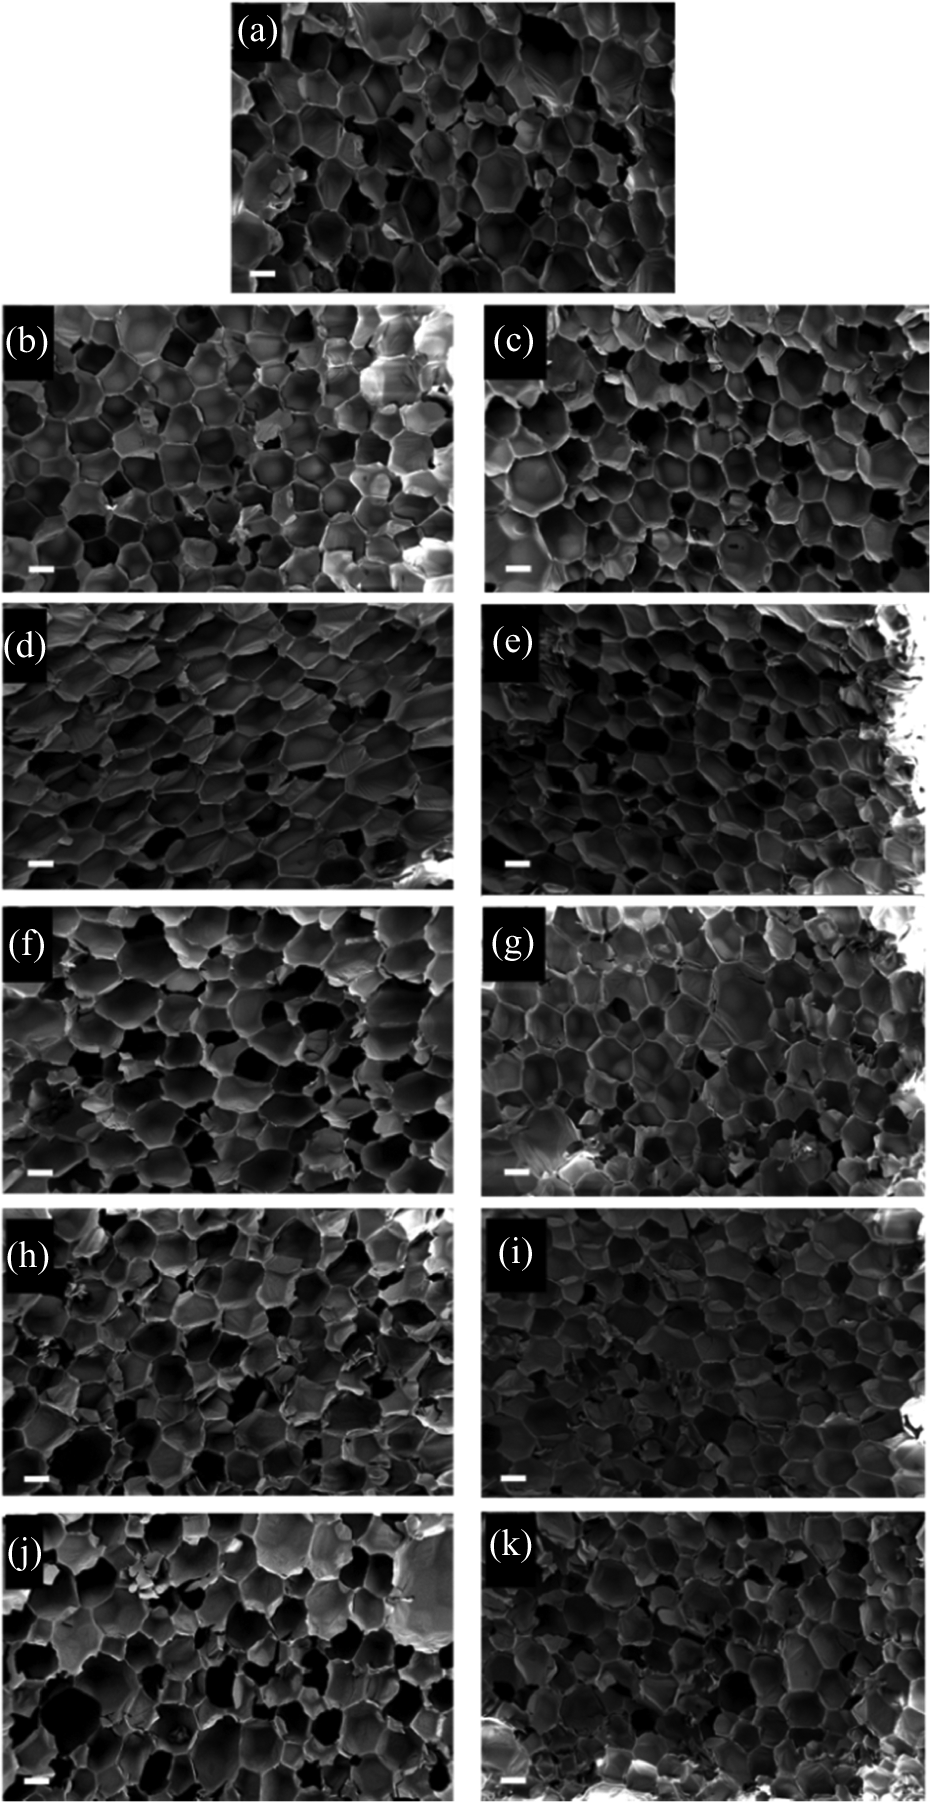
(a) Neat foam; nanoreinforced polyurethane foams: (b, c) P25–HNTs 2%; (d, e) P25–HNTs 4%; (f, g) P25–HNTs 6%; (h, i) P25–HNTs 8%; (j, k) P25–HNTs 10%. Scale bar 200 μm. HNTs: halloysite clay nanotubes.
Thermal conductivity
The results on thermal conductivity of the neat, TiO2 and HNTs nanoadditivated PUs are summarized in Table 3. The TiO2 additived foams show the same trend of the conductivity value 3 and 10 days after production. The data of thermal conductivity are worsening up 6%, probably, because the nanoparticles have been badly dispersed in the mixture generating a conductivity value unstable.
Thermal conductivity – HNTs and TiO2.
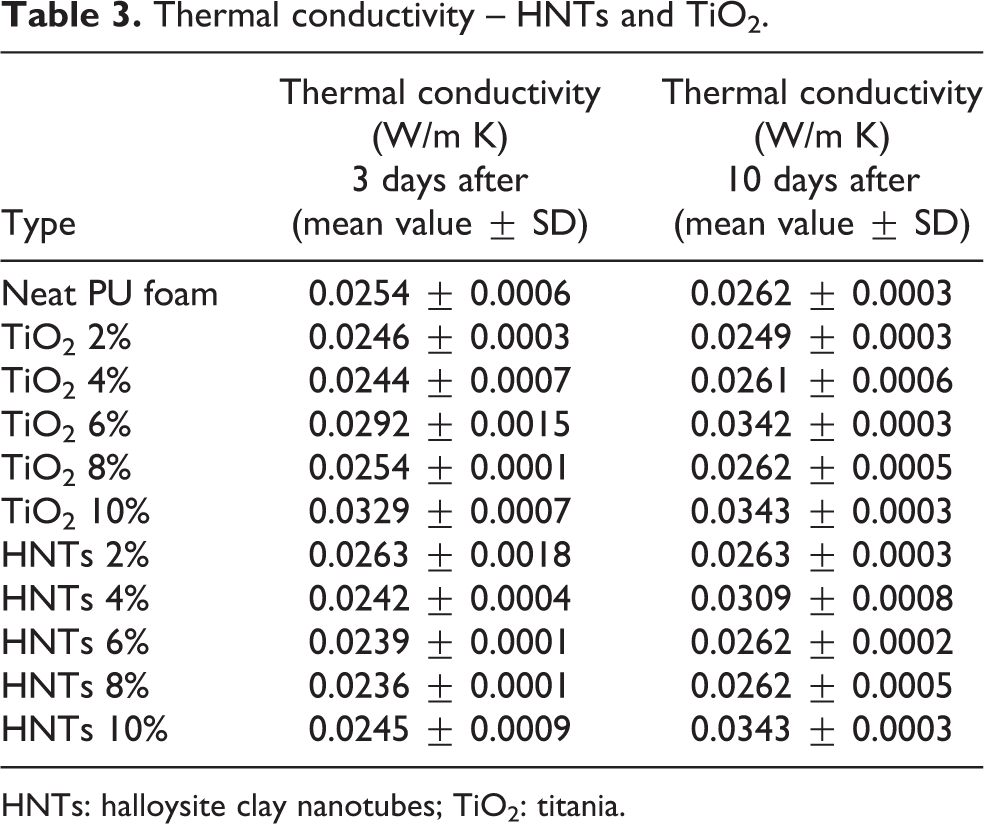
HNTs: halloysite clay nanotubes; TiO2: titania.
This is due to two factors: the first one is that the agglomerates arranged on the wall (Table 2) rather than at the nodes of the cell and the second one is the presence of many broken cells.
PU foams additivated with HNTs after 3 days from the production, the conductivity value continues to decrease gradually with increasing percentage of nanoparticles until 8%.
For both foam compositions, when the nanoparticles concentration reaches 10%, detrimental effects in terms of conductivity happened. The addition of nanoparticles, above 8%, leads to the formation of some bigger and some broken that deprives the foam of its insulating properties.
Physical–mechanical testing
Compressive stress–strain curves for the neat and nanophased PU foams are shown in Figures 6 and 7.

Compression stress–strain plot TiO2. TiO2: titania.

Compression stress–strain plot HNTs. HNTs: halloysite clay nanotubes.
The curves show three stages of deformation: initial linear behaviour, linear plateau region and densification. The initial slope is used to calculate the compressive modulus of foam, and the intersection point between the initial slope and the plateau slope is used to calculate the compressive strength. In Figure 6, it is observed that the compressive modulus and strength are higher, of foams added with 6, 8 and 10% of TiO2, than the neat. For low dispersions, 2–4%, TiO2 PU foam shows lower values than the neat. Moreover, the low slope depends and the shape of the plateau region depends on the morphology of cells. In case of linear plateau, cell deformation occurs as combination of cell bending and collapse. Thus, it can be said that the behaviour of the PU foam can be improved due to infusion of nanoparticles.
In Figure 7, the curve of the neat foam has a trend similar to the additivated foams with 6, 8 and 10%, while the foams, added in 2 and 4%, suffer strong deformations with applications of small loads, so these foams are not able to be used in zones of the buildings designed to trampling. The results of compression tests show that infusion of HNTs gives more strength to the cells.
Conclusions
The nanoreinforced PU foams manufactured with two different types of nanoparticles, TiO2 (Aeroxide P25) and HNTs, have been dispersed into the PU matrix through sonication technique. Both neat and nanophased foams are tested in compression and thermal analysis. The microstructure has been investigated by the SEM. It is observed that PU/TiO2 shows the highest performance for mechanical properties, because of the infusion of TiO2, which gives more strength to the cells. Probably, as the nanoparticles are arranged on the walls of the cells, it generates an increase in the wall thickness that confers a higher mechanical resistance. PU/HNTs shows, instead, the highest performance for thermal properties in terms of thermal conductivity immediately after production, showing a continuous decrease in the conductivity values in inverse proportion to the addition of nanoparticles up to 8%. As reported in the literature, the improvement of thermal and mechanical properties has been obtained using elongated nanoparticles, such as clays or carbon nanotubes. 5 For this reason, it has been decided to compare halloysite with spherical nanoparticles (TiO2) for testing if rising the percentage (up to 10%) of fillers confers an enhancement of foam properties. The results show that despite the high percentage of fillers, the behaviour of elongated nanoparticles is better than the spherical ones. Probably, the elongated shape of the nanoparticles makes the energy of nucleation decrease much more, with respect to the spherical shape, by making the number of nucleation to increase. This structure ensures the presence of gas inside the cells, which gives better insulating properties. All data are confirmed by the SEM analysis. The literature is full of novel nanocomposite materials; but in order to move these materials into commercial products, several challenges must be overcome. For future developments, we could combine nanoparticles with different shapes, with high surface area and rich surface chemistry 12 trying to optimize the production protocol. If these improvements have been due to the different shapes of nanoparticles or by surface treatments, 1 this can be confirmed by further studies.
Footnotes
Acknowledgements
The authors are grateful to Annagrazia Monteduro, PhD for assistance and performing all scanning electron microscopy micrographs.
Declaration of conflicting interests
The author(s) declared no potential conflicts of interest with respect to the research, authorship and/or publication of this article.
Funding
The author(s) disclosed receipt of the following financial support for the research, authorship and/or publication of this article: This work was supported by the PON, prot. n. 84/Ric. Del 2 marzo 2012 NAnoMAteriali per l’edilizia SosTEnibile (NAMASTE) prot. PON04a3_00107 CUP: B35I12000100005.