
Abstract
The aims of the present study were to develop olive oil microemulsions and characterize their antioxidant and skin moisturizing properties. The acid, iodine, and saponification values of olive oil were 0.38 ± 0.01 mg potassium hydroxide/g, 88.2 ± 5.9 mg iodine/g, and 192.2 ± 1.4 mg potassium hydroxide/g, respectively. Pseudoternary phase diagrams, constructed using the water titration method, produced suitable microemulsions: microemulsion 1 (10% olive oil, 64% Tween 85, 16% propylene glycol, and 10% water) and microemulsion 2 (10% olive oil, 64% Tween 85, 16% ethanol, and 10% water). Microemulsions 1 and 2 exhibited Newtonian flow behavior with internal droplet sizes of 443.60 ± 27.66 nm and 139.37 ± 12.15 nm, respectively. Their in vitro antioxidant and skin moisturizing properties were investigated in comparison with native olive oil. Microemulsion 2 possessed the highest significant antioxidant effect (p < 0.05) giving half maximal inhibitory concentration values in radical-scavenging activity against 1,1-diphenyl-2-picrylhydrazyl and 2,2′-azino-bis(3-ethylbenzothiazoline-6-sulphonic acid) of 4.78 ± 1.25 mg/mL and 14.85 ± 11.18 mg/mL, respectively. The lipid peroxidation inhibition of microemulsion 2 was comparable to native olive oil, whereas the skin moisturizing effect of microemulsion 1 was comparable to the well-known skin moisturizer, hyaluronic acid. In conclusion, microemulsions enhanced both antioxidant and skin moisturizing effects and were attractive formulations for using as a cosmetic or drug delivery system.
Introduction
Microemulsions (MEs) represent a promising delivery system for pharmaceuticals and cosmeceuticals due to its numerous advantages over the existing conventional formulations. 1,2 There is a growing recognition of their potential benefits in the field of cosmetic sciences in addition to the drug delivery abilities. MEs are widely investigated for preparing personal care products with superior features such as high efficiency, good stability, and improved aesthetic appearance. 3 The key difference between MEs and conventional emulsions is that MEs exhibit excellent thermodynamic stablility, therefore, phase separation is not likely to occur, 4 whereas conventional emulsions exhibit fundamentally thermodynamic unstablility and phase separation could eventually take place. The internal droplet size of MEs is below the wavelength of visible light, leading to an optically transparent appearance. 5,6 The smaller size of MEs results in a deeper skin penetration compared to conventional emulsions. 7 Moreover, MEs can increase the dermal delivery of active compounds by enhancing their solubility, leading to a greater degree of encapsulation compared to other conventional topical formulations such as ointments, creams, gels, and lotions. 1,2 Normally, MEs are quaternary systems composed of oil, water, and surfactant/cosurfactant mixtures. They are spontaneously formed isotropic colloidal systems. 8 Therefore, the methods of preparation are distinctly different, since emulsions require a large input of energy, whereas MEs do not require any input energy, leading to reductions of the relative cost of commercial production. 9
Olive oil is the oil extracted from the fruit of olive tree (Olea europaea). There are several methods to produce olive oil, however, a mechanical process without the use of excessive heat gives the highest quality olive oil which is classified as virgin olive oil. 10 Olive oil has been widely used in several cosmetic products, such as skin and hair care formulations. There are several studies reporting the potent antioxidant activity of olive oil. 11,12 The active compounds responsible for the antioxidant activity, belong to three different classes, including simple phenols, secoiridoids, and lignans. 11 Moreover, olive oil may be used to protect the skin from ultraviolet B in the sunlight based on a study reporting that mice receiving olive oil after UVB exposure showed a significantly lower number of developing tumors per mouse than those in the control group receiving nothing. 13 Therefore, the aims of the present study were to develop MEs from olive oil and characterize their antioxidant activity and skin moisturizing properties for further applications in cosmetics.
Materials and methods
Materials
Extra virgin olive (Olea europaea) oil was purchased from the local market in Chiang Mai, Thailand. Hyarulonic acid, quercetin, gallic acid, trolox (6-hydroxy-2,5,7,8-tetramethylchroman-2-carboxylic acid), 2,2′-Azino-bis(3-ethylbenzothiazoline-6-sulfonic acid) (ABTS), 1,1-diphenyl-2-picrylhydrazyl radical (DPPH), linoleic acid, phenolphthalein test solution (TS), triethanolamine, and carbopol 940 were purchased from Sigma-Aldrich (St Louis, Missouri, USA). Disodium hydrogen phosphate, dipotassium hydrogen phosphate, sodium hydroxide, potassium hydroxide (KOH), potassium iodide (KI), iodobromide, and sodiumthiosulfate, ammonium thiocyanate, and ferrous chloride were purchased from Fisher Chemicals (Loughborough, UK). Hydrochloric acid was analytical reagent (AR) grade and purchased from Merck (Darmstadt, Germany). Ethanol, propan-2-ol, dimethyl sulfoxide, hexane, ethyl acetate, and ether (all AR grade) were purchased from Labscan (Dublin, Ireland). Propylene glycol (PG), polyethylene glycol (PEG) sorbitan monolaurate (Tween 20), PEG sorbitan monopalmitate (Tween 40), PEG sorbitan monostearate (Tween 60), PEG sorbitan monooleate (Tween 80), PEG sorbitan trioleate (Tween 85), and sorbitan monooleate (Span 80) purchased from Acros Organics (Morris Plains, New Jersey, USA). PEG 400, us pharmacopeia (USP), and mineral oil were purchased from Wilhelmshaven, Germany.
Characterization of olive oil
Acid value determination
Acid value of olive oil was determined by the indirect titration method with slight modifications 14 Briefly, 10 g of olive oil was mixed with 50 mL of an ethanol/ether mixture (1:1). The mixture was then shaken until homogeneous. Phenolphthalein TS was added as an indicator in the titration with 0.1 N sodium hydroxide (NaOH). The end point of the titration was indicated at the first permanent pink color which was persisted for at least 10 s. The acid value, which was expressed as the amount of NaOH (in milligrams) necessary to neutralize free fatty acids contained in 1 g of oil, was then calculated. The measurements were done in triplicate.
Iodine value determination
Determination of the iodine value was conducted according to the American Oil Chemists’ Society (AOCS) official method with slight modification. 15 Briefly, 0.2 g of olive oil was dissolved in 10 mL of chloroform and the mixture was shaken until homogenous. Then 25 mL of iodobromide was added, and the reaction was carried out in the dark for 30 min. KI solution (30 ml of KI in 100 mL of water) was then added to stop the reaction. The remaining iodine was titrated using 0.1 N sodium thiosulfate solution. The iodine value which is expressed as grams of halogen (calculated as iodine) absorbed by 100 g of olive oil. The measurements were done in triplicate.
Saponification value determination
The saponification value of olive oil was determined according to the AOCS official method with slight modification. 15 Briefly, 2 g of olive oil was dissolved in 25 mL of alcoholic KOH. After 30 min of reflux with heating from a water bath, the sample was titrated with 0.5 N hydrochloric acid (HCl) using 1 mL of phenolphthalein as an indicator. The end point was indicated at the appearance of an amber yellow color. The saponification value was expressed as milligrams of KOH necessary to neutralize the free acids and saponify the esters present in 1 g of substance. The experiments were done in triplicate.
ME development
Pseudoternary phase diagram construction
Pseudoternary phase diagrams of olive oil were constructed using a slightly modified water titration method. 16 Various nonionic surfactants (Tween 20, Tween 40, Tween 60, Tween 80, Tween 85, or Span 80) were mixed with a cosurfactant (ethanol, propan-2-ol, PG, or PEG-400) at a weight ratio of 1:2, 1:1, 2:1, or 4:1 to obtain surfactant mixture (Smix). The oil and Smix were then mixed at various weight ratios (0:1, 1:9, 2:8, 3:7, 4:6, 5:5, 6:4, 7:3, 8:2, 9:1, and 1:0) and the resulting mixtures were subsequently titrated with water under moderate agitation at room temperature. The samples were classified as MEs when they appeared visually as clear liquids. The different formulations were made in triplicate. The pseudoternary phase diagrams were drawn using OriginPro 8 software. The areas of the ME regions were measured by ImageJ 1.47v software.
Characterization of ME
Photon correlation spectroscopy
Particle size analysis was carried out using photon correlation spectroscopy (Zetasizer® version 5.00, Malvern Instruments Ltd, Malvern, UK). The sizing measurements were carried out at a fixed angle of 173°. The reported results are the mean and standard deviation (SD) of at least 10 measurements on each sample.
Rheology study
Viscosity of the MEs was measured using a Brookfield DVIII rheometer (Brookfield Engineering Laboratories, Stoughton, Massachusetts, USA) fitted with a bob spindle. Brookfield Rheocalc operating software [version 2.8] was used to control the measurement. A sample volume of 70 mL was used. The measurements were performed in triplicate at 25°C.
Antioxidant activity of olive oil and ME
ABTS assay
Olive oil and MEs were tested for ABTS radical cation scavenging activity using the method reported by Fellegrin et al. 17 with slight modification. Briefly, ABTS solution (7 mM) was reacted with potassium persulfate (140 mM) solution and kept in the dark overnight (16 h) to yield a dark colored solution containing radical cation (ABTS+). Prior to use, ABTS+ was diluted with ethanol for an initial absorbance of about 0.500 at 734 nm. After the addition of 1.0 mL of diluted ABTS+ to 10 µL of sample, the absorbance was measured after 6 min of initial mixing. The percentage inhibition was calculated using the following equation:

where S is the absorbance of ABTS+ with sample and C is the absorbance of ABTS+ without sample. The experiment was done in triplicate. Half maximal inhibitory concentration (IC50) was calculated using GraphPad Prism version 2.01 software.
DPPH assay
Olive oil and MEs were tested for radical scavenging activity against stable DPPH using the method reported by Blois 18 with slight modification. Briefly, 20 μL of test sample was mixed with 180 μL of 167 μM DPPH solution. The reaction was carried out in the dark for 30 min at room temperature. Then the absorbance was measured at 520 nm using a DTX-880 multimode detector. % Inhibition was calculated using the following equation:

where PC is the absorbance of 20 μL of acetone and 180 μL of 167 μM DPPH mixture, NC is the absorbance of 200 μL of acetone, S is the absorbance of 20 μL of test sample and 180 μL of 167 μM DPPH mixture, and B is the absorbance of 20 μL of test sample and 180 μL of acetone mixture. The experiment was done in triplicate. IC50 was calculated using GraphPad Prism version 2.01 software.
Inhibition of lipid peroxidation by ferric thiocyanate
Olive oil and MEs were tested for lipid peroxidation inhibition by the ferric thiocyanate using the method reported by Niehius and Samuelson 19 with slight modification. Briefly, 100 μL of test sample was mixed with 1 mL of 25 mM linoeic acid in acetone and 1 mL of 0.1 M phosphate buffer pH 7.0 in the test tube with a cork lid stock. The reaction was allowed to carry out in the dark for 6 h at 60°C. Then a 50 μL aliquot of the mixture was mixed with 3 mL of 75% ethanol, 20 μL of 35% ammonium thiocyanate, and 20 μL of 20 mM ferrous chloride in 3.5% HCl. After vortexing the mixture for 1 min, the absorbance was measured at 500 nm using an ultraviolet–visible spectrophotometer (Shimadzu, japan). % Inhibition was calculated using the following equation:
where B is the absorbance of the combined mixture of 100 μL of acetone, 1 mL of 25 mM linoleic acid in acetone, and 1 mL of 0.1 M phosphate buffer pH 7.0 and S is the absorbance of the combined mixture of 1 mL of 25 mM linoleic acid in acetone, and 1 mL of 0.1 M phosphate buffer pH 7.0 and 100 μL of test sample. The experiment was done in triplicate.
In vitro skin moisturizing test of olive oil and ME
Skin preparation
Full-thickness skin from the flank area of stillborn piglets was used for skin moisturizing studies. Stillborn piglets were obtained fresh from a local farm. The hair was trimmed off with electrical clippers and the skin pieces from the flank area were carefully dissected with a surgical blade. After washing in phosphate buffer solution (PBS; pH 7.4), the skin was wrapped in tin foil and stored at −20°C for up to 1 month. 20 Prior to use in studies, skin was defrosted and hydrated in PBS overnight at room temperature. Before experimentation, the subcutaneous fat layer was carefully trimmed off and the skin was cut into a square shape (2 × 2 cm2) using surgical scissors.
In vitro skin moisturizing test
The skin hydration was measured using a Corneometer© CM 825 (Courage-Khazaka Electronic, Cologne, Germany). A baseline measurement was performed before applying 100 µL of olive oil or MEs followed by three additional measurements at 30, 60, and 120 min after application. Three pieces of skin were used for each measurement. DI water was used as a negative control and 1% hyaluronic acid solution was used as a positive control. Skin moisturizing efficacy (%) was calculated using the formula:

where At is skin capacitance at a specified time and A0 is skin capacitance at the baseline. This method was modified from O’Goshi et al. 21
Statistical analysis
All data were presented as the mean ± SD. Individual differences were evaluated by one-way analysis of variance: post hoc test. In all cases, p < 0.05 indicated significance.
Results and discussion
Olive oil characteristics
The characteristic of olive oil as the function of acid value, iodine value, and saponification value are shown in Table 1.
Characteristics of olive oil (mean ± SD, n = 3).

KOH: potassium hydroxide; I2: iodine.
The acid value can be used to indicate the oil quality and a low acid value indicates the oxidative stability of the oil. However, the acid value also depends on the type of oil and the storage conditions as the acid value will increase over longer times of storage. 23 Since the acid value is twice that of the free fatty acid, it could be used to determine triglyceride hydrolysis, which is often related to the quality of oil against oxidative reaction. 23 Therefore, olive oil with a low acid value and a low free fatty acid value would be stable against oxidation and not easily become rancid. 24
The iodine value represents the number of reactive double bonds in the oil. The iodine value of oleic acid, an unsaturated free fatty acid containing one double bond, is 90 while that of linoleic, an unsaturated free fatty acid containing two double bonds, is 282. The low iodine value of olive oil places it in the nondrying oil group which is oil that does not solidify when exposed as a thin film to air. 25 Normally, nondrying oils contain only small amount of either linoleic acid that possess three double bonds in one molecule or linoleic acid that possess two double bonds. 26 Therefore, the oxidative cleavage of unsaturated bond decrease and the oxidation slows down. The results related well with the previous study reported that olive oil contained 64.4–81.0% unsaturated free fatty acid containing one double bond, 12.6–19.7% unsaturated free fatty acid containing two double bonds, and 6.0–15.9% unsaturated free fatty acid containing several double bonds. 27 Oleic acid was the major component (62.0–80.0%) found in the oil. 28
High saponification value represents high ester content or a high number of carboxylic functional groups per unit mass of olive oil. The results suggested that olive was suitable for self-emulsification process and ME formation. 28
ME development
The effect of surfactant type was studied using various surfactants, including Tween 20, Tween 40, Tween 60, Tween 80, Tween 85, and Span 80. When the cosurfactant was PG and the Smix ratio was 2:1, only Tween 85 could produce an ME region in the pseudoternary phase diagram (Figure 1(a)). These results were in a good agreement with a previous study reporting that Tween 85 showed an excellent ability to produce ME among several surfactants. 29 However, the type of oil phase affected the ability of Tween 85 to produce the ME. A previous study reported that Tween 85 could produce a small ME region in the psuedoternary phase diagram of ME containing an essential oil. 16 The likely explanation was that there was no universal good surfactant that is suitable for all types of oil in ME development. For olive oil, Tween 85 was a suitable surfactant since it could produce the largest ME region in the pseudoternary phase diagram. The effect of cosurfactant type was also studied. Ethanol produced the highest ME region followed by PG and isopropanol, whereas PEG-400 could not produce any ME (Figure 1). PG and ethanol gave a good promising ME region. Therefore, the effect of Smix ratio was studied in the system containing these two cosurfactants. When the Smix ratio increased from 1:2 to 4:1, the ME region was significantly increased (Figures 2 and 3). The results related well with the previous study of Gao et al. 22 who reported that the polyoxyethylated castor oil ME region respectively increased when the ratio of polyethylene glycol (35) castor oil to transcutol increased from 0.5:1 to 4:1. Similarly, Chaiyana et al. 16 reported that the ME region increased when the ratio of Tween 20 to PEG-400 increased from 1:2 to 4:1. Additionally, Kale and Allen 30 reported that an increase in the Smix ratio could increase ME formation of mineral oil using a surfactant of Brij 96 and a cosurfactant of glycerin, ethylene glycol, or PG.

Pseudoternary phase diagram of olive oil/Tween 85 and cosurfactant (2:1)/water, when the cosurfactant was (a) PG, (b) ethanol, (c) isopropanol, and (d) PEG-400. The dark area represents the ME region. PG: propylene glycol; PEG: polyethylene glycol; ME: microemulsion.

Pseudoternary phase diagram of olive oil/Tween 85/PG/water when the Smix ratios were (a) 1:2, (b) 1:1, (c) 2:1, and (d) 4:1. The dark area represents the ME region. PG: propylene glycol; ME: microemulsion.

Pseudoternary phase diagram of olive oil/Tween 85/ethanol/water when the Smix ratios were (a) 1:2, (b) 1:1, (c) 2:1, and (d) 4:1. The dark area represents the ME region. ME: microemulsion.
Two MEs from the systems in Figures 2(d) and 3(d) were formulated and named as ME1 and ME2, respectively. ME1 contained 10% olive oil, 64% Tween 85, 16% PG, and 10% water, whereas ME2 contained 10% olive oil, 64% Tween 85, 16% ethanol, and 10% water. Both MEs were transparent isotropic yellow liquids. The internal droplet size of ME1 was larger than that of ME2 and both of them showed moderate polydisperse index as shown in Table 2. Furthermore, ME1 and ME2 both showed Newtonian flow behavior with low viscosity (Table 1) confirming the formation of MEs. 31,32 The likely explanation of the elevated viscosity of ME1 was from the larger internal droplet size.
Characterization of MEs (mean ± SD, n = 3).

ME: microemulsion.
Antioxidant activity
The antioxidant activity of olive oil, ME1, and ME2 was analyzed by means of the DPPH, ABTS, and lipid peroxidation assays. Several methods were used since it is recommended to base the conclusions of antioxidant activity on at least two different test methods and the antioxidant activity is dependent on the method used. 33 DPPH and ABTS assay are test systems using a stable free radical to give information on the radical scavenging or antiradical activity, 34 whereas the lipid peroxidation assay is the most studied biologically relevant free radical chain reaction that gives information on antioxidant activity. 35 The IC50 calculated from the concentration curve versus free radical scavenging activity against DPPH and ABTS radicals of olive oil, ME1, and ME2 is presented in Table 3. Both ME1 and ME2 increase the antioxidant activities of the native oil because of the higher solubilizing power and the larger surface area of the ME droplets. It is noted that ME2 exhibited the highest radical scavenging activity as it showed the significantly lowest IC50 value against DPPH and ABTS radicals (p < 0.05). However, the lipid peroxidation inhibition of ME2 was not different from the native olive oil. The likely explanation of the distinctly superior antioxidant activities of ME2 was its lower viscosity and smaller internal droplet size led to an increase in surface area and subsequently an increase in intimate contact between ME droplet and the target site. These factors promoted better efficacy in antioxidant activity.
Antioxidant activity of olive oil and MEs (mean ± SD, n = 3).

IC50: half maximal inhibitory concentration; DPPH: 1,1-diphenyl-2-picrylhydrazyl radical; ABTS: 2,2′-azino-bis(3-ethylbenzothiazoline-6-sulfonic acid); ME: microemulsion.
a% Inhibition at the concentration of 5 mg/mL.
*p < 0.05: compared to olive oil.
Skin moisturizing property
The relative skin hydration at 30, 60, and 120 min after applying 1% hyaluronic acid solution, olive oil, ME1, and ME2 is shown in Figure 4. ME1 possessed a significantly higher skin moisturizing effect comparing to a native olive oil (p < 0.05), whereas ME2 showed almost the same results as the olive oil. Interestingly, the skin moisturizing effect of ME1 was comparable to the hyaluronic acid. The likely explanation was that the ME1 contain PG which acts as a humectant. However, the ME of olive oil was less expensive than the hyaluronic acid solutions, therefore, it could be used as an alternative choice in cosmetic preparation.
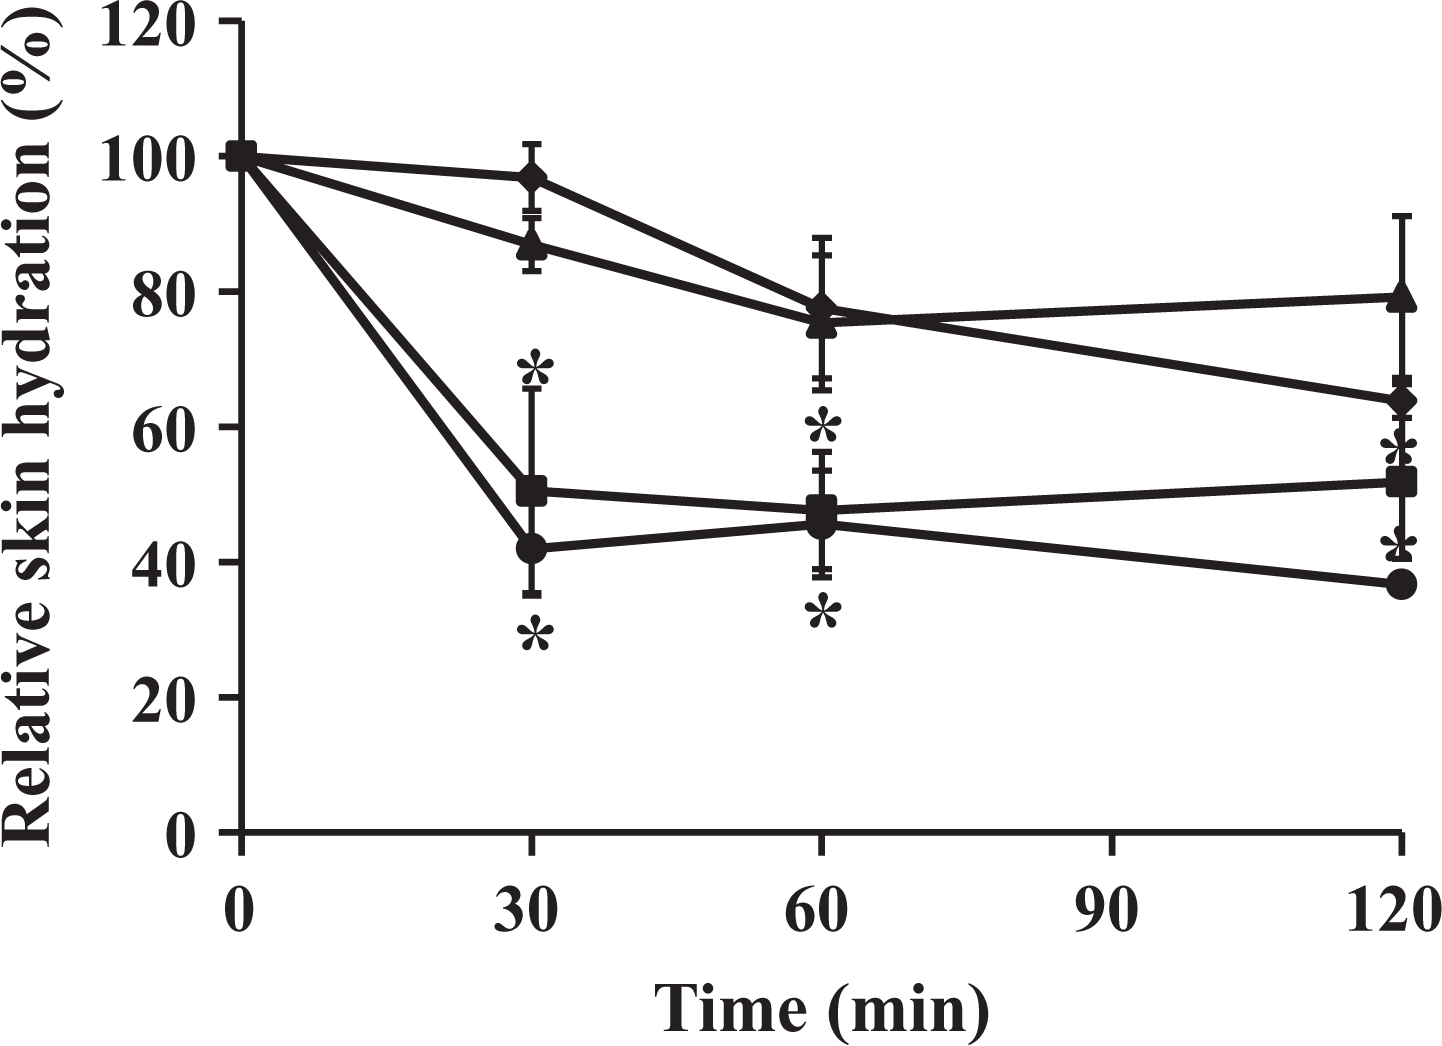
Relative skin hydration after applying with 1% hyaluronic acid solution (▴), olive oil (•), ME1 (♦), and ME2 (▪) for 30, 60, and 120 min. *p < 0.05: compared to 1% hyaluronic acid solution.
Tween 85, a major component of the formulation, is not thought to produce adverse health effects or skin irritation. Bicontinuous MEs containing Tween 85 were reported as a safe vehicle for topical drug delivery. 36 However, it may cause skin irritation after prolonged or repeated exposure. Therefore, the skin irritation tests in human subjects are necessary and need further study.
Conclusion
Olive oil used in the present study met the standard criteria of acid, iodine, and saponification values which were 0.38 ± 0.01 mg KOH/g, 88.2 ± 5.9 mg iodine/g, and 192.2 ± 1.4 mg KOH/g, respectively. Two MEs including ME1 (10% olive oil, 64% Tween 85, 16% PG, and 10% water) and ME2 (10% olive oil, 64% Tween 85, 16% ethanol, and 10% water) were developed and characterized. The larger internal droplet size of ME1 was correlated well with its higher viscosity. The internal droplet size of ME1 and ME2 was 443.60 ± 27.66 and 139.37 ± 12.15 nm, respectively. Besides, the viscosity of ME1 and ME2 was 1.95 ± 0.03 and 0.11 ± 0.00 mPas, respectively. Comparing to the native olive oil, ME2 possessed the significant highest antioxidant activity (p < 0.05) with IC50 of radical scavenging activity against DPPH and ABTS radicals of 4.78 ± 1.25 mg/mL and 14.85 ± 11.18 mg/mL, respectively. Therefore, the olive oil ME significantly possessed higher antioxidant and skin moisturizing effect than the native olive oil. However, an effect on their biological activities depended on the composition of MEs. The lipid peroxidation inhibition of ME2 was comparable to that of native olive oil. On the other hand, ME1 possessed high skin moisturizing effect which was comparable to the hyaluronic acid. Therefore, it could be concluded that olive oil ME is an attractive formulation in the cosmetic development studies and could be used as a delivery system for cosmetics ingredients or biological active compouds. The skin irritation and moisturizing test in human subjects are suggested for further study. Moreover, permeability evaluation of the olive oil MEs which is a major consideration in drug delivery system is also recommended for further work.
Footnotes
Acknowledgement
We thank Dr Karl Bailey, Scientific Officer, Department of Human Nutrition, University of Otago for improving the use of English in the manuscript.
Declaration of conflicting interests
The author(s) declared no potential conflicts of interest with respect to the research, authorship, and/or publication of this article.
Funding
The author(s) disclosed receipt of the following financial support for the research, authorship, and/or publication of this article: The financial support was received from Chiang Mai University grant for new researchers.