
Abstract
As Artificial Intelligence (AI) systems and data-driven tools become integral to governmental decision-making, the ability to interpret and reason with visual information emerges as a critical competence for operating effectively in AI-mediated analytical environments. However, empirical evidence on the level of data visualization literacy within public administrations remains limited. To address this gap, the study provides a large-scale, diagnostic, and descriptive analysis of Data Visualization Literacy (DVL) performance in a real public organizational setting, using a standardized assessment instrument. A cross-sectional survey of 1,219 public employees was conducted using a bilingual Spanish–Valencian adaptation of the Mini-VLAT (12 items; 25 seconds per item), evaluating participants’ capacity to interpret, analyze, and reason with graphical representations of data. Mean performance reached 57.8% correct, with 27.1% omissions and 15.1% errors. Tasks involving proportional or relational reasoning—particularly stacked charts—produced the lowest accuracy and the highest nonresponse. Performance patterns were consistent: accuracy declined with age, improved with higher educational attainment, and varied across departments. Omissions under time pressure, rather than misinterpretation, were the predominant source of error. The findings underscore the importance of treating DVL as part of the institutional infrastructure, through periodic diagnostics, shared graphic-interoperability standards, targeted domain training under time constraints, and longitudinal monitoring to preserve epistemic control while harnessing AI’s speed and scale.
Keywords
1. Introduction
In an information ecosystem increasingly mediated by data, the ability to correctly interpret visualizations has become indispensable for civic engagement, evidence-based decision-making, and participation in public debates. This competence, known as Data Visualization Literacy (DVL), has been defined as “the ability and skill to read and interpret visually represented data and extract information from them”. 1 Similarly, it can be understood as the capacity to skillfully use data visualizations to formulate visual queries based on analytical questions and, in turn, interpret graphic patterns as meaningful expressions of the represented phenomenon. 2 As visualizations become ubiquitous tools across media, science, business, education, and social networks, their accurate interpretation is no longer an optional technical skill but an essential form of literacy for the twenty-first century.
The proliferation of data visualization technologies has highlighted that many individuals still lack the skills needed to decode even basic representations and that this difficulty increases drastically with complex or interactive visualizations. These limitations not only reduce the effectiveness of data communication itself but also heighten vulnerability to visual manipulation, cognitive biases, and misinformation. 3 This challenge is intensified by the increasingly common contexts of visual misinformation and information overload—phenomena that have been described as part of a contemporary infodemic—in which literacy in graphical data becomes a crucial competence for distinguishing between legitimate and misleading representations. 4
Moreover, DVL cannot be detached from recent sociotechnical changes. The widespread development and accessibility of interactive technologies (from visualizations embedded in digital media to personalized dashboards in professional contexts) have expanded both the reach and scope of visual data representations. However, as explored by Costello, 5 this expansion has not necessarily been accompanied by an adequate understanding of the principles underlying visual interpretation, often giving rise to what could be described as an illusion of graphical comprehension.
Over the past decade, several formal instruments have been developed to assess DVL, such as the Visualization Literacy Assessment Test (VLAT), 1 the Critical Thinking Assessment for Literacy in Visualizations (CALVI) 6 —including their adaptive versions 7 —and the abbreviated Mini-VLAT. 8 Nevertheless, significant gaps remain. Creamer et al. 9 highlight that current definitions of DVL are conceptually fragmented, that existing assessments tend to focus on high-level tasks without decomposing the underlying cognitive processes, and that population diversity in related studies remains limited. Specifically, although DVL has been extensively studied among university students,10–12 knowledge of data visualization skills in public and private organizations and among individual professionals remains limited, despite its importance for artificial intelligence (AI) adoption. This paper contributes to addressing this gap by presenting a large-scale, diagnostic, and descriptive analysis of DVL performance in a real, public organizational setting. The lack of empirical evidence on DVL levels in public administrations and its relevance for AI adoption motivates the diagnostic character of this study.
The deployment of AI systems in organizational environments, both public and private, has further accelerated the integration of visual interfaces into analytical and decision-making processes. Examples include automatically generated charts from AI-based analytics systems, predictive visualizations, and explainability dashboards. 13 In this sense, DVL represents the cognitive link between algorithmic models and human decisions. Assessing this competence is key to evaluating the cognitive readiness of public institutions for AI adoption and to guiding training and visual design strategies that strengthen explainability and trust in intelligent governmental systems.
Within this framework, the present study analyzes the level of DVL competence in a sample of 1,219 public employees from a Spanish regional administration, using a bilingual (Spanish–Valencian) and context-adapted version of the Mini-VLAT (12 items; 25 seconds per item). The resulting diagnosis provides a measure of the current cognitive capacity of public sector staff to interpret visual outputs derived from AI systems increasingly embedded in institutional decision-making processes, and it supports action lines aimed at fostering a more effective, transparent, and accountable public administration. By examining how public-sector employees interpret and reason with visual data, the study provides empirical evidence on current DVL levels, situating its findings within the broader context of the growing adoption of analytical and AI-based systems, without assuming or modeling causal relationships between DVL and AI adoption.
The remainder of the article is structured as follows. Section 2 develops the theoretical framework and reviews instruments for assessing DVL, with attention to AI-mediated visualization. Section 3 details the study design, the bilingual adaptation of the Mini-VLAT, the digital administration, variables, and statistical procedures. Section 4 reports the results, overall performance and stratified analyses, including Tukey HSD tests. Section 5 discusses implications for AI adoption in public administration and offers concluding remarks.
2. Theoretical framework
DVL has emerged as an interdisciplinary construct situated at the intersection of information visualization, education, cognitive psychology, and corporate analytics. Although conceptually rooted in broader discussions of information and statistical literacy, its specific formulation responds to the growing need to interpret visual data within contemporary digital contexts.
2.1. From visual literacy to data visualization literacy
Visual literacy has traditionally been defined as the ability to interpret, evaluate, and produce visual messages, 14 grounded in semiotics and a general understanding of visual language. 15 This framework has predominated in fields such as art education, visual communication, and media studies. However, it has proven insufficient to address the cognitive and technical challenges posed by data visualizations, prompting the development of more specialized models.
DVL differs from visual literacy in at least two essential aspects. First, it focuses specifically on data visualizations; second, it requires not only visual interpretation but also an understanding of statistical structures, graphical encodings, and informational contexts. In this sense, Boy et al. 2 introduce and define DVL as a distinct competence from visual literacy. While visual literacy concerns the general interpretation of images or symbols, DVL emphasizes the graphical encoding of structured data and its use in analytical reasoning. Moreover, from a complementary perspective, Börner et al. 16 propose that this literacy involves both the interpretation and production of visualizations, in a relationship analogous to reading and writing. This dual competence highlights the expressive as well as the interpretative dimensions of visualization literacy.
Extending beyond individual skills, Hedayati et al. 17 suggest a three-dimensional structure encompassing specific cognitive abilities, inferential reading and analysis processes, and situate practices of visualization use in real contexts. This approach broadens functionalist conceptions of the construct. Similarly, Firat 18 recommends a hierarchical model ranging from basic perceptual decoding to higher levels of critical inference, consistent with perspectives such as those of Locoro et al. 19 These authors argue that visualization literacy cannot be reduced to a set of isolated technical skills; it must also encompass advanced reasoning models, contextual applications, cognitive structures, and developmental trajectories.
The distinction between DVL and related constructs such as data literacy or information literacy also warrants clarification. While these literacies partially overlap in practices and objectives, DVL specifically focuses on graphical encoding as a transversal competence. It intersects with statistical and digital literacy yet retains a distinct epistemology and pedagogy. As Raffaghelli 20 notes, it should be accompanied by specific educational frameworks that promote graphical reading and its critical and ethical comprehension.
Recently, the construct of visual encoding ability has also emerged, defined as the capacity to select optimal visual encodings when designing representations, thus extending beyond interpretation alone. Ge et al. 21 introduce AVEC, the first psychometrically validated test assessing this specific skill. Integrating this concept completes the “reading–building” continuum required by contemporary educational frameworks.
2.2. Assessing data visualization literacy
Assessing DVL entails designing instruments or methods capable of reliably measuring the extent to which individuals can interpret, use, and, in some cases, critically evaluate data visualizations.
One of the pioneering tools in this domain is the Graph Literacy Scale by Galesic and García-Retamero, 22 designed to measure comprehension of statistical graphs in health-related contexts. Although psychometrically robust, its functional focus limits it to simple data extraction tasks, without capturing inferential dimensions. As a complementary tool, the Subjective Graph Literacy Scale (SGL) by García-Retamero et al. 23 is a brief five-item self-report completed in under one minute. It exhibits high reliability, convergent validity with the objective scale, and predictive accuracy in risk interpretation tasks, while reducing respondent anxiety. It is considered complementary rather than independent.
A seminal contribution is offered by Boy et al., 2 who present a set of visualization literacy tasks using standard chart types (lines, bars, scatterplots) and establish methodological foundations for their validation through Item Response Theory (IRT). Their work introduces a key distinction between perceptual efficiency in design and genuine comprehension by users, showing that apparently clear visualizations may induce only superficial understanding. Factors such as stimulus complexity, congruence between question and chart, and distractor presence are also incorporated, and their significant impact on performance acknowledged.
This approach inaugurates a more rigorous, sensitive, and adaptive tradition of assessment, subsequently extended by Lee et al., 1 Ge et al., 6 and Cui et al. 7 While Boy et al.’s 2 proposal is conceptually seminal, it should not be regarded as a standardized test per se, as it is an experimentally grounded preliminary framework with limited items and partial psychometric validation.
A major step toward standardization is the development of the Visualization Literacy Assessment Test (VLAT). 1 VLAT comprises 53 items derived from a cross-matrix of 12 chart types and 8 cognitive tasks, validated using three-parameter logistic IRT models. It remains the first psychometrically validated instrument to assess visualization competence across diverse contexts.
The 21-item preliminary scale developed by Locoro et al. 19 offers a complementary formalization of visual information literacy, grounded in theoretical review and cognitive interviews. Their study employs Rasch analysis to examine construct dimensionality and psychometric properties, focusing on structural validity. Although not a fully standardized or widely applied instrument, it contributes to theoretical consolidation and the precise definition of evaluable dimensions.
The Mini-VLAT, introduced by Pandey and Ottley, 8 is a 12-item short form of VLAT, that, demonstrating highly correlation with the original test, shows acceptable reliability (ω = 0.72). Despite covering fewer chart types and cognitive operations, it has been widely used in large-scale studies.
CALVI (Critical Thinking Assessment for Literacy in Visualizations), designed by Ge et al., 6 is an innovative approach that focuses on users’ analytical ability to identify misleading visualizations through subtle manipulations of scales, proportions, encodings, or labels. This orientation toward critical literacy aligns with growing concerns regarding visual misinformation.
Building on CALVI and VLAT, Cui et al. 7 introduce adaptive computerized versions (A-VLAT and A-CALVI) using algorithms that dynamically adjust item difficulty and reduce test length without compromising reliability—representing a notable methodological advance combining psychometric precision with operational efficiency. In contrast, MAVIL offers a multidimensional evaluation framework integrating factors such as aesthetic perception, familiarity with graphical components, visual criticality, and contextual numeracy—offering a holistic approach, though still empirically limited in application. 24
A more experimental line combines traditional assessment with neurophysiological techniques. Yim et al. 25 employ the VLAT within an electroencephalography (EEG) study to estimate participants’ cognitive load during visualization tasks. Their convolutional neural network model reveals that physiological metrics capture cognitive effort not reflected by classical indices such as item difficulty or response time. However, as it relies on existing VLAT items, this approach does not constitute an independent test.
From a different perspective, Rodrigues et al. 26 assess not participants’ answers but the questions they formulate when interacting with visualizations. This inductive strategy provides insights into underlying cognitive frameworks and reasoning processes.
Despite these advances, several limitations persist. Samples often remain homogeneous (frequently recruited via platforms such as MTurk or Prolific) and connections between assessment and pedagogy are weak. Moreover, Cabouat et al. 27 question the assumed neutrality of the graphics used in testing, arguing that legibility and perceptual complexity may influence results. Consequently, graphical design itself should be treated as an evaluative variable, not merely a neutral medium.
2.3. Visual production in the era of generative artificial intelligence
The advent of Generative Artificial Intelligence (GenAI) has structurally transformed the creation, communication, and comprehension of visual data. In visualization, this represents an evolution from rule-based algorithmic approaches toward models capable of generating, adapting, and evaluating visualizations from data and linguistic descriptions, learning from examples rather than explicit encoding principles. This shift redefines visualization production from manual programming of charts to automated, context-aware generation mediated by large language–vision models (LLMs and VLMs).
Technically, AI-assisted visual production operates through four main stages
28
: (1) data enhancement, where generative methods complete, synthesize, or disaggregate information; (2) automatic visual mapping, in which models produce graphical specifications from natural-language queries; (3) stylization, adapting visual appearance to aesthetic or communicative criteria; and (4) interaction, introducing conversational and visual interfaces that dynamically adjust or explain visualizations.
These stages mark the transition from visualization as a static product to visualization as an adaptive, multimodal process in which users interact with machines through both natural language and graphical elements.
Recent advances in VLMs (such as GPT-4o, Gemini, and ChartGemma) enable not only code generation but also interpretation and reasoning of charts. Dong and Crisan 29 demonstrate that these models perform chart question-answering while exhibiting spatial and semantic reasoning, approaching human visual literacy. GenAI thus internalizes cognitive rules of visual interpretation, expanding beyond mere production capabilities.
Experimental tools such as ChartGPT and VisEval illustrate the ability of LLMs to transform natural-language descriptions into executable visualizations, achieving higher accuracy than traditional NL2VIS (Natural Language to Visualization) methods.30,31 However, these systems still face challenges related to attribute ambiguity, syntactic errors in generated specifications, and issues of legibility and visual coherence. Automation does not inherently guarantee perceptual quality or communicative adequacy.
Epistemologically, generative visual production blurs the boundary between reading and authorship. As Li 32 argues, designers and analysts are shifting from technical executors to curators of the dialogue between model and data, where creativity lies in formulating precise prompts, evaluating outputs, and adjusting styles. Consequently, visual competence evolves into an augmented literacy, combining traditional graphic reading skills with the ability to guide generative models, verify their validity, and contextualize their outputs. DVL thus becomes both interpretive and metacognitive; the ability to read and to instruct a generative intelligence.
Recent studies confirm that integrating visualization and GenAI improves decision-making processes. Neri et al. 33 show that AI-assisted decision environments incorporating generative dashboards or conversational visual agents enhance comprehension and reduce cognitive load, particularly when adapted to users’ cognitive styles and supported by explanatory functions. In public administration, AI-generated visualizations may increasingly act as cognitive mediators, translating algorithmic reasoning into representations understandable to decision-makers and analysts, thereby strengthening trust in automated management and decision processes. Nevertheless, research on human–AI collaboration in visual narrative reveals that users favor balanced co-production over full automation, valuing interpretive control and transparency in generative processes. 34
Finally, the rise of generative visual production poses significant ethical and epistemological challenges. Scholars emphasize the urgent need for regulatory frameworks ensuring transparency, traceability, and fairness in AI-generated visualizations, particularly when used in governance or accountability contexts. 35
3. Methodology
3.1. Design and participants
A cross-sectional observational study was conducted using an online survey administered to employees of the Valencian regional government (Generalitat Valenciana), with a total of 1,219 responses collected from all regional departments (conselleries). Participation was voluntary and anonymous, and informed consent was presented on the first screen. Data were processed in compliance with Regulation (EU) 2016/679 (General Data Protection Regulation; GDPR) and national data-protection law, and no personal identifiers were recorded. The questionnaire and procedures were reviewed by an ethics committee to ensure scientific integrity and data confidentiality. A favorable report was obtained from the Human Research Ethics Committee of our University.
Collected variables included year of birth, gender, highest educational attainment, civil service level, employing department (conselleria), self-reported familiarity with visualizations, and declared color-vision deficiency. All items allowed a “prefer not to answer” option. Stratifications for analysis were derived from age, educational attainment, civil service level, and department.
3.2. Instrument
3.2.1. Conceptual basis
A bilingual (Spanish–Valencian) adaptation of the Mini-VLAT, the abbreviated and psychometrically validated version of the Visualization Literacy Assessment Test (VLAT), was implemented. The instrument comprises 12 multiple-choice items (one correct answer plus an “I don’t know” option), assessing the ability to read and interpret canonical visualizations and perform basic graphical inferences.
3.2.2. Adaptation process
Items were forward-translated into Spanish and Valencian, ensuring semantic and functional equivalence. Culture-specific references were replaced with neutral, local alternatives (e.g., a map of Spain by province instead of the US by state).
3.3. Digital administration environment
The questionnaire was implemented in LimeSurvey (institutional license) and distributed via corporate email. The interface includes an initial instruction screen specifying the per-item time limit, the diagnostic purpose of the test, and the anonymity of participation, as well as a block of socio-demographic and work-related questions. Respondents completed the 12 Mini-VLAT items, each with a maximum of 25 seconds, and automatic progression to the next item occurred when the time limit expired. The system automatically recorded response time, selected option, and omissions after the time limit; thus making the time limit a structural element of the research design.
3.4. Variables, coding, and analysis
The primary outcome is each participant’s “percent correct”, computed as the proportion of correct responses out of 12 items. Complementary indicators are “percent incorrect” and “percent omitted”, computed at both the individual and item levels to examine response patterns and relative item difficulty.
Records with irregular connection times were excluded. A minimum participation threshold of ≥2 answered items (out of 12) was set to preserve the validity of comparisons; records below this threshold were treated as early withdrawals or invalid sessions. Nonresponses, whether due to time expiration or explicit selection of the “No response” option, were coded as omissions. Because each item was administered under a fixed 25-second limit, omissions and accuracy should be interpreted as performance under temporal constraint rather than as untimed visualization competence per se.
Data analysis relies on one-way analysis of variance (ANOVA), applied separately to each key categorical variable. A complete-case approach is applied, including only participants with valid data for both the stratifying variable and the Mini-VLAT score in each contrast. As several socio-demographic questions were optional, effective sample sizes vary across analyses.
Given the diagnostic and exploratory purpose of the study, this approach is intended to provide a transparent descriptive map of group differences across institutional strata rather than to estimate mutually adjusted effects. Accordingly, the reported contrasts should be interpreted as bivariate patterns that may reflect correlated socio-demographic and organizational factors; future work is needed to model interactions and potential confounding explicitly. When the omnibus ANOVA test is significant, post-hoc multiple comparisons (Tukey’s HSD) are used to identify pairs of groups with statistically significant differences. Homoscedasticity and normality of residuals were assessed prior to inference, confirming the suitability of ANOVA tests given their robustness to mild deviations in large samples. Statistical significance was set at
For graphical reporting, heatmaps are produced to display significant differences from post-hoc contrasts, using a diverging color scale (blue for higher performance, red for lower), with intensity proportional to the difference in percentage points of correct responses (pp).
4. Results
4.1. Overall performance and item difficulty pattern
Item-level results, visualization type, and response format in the adapted Mini-VLAT.

Source: Compiled by the authors.
Accuracy levels vary substantially depending on cognitive task type and graphical format. A clear asymmetry emerges between the reading of explicit magnitudes and proportional inference (see Table 1). Items focused on literal reading or point-value extraction (Q8, Q9, and Q4) yield the highest accuracy rates (81.79%, 77.19%, and 72.60%, respectively), showing strong competence in direct value identification. In contrast, items requiring proportional comparison or relational reasoning (Q7 and Q11, both stacked charts) exhibit extremely low accuracy (5.17% and 16.98%) and high omission rates (53.16% and 66.12%).
4.2. Performance distribution by structural variables
Performance on the Mini-VLAT reveals a stable architecture of differences structured along three axes: educational attainment, occupational level, and practical experience with visualizations. Additionally, departmental heterogeneity reflects differentiated data-use cultures, and the balance between errors and omissions provides diagnostic insight in itself. Across all main comparisons (age, education, administrative level, and department), one-way ANOVA tests are significant (p < 0.05), and Tukey HSD post-hoc tests confirm the expected gaps.
4.2.1 Age group
Mean accuracy scores by age group.
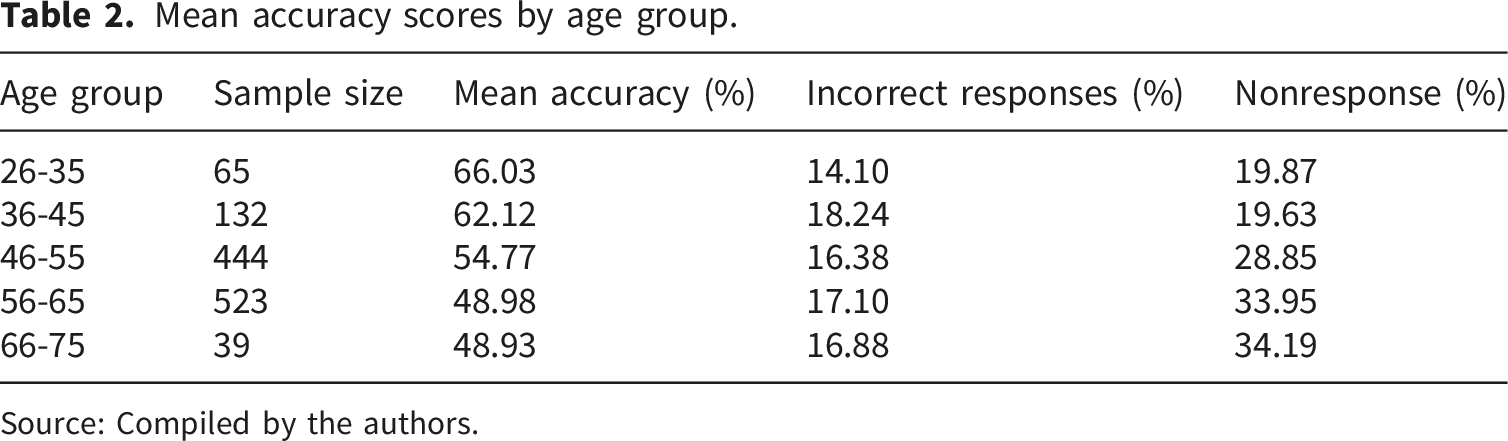
Source: Compiled by the authors.
These results contrast with recent comparative studies in which tasks have no time limit and similar accuracy is observed across age groups, thus underscoring the relevance of the time limit in our research design. In a task comprising ten low-level analysis tasks and five basic visualizations, While and Sarvghad 36 find that, although accuracy levels were similar, adults aged 60+ required, on average, more time than younger adults to complete visual tasks, particularly those involving distributions and correlations. Similarly, Felberbaum et al. 37 report that even among individuals aged 70–85, accuracy in visual reading and inference tasks equals or exceeds that of younger adults (20–40), although response times are significantly longer.
In the context of the Mini-VLAT, where each item has a strict 25-second limit, this temporal asymmetry is critical. Older participants may not have sufficient time to apply slower yet systematic processing strategies. The elevated omission rate, rather than error rate, should therefore be interpreted as the combined effect of slower visual exploration and a time restriction that penalizes such cognitive latency, rather than as a genuine deficit in literacy.
The one-way ANOVA on accuracy across age groups is significant ( Significant differences across age groups (Tukey HSD post-hoc tests). Mean differences in accuracy rates (percentage points); color intensity (with blue for higher performance and red for lower) encodes effect size and direction.
However, this gradient should not be attributed solely to educational background. It reflects the interaction between cohort and cognitive pacing effects. Individuals who entered digital visual culture later in life may retain strong interpretative skills but operate with different temporal economies. In rapid-response assessments such as the Mini-VLAT, these slower, more deliberate strategies are disproportionately penalized.
4.2.2 Education attainment
Mean accuracy scores by education attainment.

Source: Compiled by the authors.
The one-way ANOVA by education level is also significant ( Significant differences across education levels (Tukey HSD post-hoc test), with acronyms in Table 3. Mean differences in accuracy rates (percentage points); color intensity (with blue for higher performance and red for lower) encodes effect size and direction.
This educational gradient aligns with large-scale evidence on quantitative literacy. In a cross-national analysis of more than 20 education systems, Park and Kyei 38 show that educational attainment is the most consistent predictor of adults’ ability to understand and use numerical and graphical information. Specifically, based on microdata from the Adult Literacy and Life Skills Survey and the International Adult Literacy Survey, they find that gaps between higher-education graduates and those without secondary education reach several tens of percentage points, even after controlling for socioeconomic factors.
4.2.3 Administrative level
Administrative levels reflect the hierarchical structure of the regional civil service. Levels A1 and A2 correspond to higher-qualification, higher-responsibility tasks (technical–managerial functions), while C1 and C2 correspond to roles with lower responsibilities and primarily administrative support functions. Education access thresholds, established by national legislation, determine entry to the different levels. 39 Using the education-level nomenclature introduced above, A1 and A2 require ≥ E6; C1 requires at least E3; C2 requires a minimum of E2, with E1 falling below the entry threshold.
Mean accuracy scores by administrative level.

Source: Compiled by the authors.
The one-way ANOVA by level is significant ( Significant differences across administrative levels (Tukey HSD post-hoc test), with acronyms in Table 4. Mean differences in accuracy rates (percentage points); color intensity (with blue for higher performance and red for lower) encodes effect size and direction.
These results can be interpreted within the framework of organizational data literacy. As Ongena 40 conceptualizes, data literacy operates as a third-order competence encompassing five domains—identification, comprehension, use, communication, and reflexivity—whose main effects manifest in organizational performance (efficiency, effectiveness, and equity).
Accordingly, these differences reflect varying levels of organizational data maturity. Higher-ranking bodies (A1/A2), with greater decision-making responsibility and exposure to analytical environments, emphasize data understanding and data communication. Intermediate and support groups (C1/C2) exhibit a more instrumental and reactive use of data. Self-reported familiarity with visualizations supports this pattern: participants who had previously created visualizations (n = 97) achieved a mean accuracy of 61.86%, compared with 54.28% among those somewhat familiar (n = 384) and 51.91% among those with no prior experience (n = 97).
4.2.4 Departmental domain
Mean accuracy scores by administrative department.
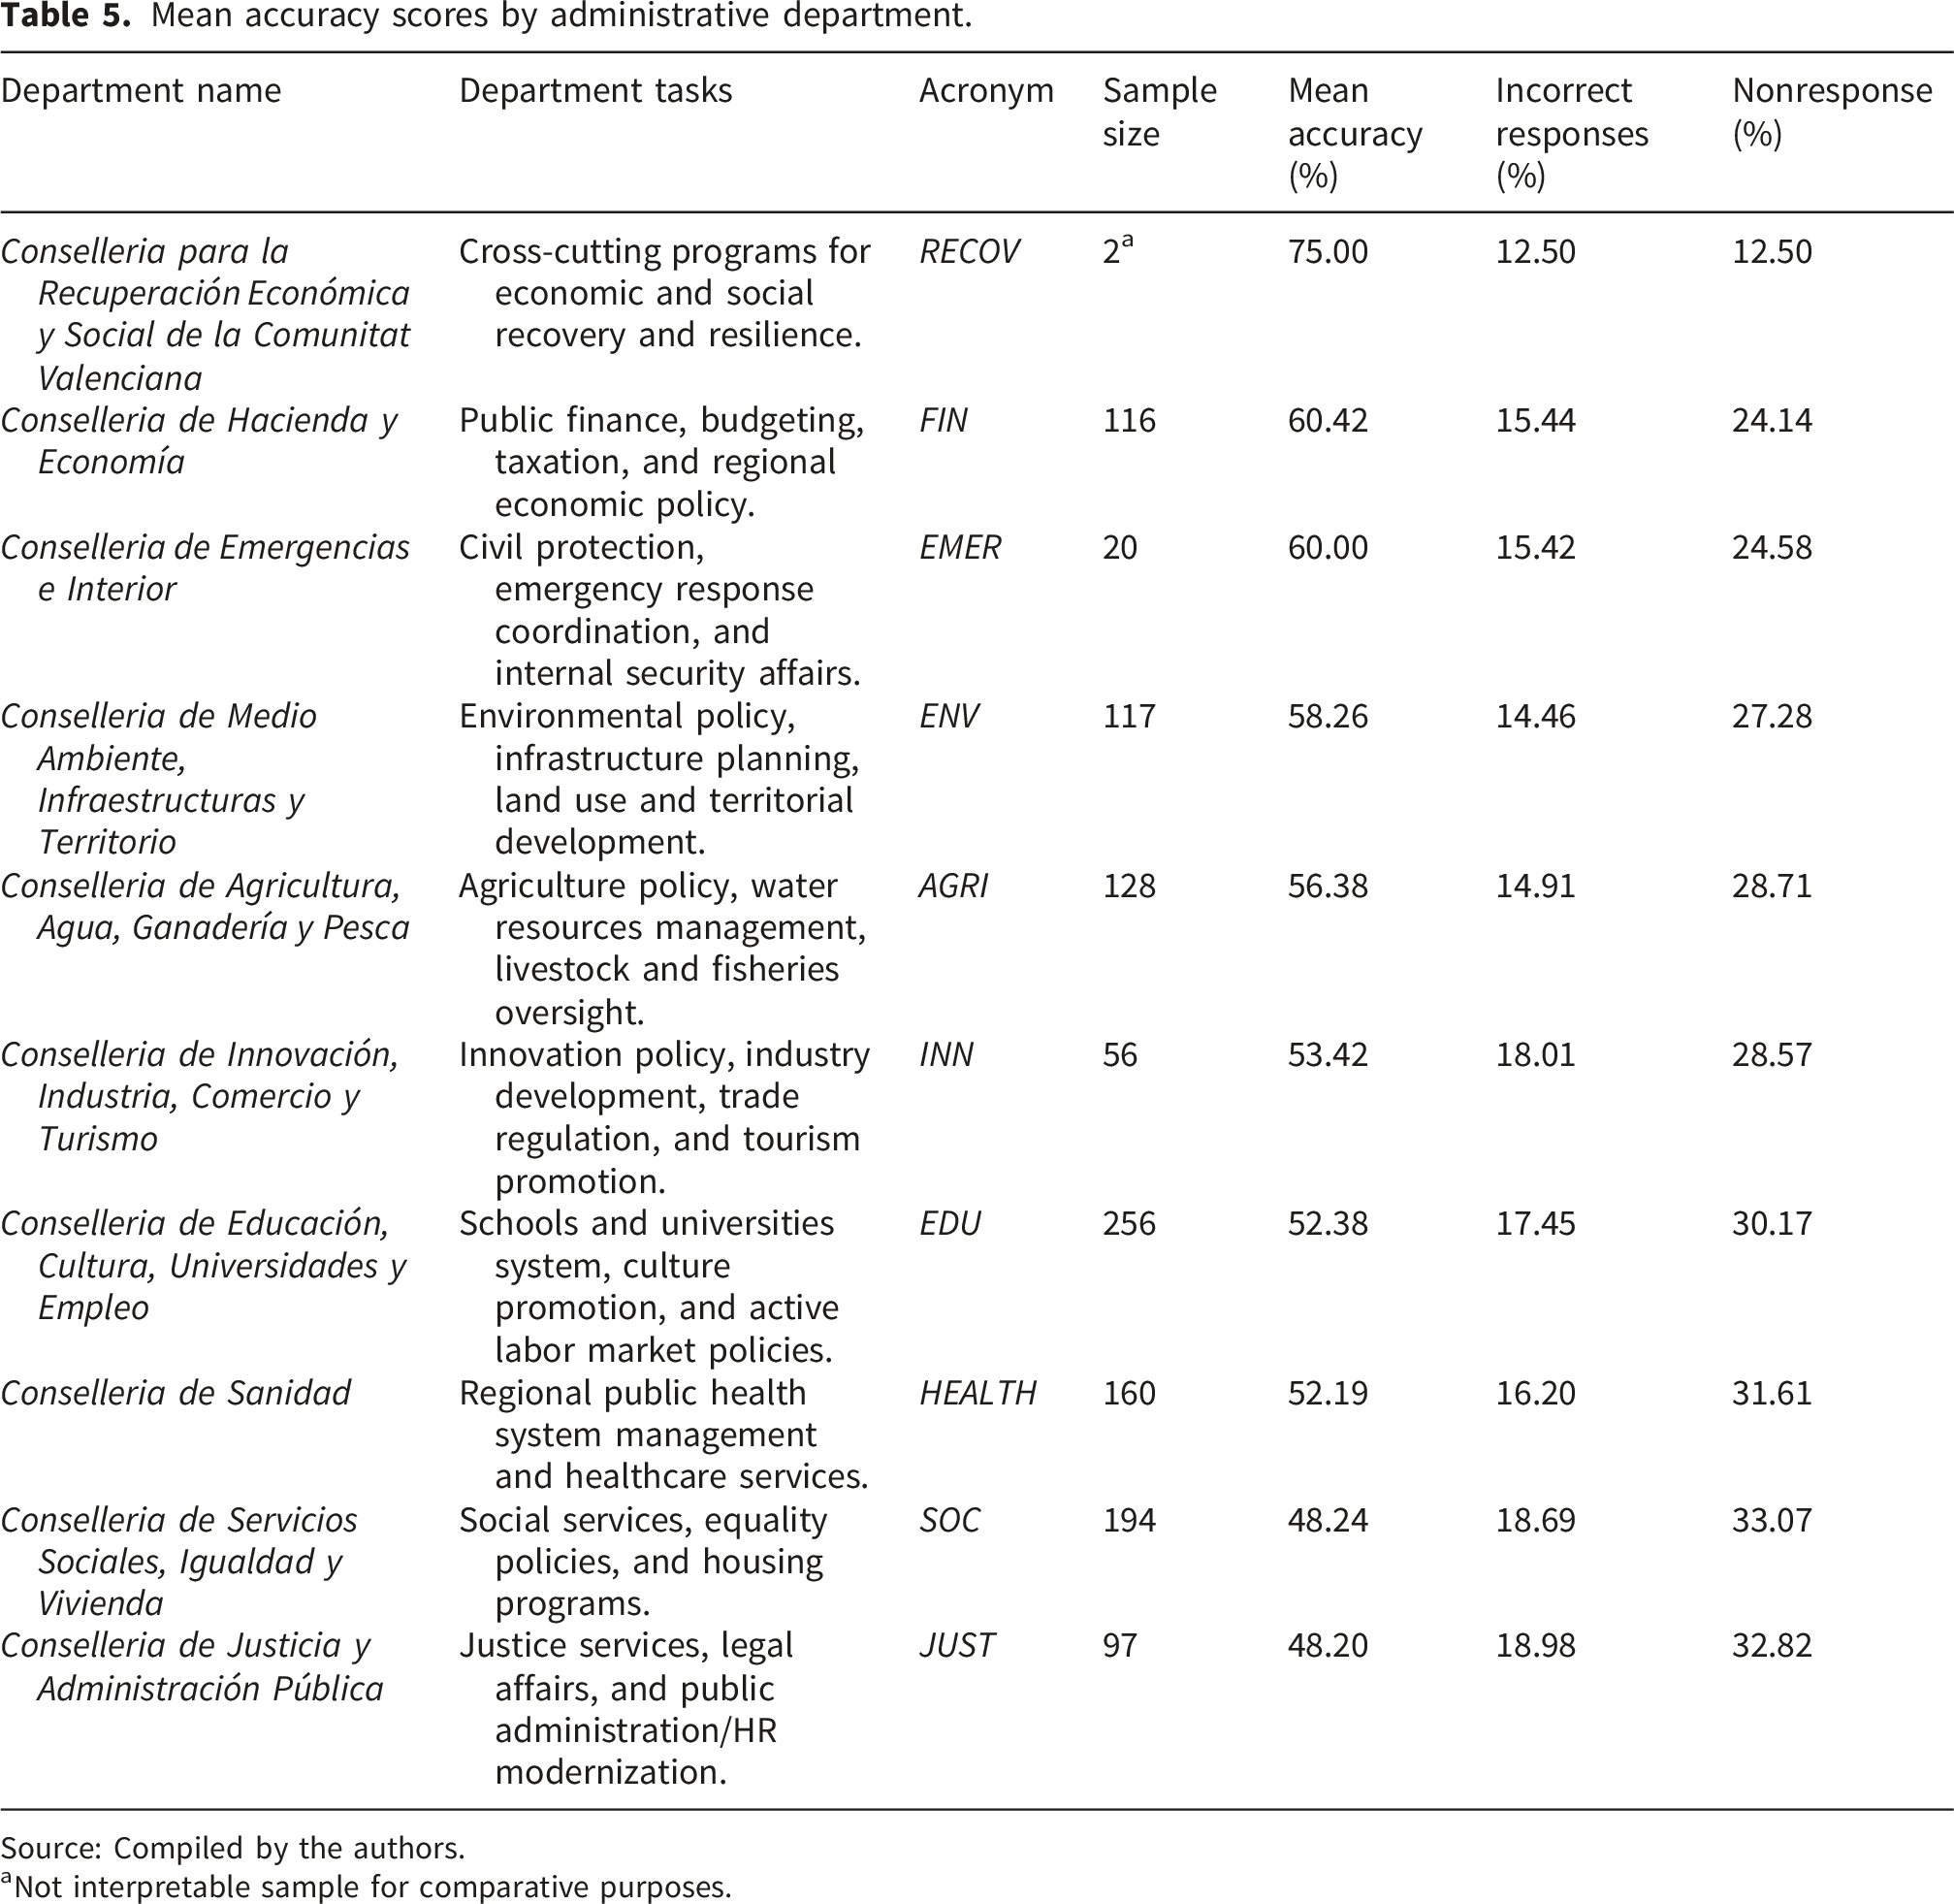
Source: Compiled by the authors.
aNot interpretable sample for comparative purposes.
The one-way ANOVA on departmental means is also significant (p < 0.05), with Tukey HSD tests (see Figure 4) confirming that the observed gaps correspond to distinct departmental data cultures rather than random individual dispersion. This finding aligns with the data readiness model proposed by Klievink et al.,
41
which demonstrate substantial differences among public organizations in their preparedness to work with data, depending on administrative function and internal culture. Significant differences across departments (Tukey HSD post-hoc test), with acronyms in Table 5. Mean differences in accuracy rates (percentage points); color intensity (with blue for higher performance and red for lower) encodes effect size and direction.
Departments oriented toward policy planning and analysis (characterized by technical structures and evidence-based decision processes) achieve high levels of readiness across technical, organizational, and human dimensions. Conversely, units focused on administrative or normative functions remain in initial stages, characterized by limited systematization in data use and communication.
Each conselleria thus appears to have developed its own internal cognitive ecosystem. In those where visual analysis forms part of routine decision-making, interpretative competence has become naturally embedded. In others, more oriented toward normative or welfare management, data retains a peripheral role. This functional architecture of DVL ultimately reflects the diverse, stratified, and uneven information cultures that characterize public administration.
5. Discussion and conclusions
AI-mediated visual analysis environments impose a regime of immediacy in interpretation and action. In this context, contemporary Data Visualization Literacy (DVL) must operate under the accelerated pace of intelligent systems acting in milliseconds.
The present study highlights the relevance of this chronometric dimension. Under a 25-second limit per item, proportional–relational tasks in the Mini-VLAT produced the highest omission rates. This pattern should not be interpreted necessarily as a lack of visualization knowledge, but as a temporal mismatch between sequential cognitive processing habits and the rapid tempo imposed by digital interfaces. Generations trained in more analytic and linear modes of reasoning tend to suspend responses where the interface demands immediacy.
This dynamic may have operational implications. When uncertainty translates into nonresponse under time constraints, part of the interpretive work can be deferred to automated outputs that are visually coherent and readily actionable. 42 In such settings, visual polish may be mistaken for evidential strength rather than serving purely as a design virtue. Among less educated subgroups and text-oriented departments, the combination of high omission rates and time constraints increases the risk of passive acceptance of algorithmic results, as interpretive work is more easily deferred to already synthesized visual outputs. Empirical results also point to specific vulnerability under conditions of high proportional load on graphics and time pressure, manifested in high rates of nonresponse.
Accordingly, DVL training in AI-augmented public administrations would benefit from an explicit emphasis on graphical skepticism. Reading an algorithmically generated visualization involves questioning the underlying model, aggregation loss, color and ordering criteria, and sources of invisible uncertainty. Within time-constrained analytical environments, short, domain-specific training formats using real datasets and explicit precision–time targets appear particularly well suited to strengthening rapid-reading skills without undermining interpretive control. From this perspective, a minimal discipline of verification emerges as a key condition for preserving analytical agency amid increasingly persuasive interfaces.
Rather than framing the observed dynamic as an argument for slowing analytical systems, the findings highlight the importance of reinforcing human expertise within AI-assisted decision cycles, particularly through improved reading speed, the establishment of systematic validation routines, and the development of a shared culture of visual critique. From this perspective, these orientations are intended to support organizational responsiveness while preserving interpretive oversight under conditions of temporal constraint.
Differences across departments reveal distinct cognitive profiles. In data-intensive areas where dashboards and indicators are routine, graphical reading has become a professional habit; in text-based domains, visual evidence remains peripheral. In AI-mediated work, these contrasts would acquire heightened relevance: DVL operates as an organizational property, shaped by the availability of visual tools, dashboard frequency, and internal data-communication culture.
From an organizational perspective, these results foreground the relevance of cognitive interoperability. In interdepartmental decision-making contexts, a shared visual language can help ensure that alerts, thresholds, and trends carry comparable meaning across domains such as Finance and Social Services. A minimal framework—consistent scales and units, uncertainty coding, accessible color palettes, and standard annotation syntax—may reduce interpretive friction and coordination costs in time-compressed decision cycles. Without such alignment, differences in data interpretation risk accumulating across organizational boundaries.
DVL is also a question of cognitive equity. Groups or departments exhibiting higher error or omission rates in relational tasks may face disadvantages in participating fully in AI-supported analytic processes. Within the European DigComp 2.2 framework, graphical interpretation forms part of the core “Information and Data Literacy” area. 43 High-level comprehension of visualizations is therefore not a scholarly luxury but a prerequisite for transparency, accountability, and operational efficacy in public policy.
Ultimately, DVL represents a form of institutional cognitive capital. In an AI-enhanced administration, it underpins what the Organization for Economic Co-operation and Development (OECD) terms a digitally enabled state, one that learns, adapts, and communicates through data in real time. 44 Treating DVL as an element of institutional infrastructure may involve regular diagnostics of staff skills, the adoption of shared graphic-interoperability standards, function-specific training, and longitudinal monitoring of accuracy and omission patterns. AI contributes speed and scale; DVL provides the cognitive foundation and epistemic oversight that helps ensure formal clarity is not mistaken for truth.
Future research could extend this diagnostic baseline in three complementary directions. First, given the marked asymmetry between literal reading and proportional–relational inference under time constraints, subsequent work could test whether Mini-VLAT performance reflects a largely unidimensional skill gradient or a differentiated latent structure across item families and cognitive operations. Second, the prominence of omissions motivates treating nonresponse as an outcome in its own right—distinct from accuracy among responders—and exploring models that explicitly incorporate the per-item time limit as a performance constraint. Third, longitudinal or intervention-based designs could examine whether short, domain-specific training shifts the omission–accuracy balance in high-load items and whether complementary assessments of critical visualization judgment converge with the present diagnostic profile in AI-supported public administration contexts.
Footnotes
Acknowledgements
The authors wish to thank Institut Valencià d’Administració Pública (IVAP), and particularly the General Subdirector of the Dirección General de Función Pública, Javier Cuenca, for their invaluable support. They also thank Marie Hodkinson for her careful linguistic revision of the manuscript, and two anonymous reviewers for their valuable suggestions. The usual disclaimer applies.
Funding
The authors disclosed receipt of the following financial support for the research, authorship, and/or publication of this article: This research has been supported by Generalitat Valenciana, Conselleria de Educación, Cultura y Universidades [grant number CIAICO/2023/031], Generalitat Valenciana, Conselleria de Economía, Hacienda y Administración Pública [grant number HIECPU/2023/2], and European Comission, Digital Europe Programme [grant number 101226207]. The funders had no role in study design, data collection and analysis, decision to publish or preparation of the manuscript.
Declaration of conflicting interests
The authors declared no potential conflicts of interest with respect to the research, authorship, and/or publication of this article.