
Abstract
Efficient collection of empty glass bottles within a reverse logistics framework is essential for reducing operational costs and promoting environmental sustainability. This study presents a real-world case in a hybrid closed-loop supply chain, where production plants can exchange bottled products, creating a debt of empty bottles that must eventually be returned to the plant that originally purchased the new glass. Proper management of this inter-plant debt is crucial to maintaining inventory balance across facilities. The logistics process is triggered either by stockouts at a plant or by saturation of the central logistics hub, which must be cleared to receive new empty bottles. The proposed approach is based on the company’s existing operational logic used in resource allocation meetings. This logic is replicated and enhanced through an algorithm that adjusts the order of resource distribution to minimize the overall bottle debt. The solution integrates real-time production and inventory data with a heuristic decision-making strategy. Computational results show improvements in inventory balance and overall supply chain efficiency, achieving the primary objective of minimizing inter-plant bottle debt.
Keywords
Introduction
The circular economy is receiving increasing attention as companies look for ways to reduce their impact on the environment and improve resource efficiency. 1 A core concept of the circular economy is the closed-loop supply chain (CLSC), which integrates forward and reverse logistics to recover value from waste products and materials. 2 In recent years, researchers have developed optimization frameworks using heuristic and metaheuristic algorithms, such as genetic algorithms, tabu search, and ant colony optimization, to design more efficient and resilient CLSCs under uncertainty.3–5 In the beverage industry, reusable glass bottles are a classic example of this field. These bottles are specifically designed to withstand multiple use cycles and are often reused throughout the distribution network. 6 To enhance operational efficiency, route optimization and collection scheduling for these bottles have also been addressed using advanced algorithmic techniques. 7 CLSCs are therefore particularly important in this regard and offer significant environmental advantages over single-use alternatives when managed effectively. These bottles must be collected, returned and redistributed between production facilities, making logistics a key part of sustainable operations. Advanced optimization models can help balance trade-offs between monetary cost, environmental performance, energy consumption, and logistical constraints in such reuse networks.8,9 In addition to reducing waste and material inputs, bottle reuse can help companies respond to increasing regulatory pressures and sustainability goals, especially in regions where recycled packaging directives are being implemented. 10
In bottle recycling systems, logistics management faces several challenges. Many beverage companies operate in mixed supply chains, where the manufacturing plant is both the sender and the receiver of the product. As bottles move from plant to plant, a so-called “bottle debt” is created, which is the amount of empty bottles that need to be returned to the original purchasing plant. If this debt is not tracked and resolved in a timely manner, it can lead to inventory imbalances, wasted shipments, stock-outs, and even production line downtime. A case study by 11 in East Africa’s beverage sector revealed that vague return paths and fluctuating return rates often cause bottle debt to accumulate, making the collection process difficult to schedule and execute. In addition, coordination is inefficient due to decentralized decision-making across factories, which often relies on manual planning. 12 The reality also faces constraints such as limited storage space, tight transportation resources and frequent changes in production plans. In the absence of a systematic management mechanism to deal with bottle debt and reverse logistics, the operational efficiency of the entire supply chain will be seriously affected, thereby weakening the reuse system’s role in supporting sustainable development.
This paper explores the transportation planning problem faced by a large beverage company operating under this hybrid CLSC system. Figure 1 provides a conceptual overview of the operational structure and logistics constraints addressed in this study, with a central hub coordinating operations across five production centers. The central hub has a dual role: distributing new bottles and absorbing returns from the network. Production centers are responsible for producing assigned products and collecting returns from the neasrest regions. Dashed lines represent intercompany routes restricted to conventional trucks, while solid lines indicate distribution routes from the central hub to production plants, used by both conventional and double trucks. The colored lines indicate bottle debt relationships between production facilities, with each color corresponding to a different bottle category. These flows reflect the historical exchange of reusable bottles that must be balanced over time. The interaction of transportation routes,and bottle debt forms the basis for the planning problem. Schematic representation of the logistics network. The central hub connects five production plants (PA–PE) via internal routes and distribution channels. Colored arrows indicate bottle debt relationships.
Logistics decisions in this system are typically triggered by two events: (i) out-of-stock warnings at production plants, and (ii) saturation at the central logistics hub, which must maintain sufficient stock for both new production and recycled returns. Under these conditions, planners must make timely decisions to reallocate existing bottle inventories to satisfy demand, prevent bottlenecks, and reduce outstanding debt across the network. Currently, these decisions are made manually during weekly coordination meetings. While the company applies a rule-based logic to prioritize shipments based on urgency and availability, this manual process is often slow and suboptimal.
To improve the speed and quality of decision-making, we developed a heuristic-based decision support tool to automate resource allocation across the network. The proposed algorithm replicates the company’s current logic while incorporating real-time data on production schedules, return rates, inventory levels, and transportation capabilities. It dynamically adjusts transportation priorities, minimizes total bottle debt, and maintains inventory balance across the network.
The main contributions of this study are described next. Firstly, the conventional logistics problem in the beverage supply chain is described as a bottle debt model. The model captures the process of exchanging empty glass bottles between production plants, including key constraints such as warehouse space, truck capacity, inventory levels, and the need to return bottles to the original sender. Secondly, a planning methodology that combines business rules with heuristic logic is proposed. The approach replicates the company’s decision logic and further enhances the solution to support faster and more consistent cross-plant planning. Thirdly, the model and methodology are applied to a real-world case study of a large beverage company in Spain. The application demonstrates how the proposed methodology can support decision making under real-world operating conditions and help manage bottle returns and inventory more effectively.
Literature review
In industries that incorporate reusable packaging, such as glass bottles, maintaining a balanced inventory is particularly challenging due to fluctuating demand, production constraints, and the complexities of CLSC. Recent studies also emphasize that digital transformation and smart technologies can enhance visibility and coordination in such supply chains, improving operational performance in manufacturing environments. 13 Companies must determine how to distribute resources efficiently while minimizing shortages, excess stock, and operational disruptions. 14 Various strategies exist for managing these challenges, ranging from centralized planning systems to decentralized decision-making based on local conditions. To address these challenges, a wide range of methods and approaches have been explored, including optimization techniques, artificial intelligence, and advanced algorithms. Beyond optimization, operational efficiency has also been addressed through automation tools, which streamline industrial decision-making processes and increase reliability across logistics operations. 15
Mathematical optimization models have been extensively applied to optimize resource allocation,16,17 while heuristic and rule-based methods, such as relax-and-fix algorithms, 18 offer computationally efficient alternatives. Additionally, metaheuristic approaches have gained attention in supply chain optimization due to their ability to generate high-quality solutions within reasonable computational times. 19 These techniques include a broad range of metaheuristics, such as particle swarm optimization, 20 ant colony optimization, 21 and genetic algorithms. 22 Furthermore, hybrid methods that integrate local search with different metaheuristic approaches, such as genetic algorithms 23 or ant colony optimization 24 have been explored to improve solution accuracy and convergence efficiency.
Beyond the standard approaches, emerging methods such as reinforcement learning and stochastic programming 25 enable adaptive decision-making under uncertainty, while robust optimization 26 provides strategies to mitigate variations in supply and demand. In addition, supplier allocation models that explicitly consider disruption risks further strengthen the resilience of supply chains by ensuring more reliable order distribution. 27 Fuzzy logic models 28 have been applied to incorporate uncertainty and imprecise information into decision-making processes. Several other factors must be taken into account in real-life supply chain problems, including vehicle diversity in logistics planning 29 and workforce congestion in warehouse management. 30 However, sustainability-related constraints have gained the most attention recently, especially in the transition toward greener logistics solutions. From another perspective, digital tools have also been applied to address environmental goals, such as ensuring regulatory compliance and monitoring emissions through machine learning approaches. 31 Optimizing electric vehicle fleet management and recharging station placement using ant colony optimization algorithms 32 is one example of efforts to reduce carbon footprints in transportation networks. Sustainability considerations have also led to the development of multi-objective optimization models that balance cost efficiency with environmental responsibility. For instance, recent studies propose bi-objective MILP formulations that minimize both logistics costs and CO2 emissions in supply chain network design. 33 These advancements highlight the growing need to integrate ecological concerns into supply chain optimization while maintaining operational efficiency.
Despite significant progress in supply chain optimization, effectively integrating inventory management with transportation planning remains a complex challenge. While various studies have introduced models to address this issue, many rely on simplified assumptions that fail to capture the full depth of real-world logistics systems, limiting their practical applicability. 34 Hence, our study aims to close that gap by developing an efficient framework that aligns with the practical demands of modern supply chains. By incorporating both inventory control and transportation logistics into a unified strategy, our approach accounts for real-time constraints, dynamic demand fluctuations, and logistical decision-making processes within the company under study. Furthermore, the proposed framework is designed to be flexible and scalable, making it applicable to a wide range of logistics environments, particularly those involving reusable packaging systems. Recent contributions also highlight the role of cloud-based strategies in enabling scalable and real-time decision support in dynamic business contexts, which aligns with the flexibility required in modern supply chains. 35
While previous studies have addressed supply chain optimization using advanced methods, few have tackled the specific integration of inter-plant debt reconciliation and transportation planning within reusable packaging systems. Most approaches either oversimplify logistical constraints or assume static demand conditions, limiting their real-world applicability. Our study bridges this gap by proposing a heuristic-based framework grounded in actual company practices, capable of dynamically reallocating resources based on real-time operational triggers. Unlike existing models, the proposed solution accounts for both logistical feasibility and bottle debt balancing, offering a scalable and implementable tool for industries with closed-loop supply chains.
Problem statement
The company operates a reverse logistics network for returnable glass bottles, involving multiple production centers and a central logistics hub. Empty bottles returned by customers are collected at the nearest centers and redistributed to the production facilities that originally purchased them. This redistribution process generates imbalances between centers, referred to as inter-plant bottle debt, which must be periodically corrected to ensure fair and efficient reuse. The primary goal of the planning process is to minimize inter-plant bottle debt while ensuring that all production centers maintain sufficient inventory to meet manufacturing needs. At the same time, the central hub must not exceed its storage limit of 100 truckloads, thus preserving its capacity to absorb future returns. The planning system must determine when and how to move bottles between centers along available routes, accounting for inventory levels, truck capacity, and production schedules. Two types of events trigger logistical actions: 1. Stockout risk at production centers: when projected inventory falls below production demand or defined safety stock thresholds. 2. Hub saturation: when the central hub approaches its maximum storage capacity, requiring redistribution of excess stock.
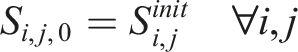
Let C = {M, C1, …, C8} denote the set of centers, where M represents the central hub and the others are production centers. Let i denote the product type and k the planning week. For each center j, product i, and week k, the relevant parameters are: Si,j,k: Stock of product i at center j on week k Ri,j,k: Returned empty bottles of type i to center j on week k Pi,j,k: Bottles of type i required for production at center j on week k Ni,j,k: Incoming shipments of type i to center j on week k SSi,j: Safety stock level for product i at center j
The logistics decisions are subject to several constraints. Each center must hold enough bottles to meet production requirements:

The total equivalent bottle volume at the central hub M must remain below its capacity K (100 truckloads):


To standardize planning, all movements are measured in CCE (conventional truck equivalents), where 1 CCE = 33 pallets. Conventional and HVO trucks carry 1 CCE, while double-height and double-cabin trucks carry 2 CCEs. The planning problem can therefore be defined as a constrained reallocation of bottle stock across the network, with the dual objective of preventing disruptions and minimizing inter-plant debt. The next section introduces a mathematical model that formalizes a simplified version of this planning problem.
Methodology
This section presents the methodological framework adopted to address the identified problem. First, a simplified Mixed Integer Programming (MIP) model is introduced to capture the essence of the decision-making process. Then, heuristic algorithms are described, developed to efficiently address the operational challenges under real-world constraints.
A simplified mixed integer programming model
This section introduces a MIP including the core characteristics of the the aforementioned logistics planning problem. The main goal is to ensure that each plant maintains enough bottle stock to meet production needs while minimizing the imbalance, or ‘debt’, of bottles exchanged between facilities. The model considers operational constraints such as truck capacities, storage limits, and route availability. The following sets and indices are considered: I: Set of product (bottle) types, indexed by i C: Set of centers, indexed by j K: Set of weeks in the planning horizon, indexed by k T: Set of trucks, indexed by t
Likewise, the following parameters are also taken into account: Ri,j,k: Returned bottles of type i at center j on week k Pi,j,k: Bottles of type i required for production at center j on week k SSi,j: Safety stock for product i at center j C
t
: Capacity of truck t (in bottles) K
M
: Maximum truck-equivalent stock allowed at hub M (usually 100 CCE)
Finally, the decision variables are described next: yi,j,j′,k,t ∈ {0, 1}: 1 if truck t is used for product i from j to j′ on week k
In this context, the objective function is based on minimizing the total residual bottle debt across all product types and center pairs:

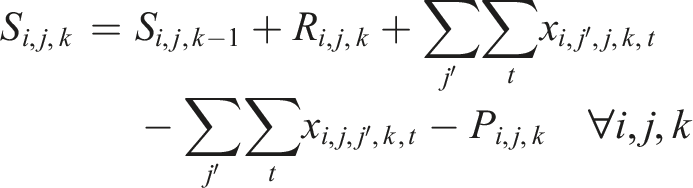
The inventory balance per center and product constraint updates inventory based on previous stock, returns, incoming and outgoing shipments, and production use:
The maximum inventory capacity constraint ensure that stock never exceeds local storage constraints:

The safety stock constraint is a soft one indicating that production centers should aim to maintain inventory above the safety stock level:

Notice that the aforementioned constraint could also be moved into the objective function as a penalty if strictly enforcing it is too rigid.
The truck capacity and usage constraints ensure that each shipment respects the truck’s carrying capacity and that a truck is only activated if it is used for transport. Additionally, the total number of trips assigned to each truck must not exceed its weekly trip limit, and the number of trips between any pair of locations in a given week must remain within the maximum allowed for that route.


The inter-center residual debt represents the absolute difference between the initial debt and the net number of bottles returned through planned shipments.


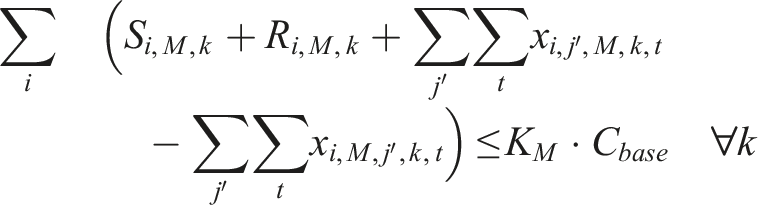
The central hub capacity constraint ensures the total stock at the central hub M (in truck equivalents) remains below its threshold:
Since shipments are only planned for the first week, the following constraint ensures that no transfers happen after week 1:

Finally, all variables are restricted to their logical domains:

Note that the model does not incorporate all real-world constraints, such as vehicle types, route priorities, weekly planning rules, product prioritization, and the multi-layer logic incorporated in the heuristics. Therefore, it should be considered an approximation designed to validate the heuristic and represent the problem in context.
Decision-making automation process
The proposed solution aims to enhance expert-driven manual planning by integrating automated tools, with the dual goal of improving sustainability and operational efficiency while systematically reducing inter-plant bottle debt. Automation accelerates decision-making, increases accuracy, and ensures a smoother logistics workflow. A key requirement is system flexibility, allowing the generation of alternative feasible solutions while maintaining consistency with priorities and constraints, as well as supporting real-time adjustments without degrading performance.
Maintaining consistency in the resource allocation process is also essential. Once products and transport resources are assigned, they are no longer available for subsequent iterations, which directly affects future decisions. To manage these dependencies, the system continuously updates its database (DB), incorporating real-time data on inventory levels and transportation capacity, thereby ensuring coherent and well-informed planning decisions. Figure 2 illustrates the process through a flow diagram. Flow diagram of the sequential resource allocation algorithm in the glass transportation problem.
The diagram adopts a color-coding scheme to clarify the role of each component: Blue boxes represent the input data to the system, including the input DB and the PW; Red boxes indicate the heuristic algorithms applied at different stages of the process (Heuristic 1 and Heuristic 2); Green boxes correspond to the outputs of the algorithms, which may consist of partial solutions or database updates; Yellow diamonds represent logical conditions that determine branching in the flow.
The dashed yellow line encloses the final solution when the MCT requires fewer than 100 trucks, while the dashed red line represents the case in which additional trucks are necessary to release capacity at the hub.
Algorithm 1 outlines the automated decision-making process and highlights how it addresses the two main logistical challenges. To mitigate stock shortages at production facilities, Heuristic 1 is applied. This heuristic uses as input all relevant operational data sets, such as inventory levels, production schedules, safety stock thresholds, returns, and transportation routes, along with the set of warning products (PWi,j). A product enters this set when the condition Si,j,k < SSi,j is satisfied.
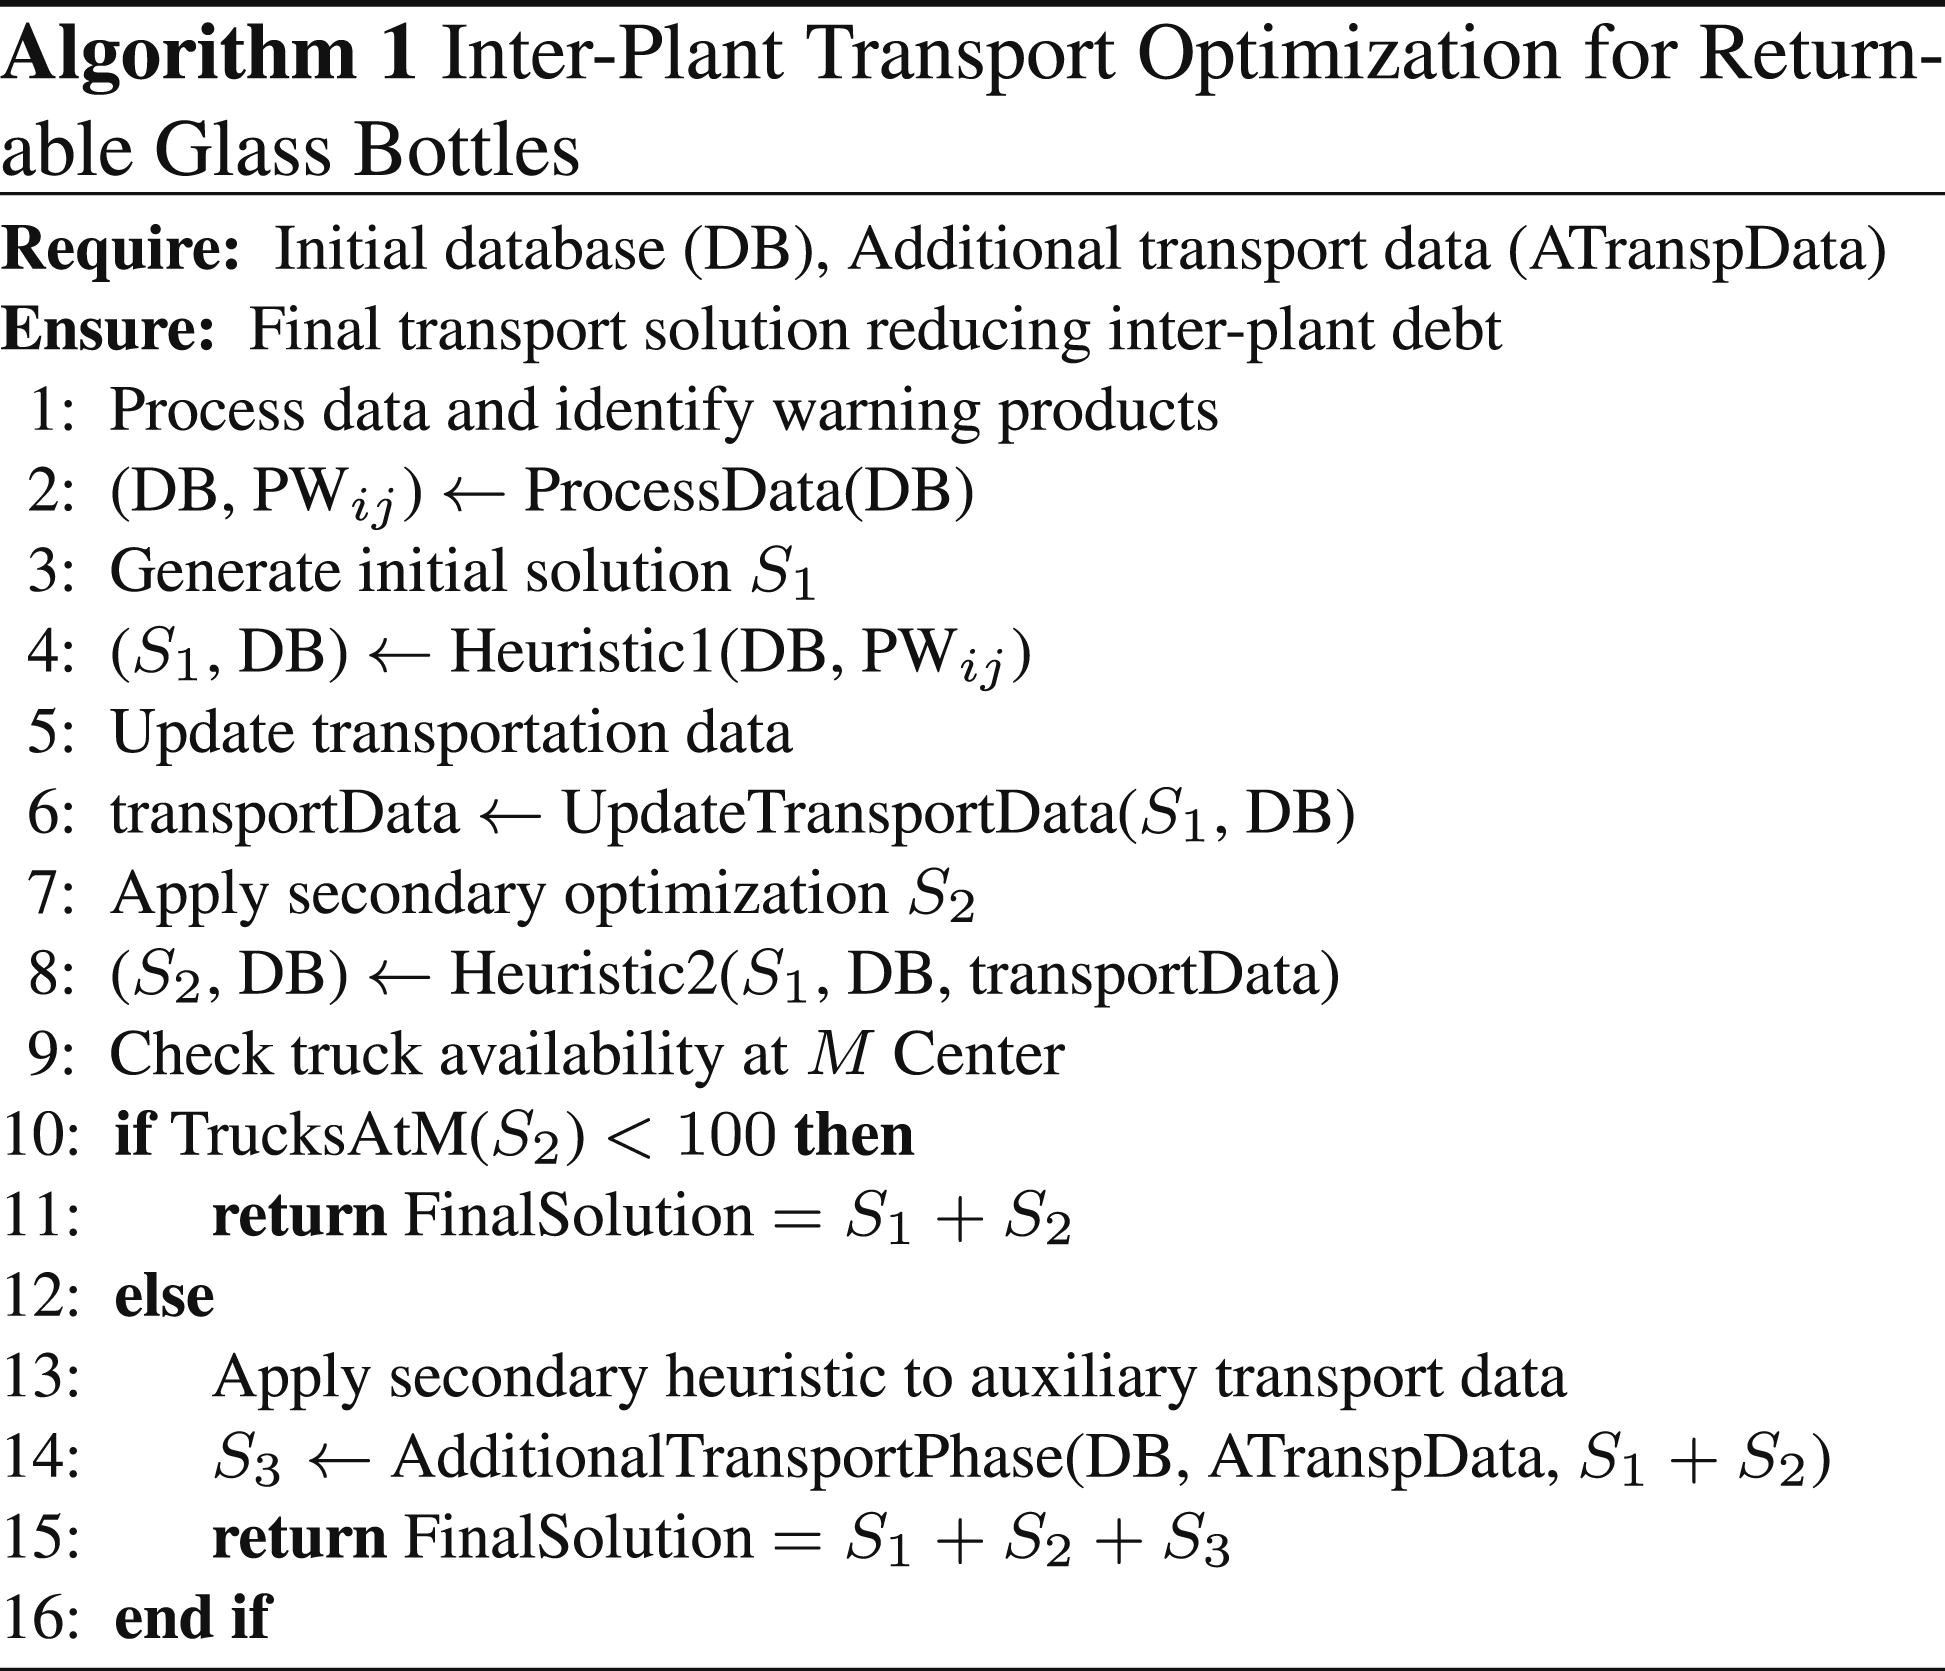
Based on this information, the heuristic constructs an initial solution by assigning truck movements from centers with available surplus to those requiring replenishment (S1). In addition, it updates the datasets to reflect the resources already allocated. It is essential to understand the company’s operational framework regarding inter-plant transportation of empty glass bottles. When transportation occurs between production plants, the return trips of trucks that have delivered finished products are utilized to move the recycled glass. Consequently, the number of trucks available for this purpose directly depends on the reverse flow of the finished goods distribution routes. In contrast, when transport originates from the central logistics hub M, a dedicated transport system is used. This system includes conventional trucks, DA vehicles, and HVO units. The use of this special transport is predefined for each production plant, with a specific allocation of trucks authorized to perform a weekly route between the hub and the corresponding plant.
Heuristic 1 may utilize either inter-plant transport routes or the special transport from the hub. In cases where special transport from M is used, the consumption of this resource must be properly recorded and updated to ensure that Heuristic 2 operates based on the actual availability of transport resources, thus avoiding duplication and ensuring accurate assignment. It is important to note that Heuristic 2 is exclusively based on the special transport system to achieve its objectives. This step ensures proper resource management, preventing over-allocation during the optimization process.
The result of Heuristic 2 (S2) enables the release of excess stock from center M. In some cases, the application of Heuristic 2 with conventional transport resources is not sufficient to meet the constraint of space release at the central logistics hub M. Therefore, an additional process is introduced, which utilizes supplementary transport resources specifically designed for exceptional situations where the number of trucks at center M exceeds 100 units. This additional capacity extends the system’s operational flexibility without compromising performance. The definition of inter-plant movements using these supplementary resources is also carried out through Heuristic 2, and the resulting solution is referred to as (S3). This ensures consistency in the optimization logic and supports the efficient allocation of transport resources across plants.
The remainder of this section describes the two heuristics applied to address the previously identified challenges and the additional transport process. In both approaches, each logistical movement involves transferring a specific product from an origin center to a destination center and assigning a transport type.
A fundamental premise of the system is that movements of recycled empty bottles between centers are only carried out when they result in an effective reduction of debt, while new bottles can only be transported through specifically defined routes, without generating or reducing debt.
Heuristic 1: Avoiding stockouts
The designed heuristic aims to prevent production disruptions and ensure demand fulfillment through efficient inventory management, while simultaneously contributing to the reduction of inter-plant debt. The process begins with the detection and classification of alerts, which are grouped into two lists according to urgency. High-priority alerts correspond to imminent shortages of critical products or projected shortages of minor products within 3 weeks. In contrast, low-priority alerts indicate stock levels falling below safety thresholds or potential shortages of minor products expected in the fourth week. The algorithm first resolves high-priority alerts, then addresses the lower-priority ones. Once classified, specific rules are applied to manage each situation, as outlined in Algorithm 2.
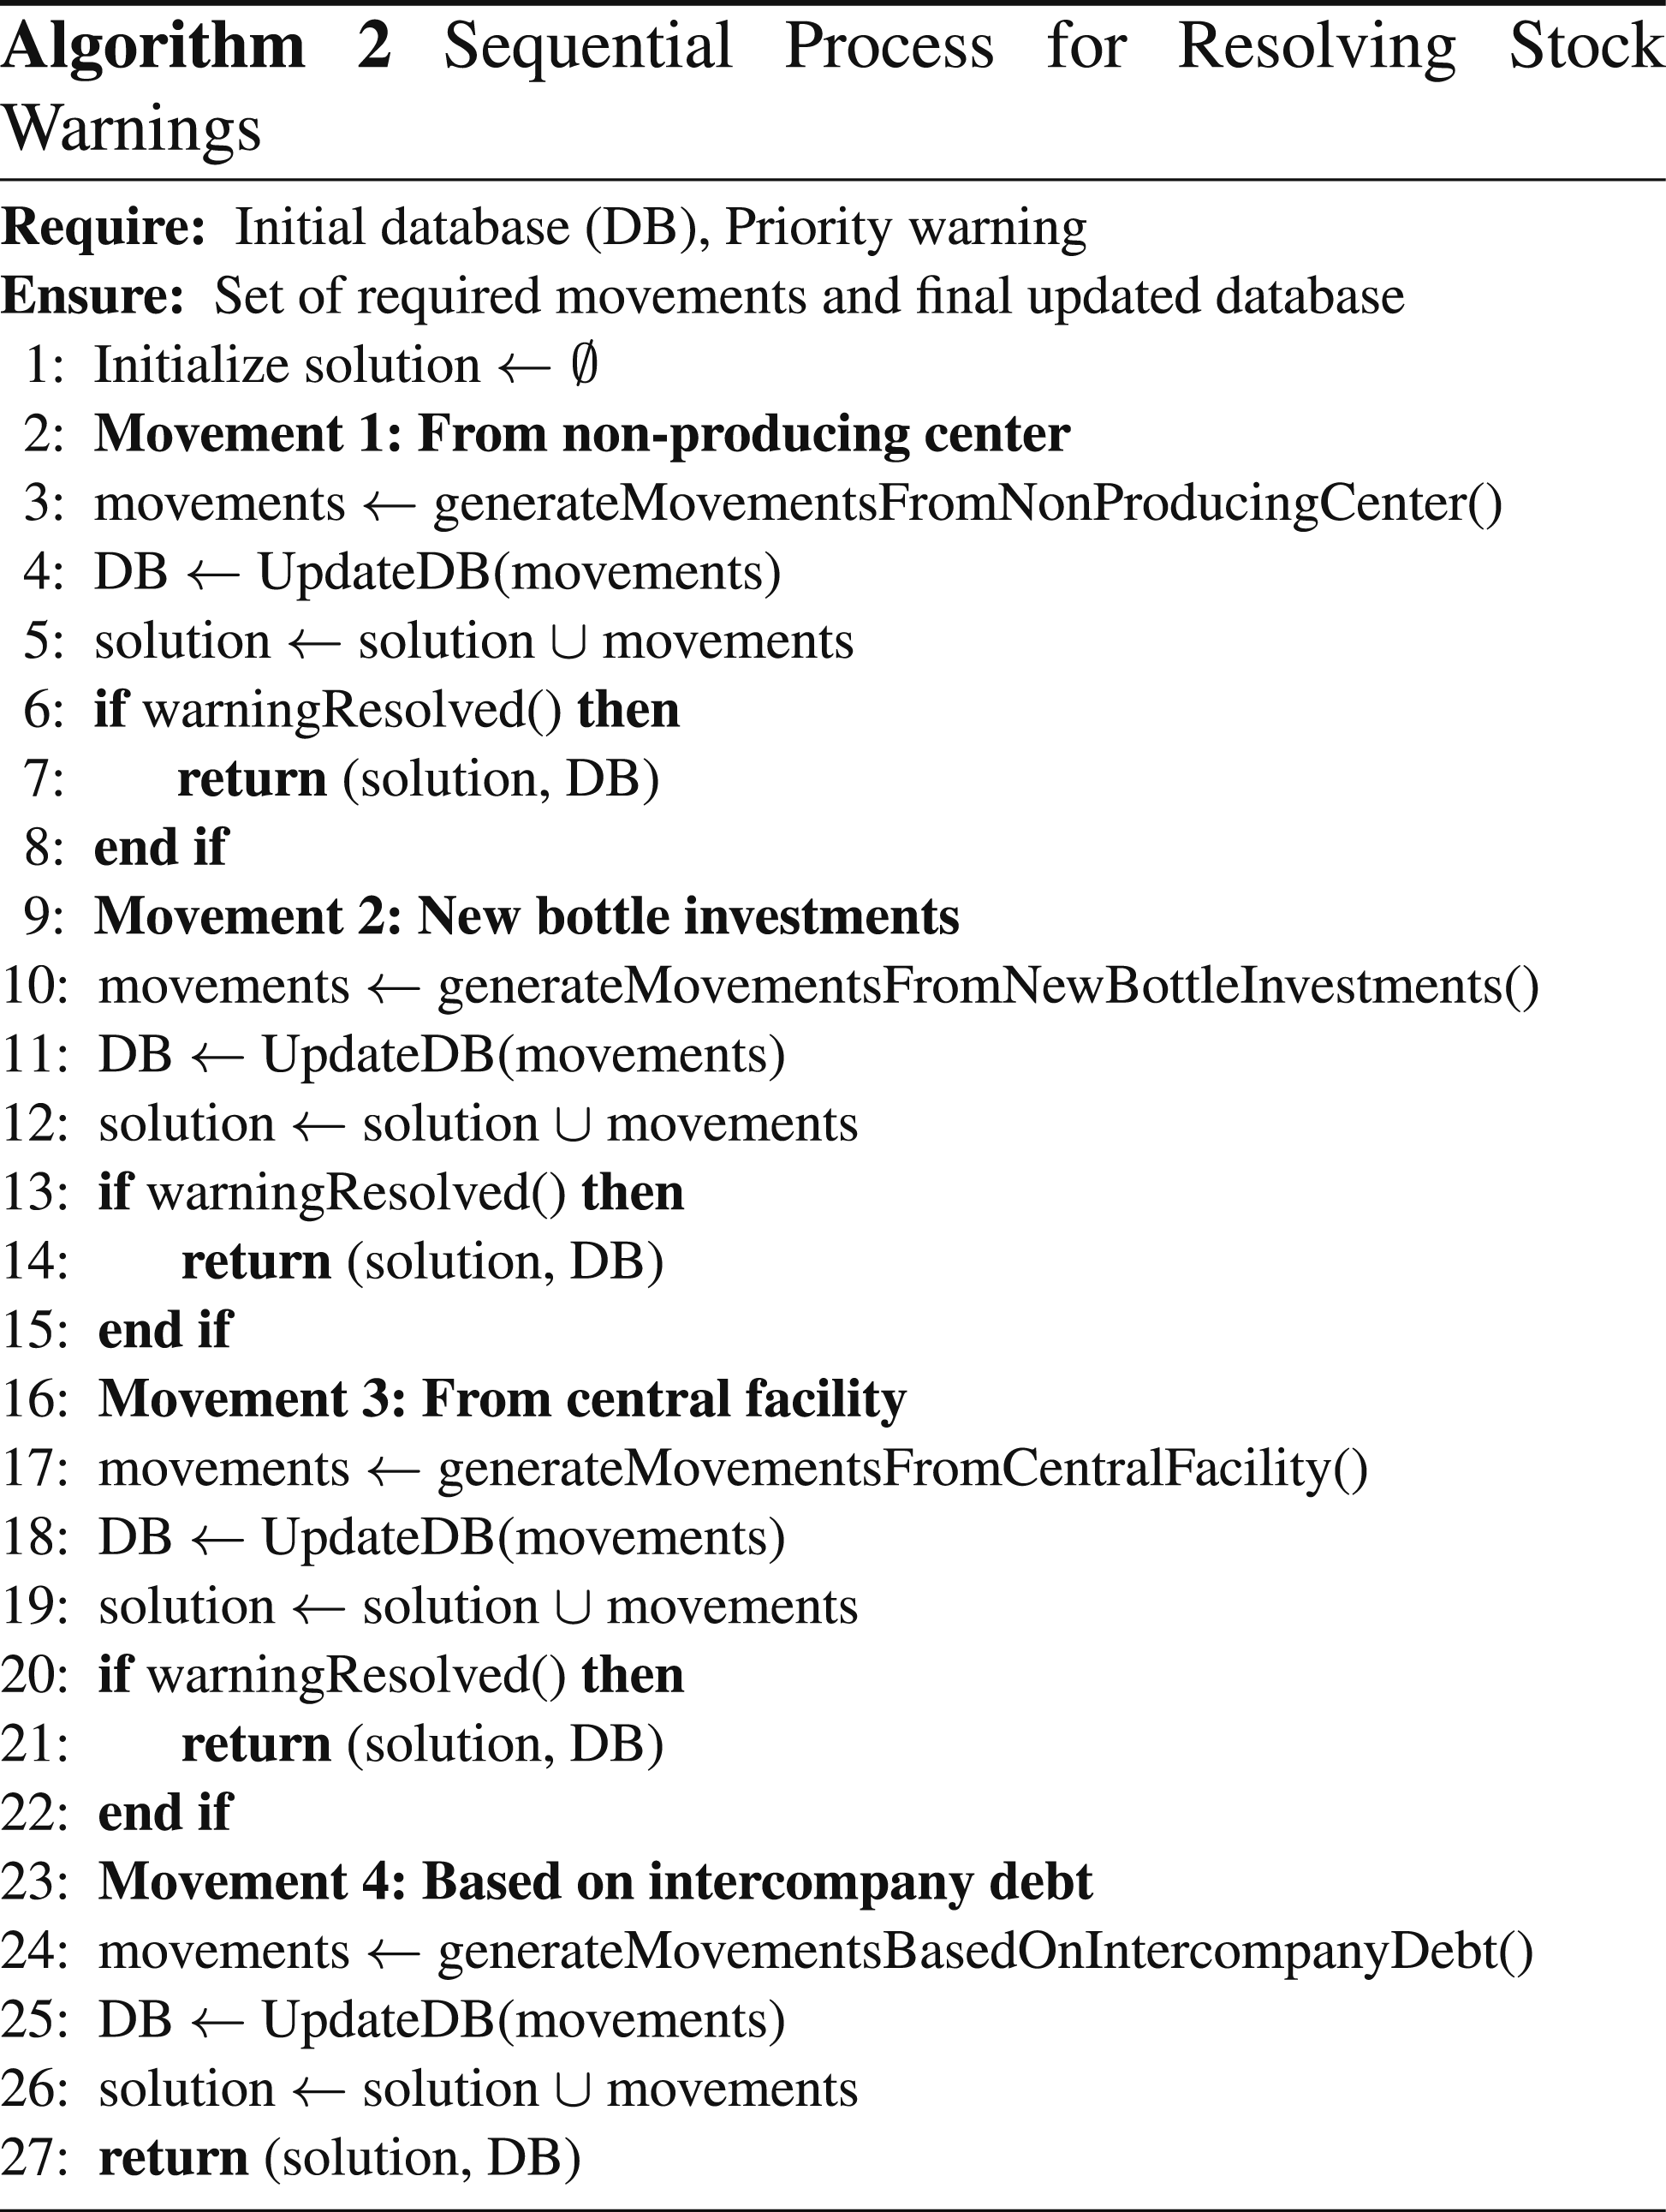
The implemented heuristic follows a structured, step-by-step sequence to resolve alerts through predefined actions. This process is executed in two iterations: the first addresses high-priority alerts, and the second focuses on low-priority alerts. In the initial stage, bottles are redistributed from
If the transfers from
If shortages persist, recycled bottles from the logistics hub M are redistributed to the plants with active alerts. This action both alleviates production risks and frees capacity at the hub.
The final strategy involves truck movements between facilities to offset inter-plant debt. This redistribution considers both the debt balance and the available stock at the debtor plant, ensuring that production activities are not compromised. Once all stages are executed, the results of Heuristic 1 are reported, including the actions performed, prioritization of solutions, and a summary of bottle allocations or debt adjustments. If alerts remain unresolved, the output serves as a notification system, signaling the need for manual intervention or further analysis.
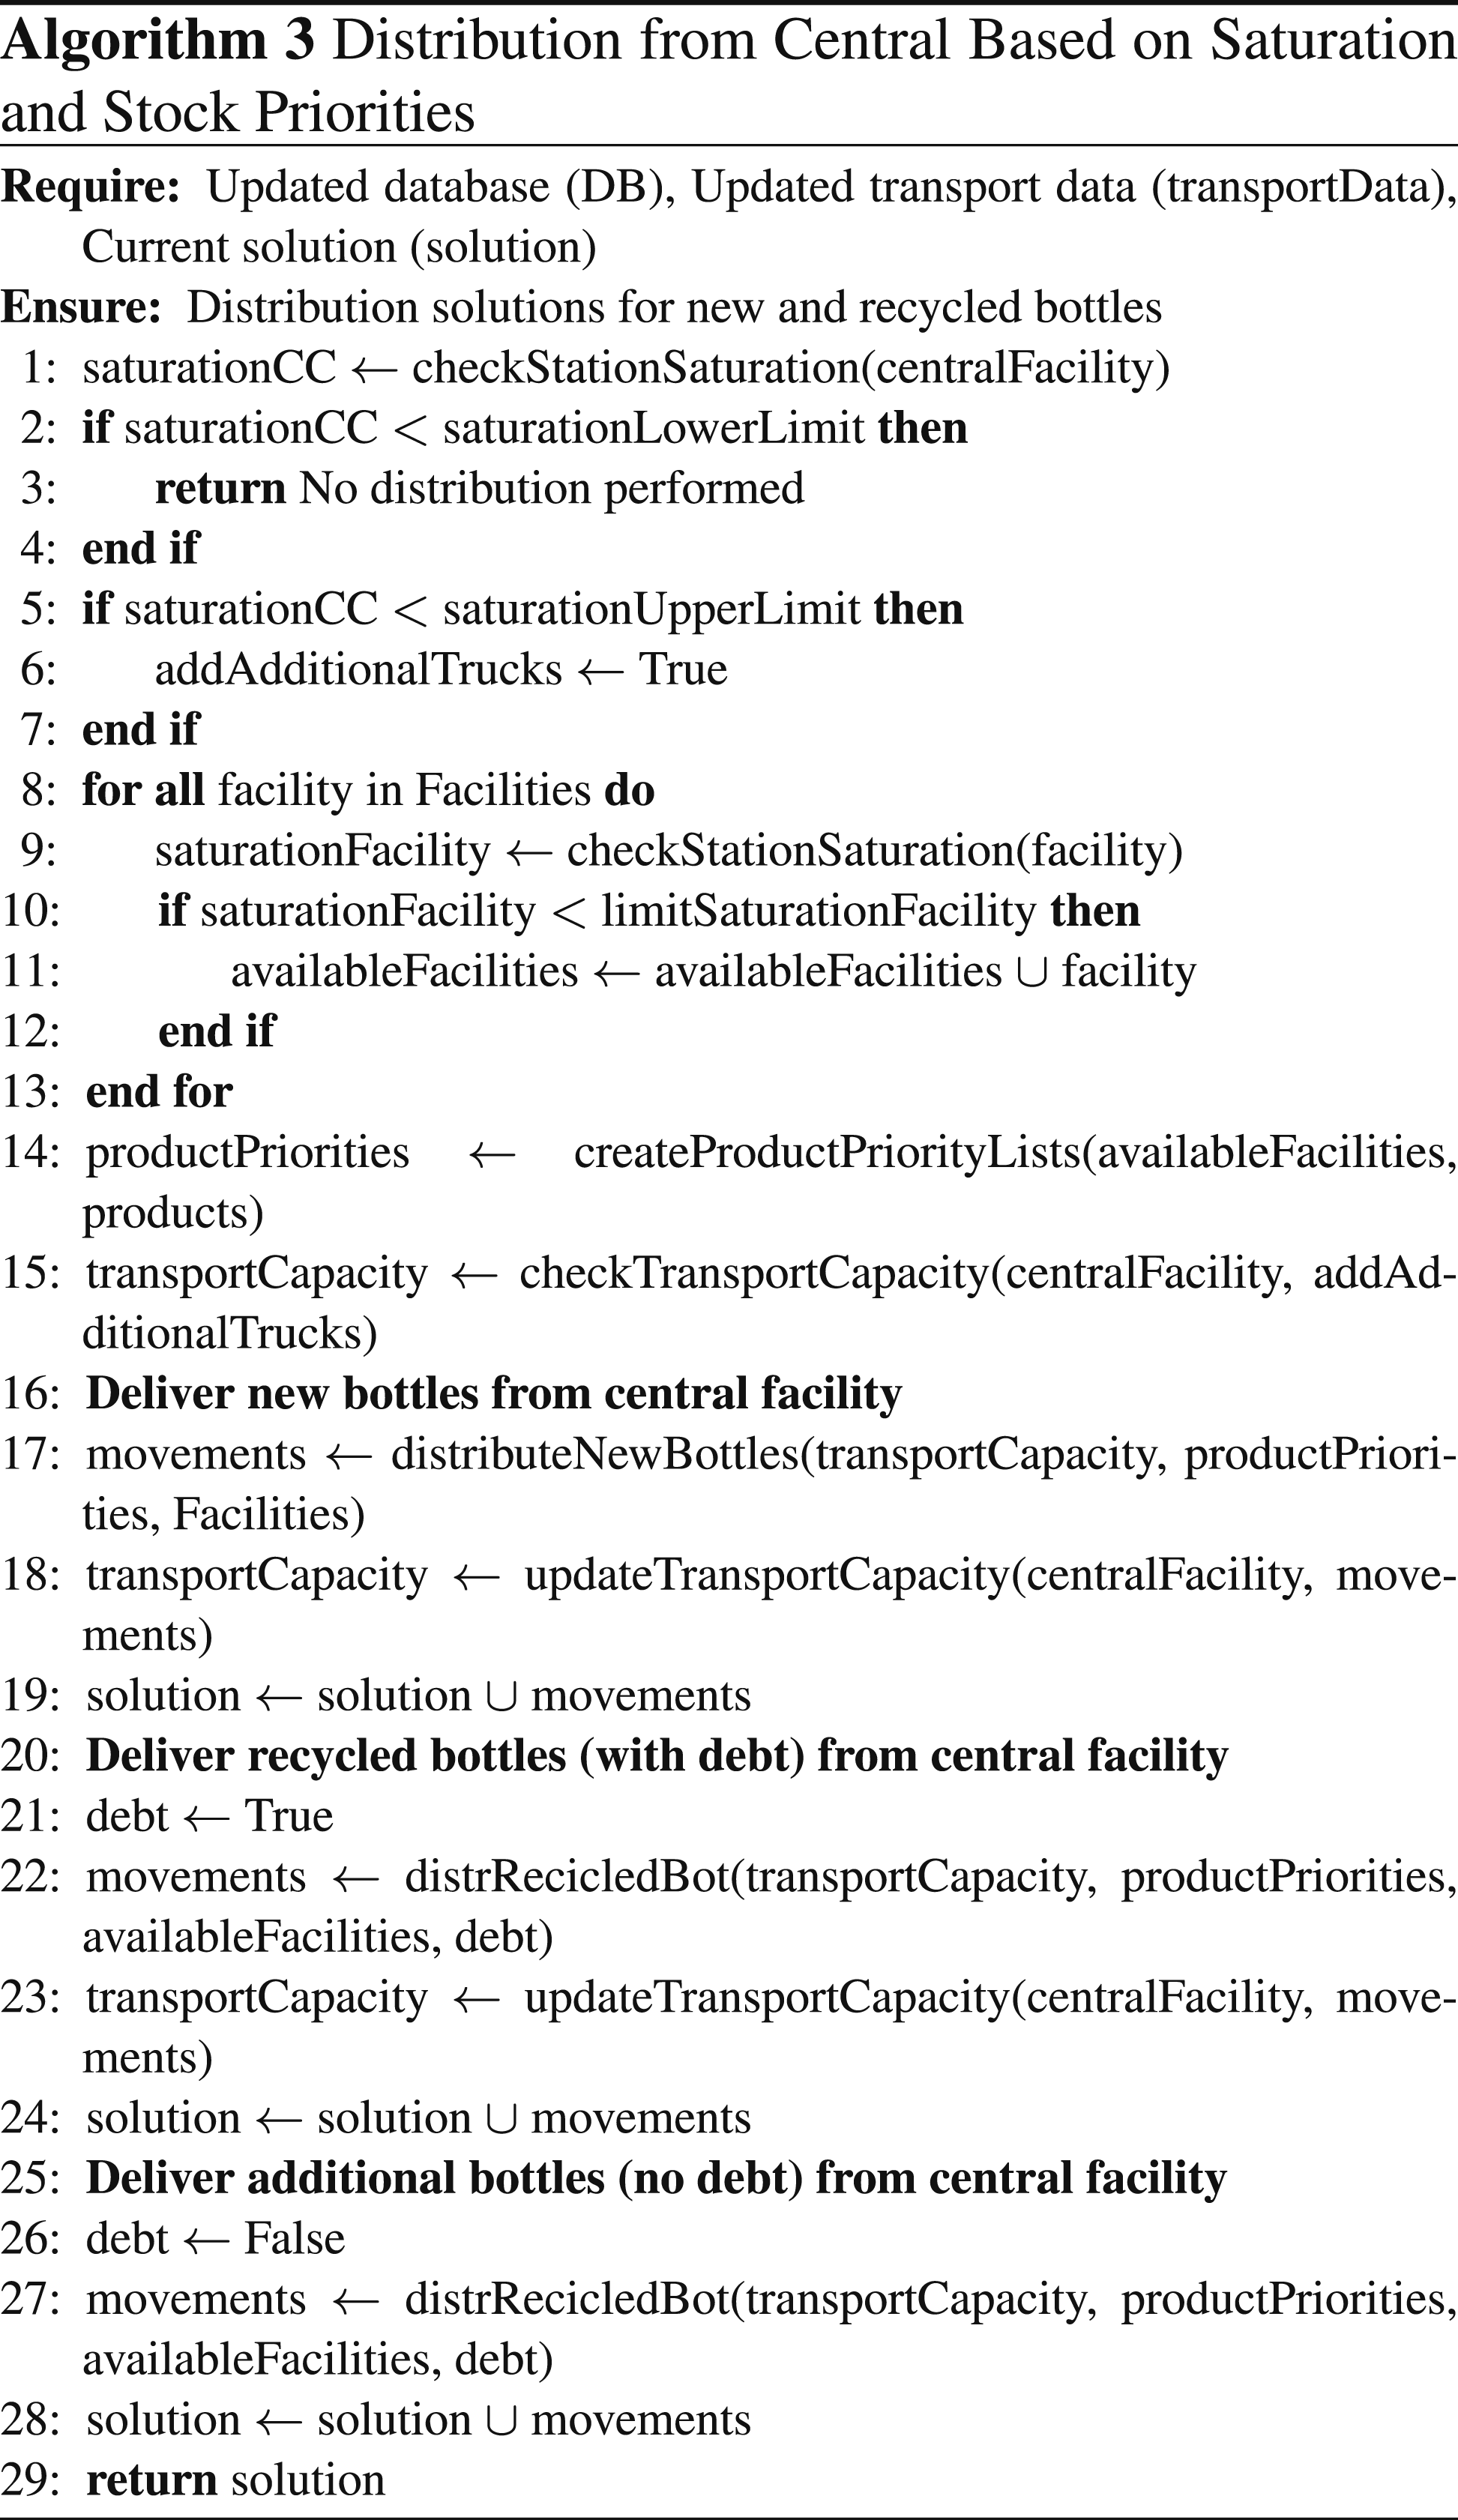
Heuristic 2: Optimization of central center logistics
The proposed heuristic optimizes the redistribution of empty glass bottles from center M to the
The model considers several operational factors, such as vehicle suitability, saturation levels of each center, stock availability at M, and the priority of bottle types at the
The distribution process follows an ordered sequence. First, the plants with the lowest transport capacity are served to ensure fairness. As the process continues, the system dynamically reallocates resources to plants with greater capacity. This logic balances weekly flows and supports efficiency.
As displayed in Algorithm 3, Heuristic 2 evaluates whether the destination center exceeds its maximum saturation threshold. If this limit is surpassed, the distribution is halted to prevent overstocking. If saturation remains within acceptable limits, the heuristic checks truck availability at M to distribute both new and recycled bottles. The goal is to ensure that the remaining stock at M does not exceed the equivalent of 100 trucks. If the initial stock is already below this threshold, transport movements are adjusted based on defined priorities, reducing shipments when required. Conversely, if more than 150 trucks are available, additional inter-plant routes are enabled to maximize transport capacity.
Next, transport capacity is calculated and priority lists are generated for each destination center. These lists consider three main aspects: production planning, inter-plant debt, and projected shortages (warning products).
The allocation of bottles from M follows a three-block sequence: 1. New bottles, conditioned by predefined delivery routes and purchase volumes of each 2. Recycled bottles, prioritizing products with high production volumes and accumulated debt between 3. Additional shipments (without considering debt), executed only if residual transport capacity remains. This block focuses solely on production needs and includes new bottles, which do not generate debt.
Once distribution is completed according to priorities, the remaining stock at M is checked. If it does not fall below 100 trucks, an additional phase is activated (Algorithm 4). This step allocates extra transport resources from
In the additional phase (Algorithm 4), the number of trucks required to reach the threshold of 100 is calculated. These are then distributed evenly across
Even with extra trucks, sometimes it is not possible to lower M’s stock below 100 trucks. In those cases, the system returns the closest achievable value, ensuring maximum operational efficiency. A key principle is that recycled bottles are only moved when they reduce debt, while new bottles are transported only along predefined routes, without creating or reducing debt.

Enhancing transport planning with plant order permutations
This procedure aims to optimize the order in which production centers are served by evaluating all possible combinations of distribution sequences among plants, with the objective of identifying the sequence that minimizes inter-plant transport debt. In this way, the combination that achieves the greatest reduction in debt between facilities is selected, allowing the overall performance of the system without altering the logic of the underlying process. The algorithm begins by evaluating the original order O0, which is used as a baseline. Then, it generates all permutations of the remaining plants and executes the Heuristic 2. This heuristic computes an efficient transport plan from the central logistics hub, considering the distribution of both new and recycled bottles, and activates an additional transport phase if a saturation threshold is exceeded in the center M. For each evaluated order, the algorithm records the total inter-plant debt, the final truck stock in the center M, and the variation in the stock of new bottles compared to the initial state. The results of the permutations are ordered according to the level of debt to be resolved. The algorithm returns the plant order that results in the lowest inter-plant debt as the optimal solution. The main input parameters involved in the evaluation are: A: Set of available transport routes and capacities between facilities. It defines the initial logistical configuration of the system. D: Data on inter-plant truck debt. It reflects the imbalance of resources that the system aims to minimize. S: Initial truck stock at each plant. It represents the operational capacity available at the start of the evaluation. W: Set of supply or stock alerts. These define which products must be redistributed with higher priority.
This methodology, reflected in Algorithm 5, enables a systematic analysis of how the priority assigned to each production center affects the logistics performance of the system and provides a data-driven foundation for operational decision-making.

Results and discussion
Computational experiments
To evaluate the performance of the proposed heuristic, we developed a simplified MILP model in Gurobi that focuses on minimizing inter-plant bottle debt. As previously explained, this model does not capture several real-world constraints addressed by the heuristic, but it serves as a valuable benchmark. We implemented this model in Gurobi and compared its output with the solution provided by the heuristic. The results demonstrate a close match between both approaches, with an average bottle debt gap of around 1.8%. This indicates that the heuristic is capable of producing high-quality solutions while accommodating a more realistic and operationally complex version of the problem that is difficult to model directly using MILP. To support reproducibility and further research, we provide a test instance along with the MILP model implementation at: https://github.com/MarcEscoto/Empty-Bottle-Reallocation-Instance.
Automation of the decision-making process, integrating both heuristics, was carried out using Python. 36 This language was chosen due to its adaptability and efficiency in managing large volumes of data and facilitating the automation of operational decisions. Data processing and structured dataset analysis were supported by external libraries such as Pandas and NumPy. Once the implementation was complete, the outputs were reviewed weekly in collaboration with the company, comparing the algorithm’s proposed solutions against the real decisions made in practice.
The results obtained from Heuristic 1, which is responsible for covering stock shortages for production in the DR (Debt Reduction): The amount of inter-center transport debt reduced. MNB (Movements of New Bottles): The number of movements involving new empty bottles. TTU (Total Trucks Used): The total number of trucks employed, considering all vehicle types. TTM (Total Truck Movements): The total number of truck dispatches carried out. MCT (Center M Trucks: The number of trucks remaining at the central facility after execution. Weekly comparison between human decision and algorithm results across key performance indicators.

All KPIs, except for TTU, are measured in CCEs. TTU refers specifically to the absolute count of trucks used, regardless of load type. These metrics directly reflect the constraints and objectives integrated in the algorithm, such as: maximizing debt reduction, prioritizing the distribution of new bottles (which should therefore be depleted first), minimizing the total number of trucks used, and ensuring that no more than 100 trucks remain at the central facility upon completion. This comparison framework allows us to assess not only the feasibility of the solution but also its alignment with strategic logistical goals. Another important indicator for comparing solutions is the compliance with saturation constraints in the
In the evaluation of results, this condition is assessed exclusively for the movements proposed by Heuristic 2. The analysis shows that the algorithm consistently respects this constraint across all evaluated cases, whereas the human-defined solution satisfies the saturation condition in only one scenario. Figure 3 presents a comparative evaluation of the KPIs, where the results corresponding to the human decision-making are shown in blue, and those of the algorithm are shown in orange. In cases where the saturation constraint is not satisfied, the corresponding area in the radar plot is highlighted. Across all analyzed scenarios, the algorithm consistently significantly reduces inter-center transport debt more than manual planning. Radar plot of KPIs in various scenarios with human solution and algorithm solution.
The radar plots of the KPIs are designed so that the most favorable results appear on the outer edges of each axis, while less desirable outcomes are positioned closer to the center. As a result, the area enclosed by the plot visually indicates which solution performs better across the different indicators. In most of the analyzed cases, the algorithm’s results consistently appear in the outer regions of the chart, forming a larger area, which reflects superior performance compared to manual planning. In the few situations where the human solution appears to outperform the algorithm in specific KPIs, it is observed that the manual decision does not satisfy the saturation constraint. This invalidates its operational feasibility when compared to the algorithmic solution, which consistently adheres to all defined constraints.
Although satisfying the saturation constraint is essential to avoid operational disruptions, such as excessive stock levels in warehouses,the primary objective of this study is to minimize inter-plant transport debt. Figure 4 presents a comparative boxplot illustrating the performance of both the human (Meeting) and algorithmic solutions across all tested scenarios in terms of debt reduction. The comparison clearly shows that the algorithm consistently achieves better results. Its median debt reduction is substantially higher and even exceeds the upper quartile of the human decision-making process. This demonstrates the algorithm’s superior ability to reduce inter-plant debt while maintaining compliance with all operational constraints. Comparison of debt reduction between human planning and algorithmic solution in CCEs.
Another relevant result is that the movements of new bottles generated by the algorithm always comply with the defined constraints. Furthermore, in most scenarios, the algorithm can transport a greater quantity of new products compared to the human planning approach, as shown in the histogram in Figure 5. This indicates that the algorithm transports more recycled products, directly contributing to the reduction of inter-center debt and optimizes the distribution of the total stock available at the central logistics hub. As a result, it ensures a more efficient use of the available resources. Weekly comparison between human decision and algorithm results across key performance indicators.
Regarding the total truckloads remaining at center M, it is observed that in all analyzed scenarios, the algorithmic solution remains closer to the threshold of 100 trucks, which represents the operational constraint defined in the problem. This trend, illustrated in the dot diagram of Figure 5, confirms that the algorithm enhances resource distribution and manages available capacity more efficiently, consistently staying within the desired limits. Throughout the study, progressive adjustments were made to the model’s constraints and rules to improve alignment between algorithm-generated solutions and real operational decisions. Over more than 20 weeks of validation, Heuristic 1 consistently produced stable results, particularly in addressing stock alerts. However, stock distribution from the central logistics hub showed variability across weeks, influenced by factors such as seasonality, production changes, and fluctuations in bottle returns. To address these differences, additional constraints were introduced to better capture the system’s real dynamics, including plant-specific saturation limits and adjustments to transport availability. These enhancements improved the algorithm’s adaptability and contributed to more efficient and operationally aligned decision-making.
Once the algorithm replicating the company’s operational logic was developed, an improvement strategy was proposed based on the order in which resources are allocated. The problem was addressed as a sequential resource allocation model, where each resource is assigned only once and cannot be reassigned. In Heuristic 2, center M distributes products to four production plants, referred to as C1, C2, C3 and C4, following a fixed order.
All possible permutations of plant orderings were generated. The complete heuristic process was applied to each combination. The resulting inter-plant debt was then compared against both the original algorithm order and the company’s manual planning solution. Figure 6 presents these results. It shows that several alternative combinations lead to a greater reduction in debt than either the original order or the human decision. This confirms that the order in which resources are allocated significantly influences the final outcome. This improvement is particularly evident in scenarios where the central hub holds a limited amount of new product and a large volume of recycled stock. In such cases, changing the plant order allows for more efficient use of available resources. If a plant that requires only a specific product is scheduled last, it may not receive it because it was previously allocated to a more flexible plant. Adjusting the allocation sequence can help prevent such conflicts and lead to better overall performance. Comparison of solutions between algorithm and reality taking into account product, center in CCE.
Managerial insights
Managing the flow of products and returnable resources such as bottles presents ongoing operational challenges in large-scale manufacturing and distribution systems. When coordinating production across multiple plants, companies must deal with fluctuating demand, uneven resource availability, and tight dependencies between plants. While these complexities are well known, many companies continue to rely on slow, manual planning processes that often involve isolated departments and fragmented data updates.
37
However, this approach often leads to imbalanced inventory levels, bottle buildups in low demand centers, and delays that disrupt production schedules. To address these challenges, we have developed a heuristic-based decision support system. It combines automated alarm processing with dynamic bottle imbalance. The system continuously monitors inventory levels and return flows, categorizes alerts according to urgency, and reallocates resources to where they are most needed. This dual focus helps keep production stable while supporting more efficient use of recyclable packaging materials. Implementation in an actual beverage supply chain reveals several key benefits: Improved production continuity: By prioritizing shortages based on the level of urgency, the system ensures that critical plants are supported in a timely manner, thus reducing the risk of production disruption. Balanced use of recycled bottles: Instead of allowing bottles to overstock in certain locations, the system redistributes bottles based on production demand and bottle debts between plants. This reduces dependence on new bottle production and inventory imbalances. Lower operational costs and material waste: The better use of available resources, combined with optimized shipment planning, can reduce both transportation costs and unnecessary inventory. Faster, more consistent decision-making: The heuristic-based methodology can respond within seconds. This enables near real-time updates and minimizes the inconsistencies that often result from manual planning. Support for sustainability goals: The system promotes the reuse of bottles and facilitates the transportation of full loads (e.g., double-height trucks), contributing to lower emissions and improved environmental performance.
While this approach is designed for specific supply chains, its core principles (real-time prioritization, resource balancing and rules-based automation) have broad applicability. Furthermore, this framework can also benefit other industries that rely on reusable assets and operate under strict logistical constraints, such as retail, healthcare or circular economy systems.
Conclusions, limitations, and future research
This study presents an automated decision-support system focused on optimizing glass bottle transportation and inventory management within an industrial setting involving multiple production centers. Based on heuristic methods, the developed model structures logistics planning efficiently while considering key operational constraints, such as plant saturation levels, truck availability, and stock balancing across facilities. The methodology was designed with real-world operating conditions in mind, ensuring its practical applicability in complex industrial environments.
The results confirm that the algorithm accurately replicates the company’s operational planning and improves it systematically. Heuristic 1 ensures full coverage of production demand in all evaluated scenarios without generating logistical conflicts. Meanwhile, Heuristic 2 demonstrates a superior capacity to reduce inter-center debt by improving stock redistribution and maximizing the use of recycled bottles. In all cases, the algorithm rigorously complies with defined constraints, such as saturation limits per plant and the maximum capacity allowed at center M. Additionally, the model adapts to variable operational conditions and delivers solutions quickly and consistently, with computation times of under 5 s. When compared with manual planning, the algorithm achieves better outcomes across most key performance indicators, including debt reduction, new product usage, and transportation efficiency.
An additional relevant contribution of this study is the evaluation of the impact of resource allocation order. Since the problem is framed as a sequential allocation model, the results show that changing the order in which plants receive products can significantly influence the final outcome. In scenarios characterized by high volumes of recycled stock and limited availability of new bottles, reordering plant priorities enables greater debt reduction by making more efficient use of limited resources.
Overall, the implementation of the heuristic system represents a robust alternative to manual planning, offering consistency, efficiency, and adaptability in the face of operational changes. As a future line of work, the integration of predictive models could improve demand forecasting and help anticipate production variations. Moreover, extending the current framework to incorporate additional sources of uncertainty (such as transportation disruptions or unexpected logistical fluctuations) would further enhance the system’s robustness. In line with recent advances, future research could also explore the application of data-driven methods and artificial intelligence techniques, particularly large language models (LLMs), to better understand, predict, and optimize logistical behavior, as suggested in recent studies. 38 Although this study focuses on a specific industrial case, the proposed methodology can be adapted to other logistical contexts, such as distribution, retail, or circular economy systems. The notation used in the mathematical formulation is summarized in Tables 2–6 of this appendix.
Footnotes
Funding
The authors disclosed receipt of the following financial support for the research, authorship, and/or publication of this article: This research was partially funded by the Spanish Ministry of Science and the Spanish Research Agency (PID2022-138860NB-I00, RED2022-134703-T).
Declaration of conflicting interests
The authors declared no potential conflicts of interest with respect to the research, authorship, and/or publication of this article.