
Abstract
Virtual Reality (VR) is increasingly recognized as a transformative technology in the construction industry, offering numerous benefits. However, its adoption faces challenges, particularly in developing countries, where various barriers impede effective implementation. This study aims to bridge this gap by introducing a statistical model that examines the relationship between overcoming VR Challenges (VRCs) and realizing VR Benefits (VRBEs) in these regions. The study is conducted in four phases: the first two phases involve systematic searches and scientometric analyses to provide a comprehensive assessment of VR in construction. The third phase includes a questionnaire survey targeting industry practitioners to evaluate VRCs and VRBEs. The final phase employs exploratory factor analysis to categorize VRCs, followed by Partial Least Squares-Structural Equation Modeling (PLS-SEM) to test hypotheses and examine variable correlations. Additionally, the Measurement of Alternatives and Ranking using the Compromise Solution (MARCOS) is utilized to prioritize VRCs and VRBEs. The PLS-SEM findings reveal that overcoming VRCs has a positive and significant impact on realizing VRBEs. Moreover, the MARCOS results indicate that the lack of technical expertise emerges as the most important challenge, while the incorporation of the labor process is identified as the leading benefit during the pre-contract stage. This research offers valuable insights for construction industry stakeholders, providing a framework to effectively integrate VR into organizational practices and enhance project outcomes.
Introduction
The construction industry is a key economic engine, playing a significant role in the infrastructural development of communities worldwide.1,2 It contributes approximately 13% to the global gross domestic product, highlighting its vital importance in both economic performance and societal well-being. 3 Considering national development objectives, many developing countries have introduced substantial reforms within their construction sectors. These changes aim to improve project outcomes and meet the growing demand for infrastructure and development projects. 4 However, these transformations have encountered setbacks, often adding strain to national economies and contributing to the suspension or slowing of various privately funded projects. In response, some policymakers are seeking to diversify their economies by expanding investments in infrastructure and manufacturing as alternative paths to growth. 5
The demand for construction in developing nations differs significantly from that in developed countries, yet it represents a broad and growing market. Despite this potential, the industry in these regions remains largely uncompetitive, struggling to meet international quality standards. 6 Construction projects often face challenges such as incomplete execution, frequent delays, budget overruns, low productivity, and a high likelihood of failing to meet intended goals.7–9 Furthermore, the construction industry in these regions is plagued by persistent inefficiencies, communication breakdowns, and errors, which can inflate construction costs by up to 30%. These challenges are often compounded by delayed design changes and poor decision-making, ultimately resulting in significant cost and schedule overruns.10,11 Limited investment in the sector further exacerbates these issues, leading to many projects being suspended or canceled. 12
Overall, the construction industry in developing countries falls short of meeting the needs of governments, clients, and communities, leaving it lagging other sectors both domestically and compared to international counterparts. Nevertheless, opportunities in construction, particularly for roads and housing, are promising, driven by increasing population pressures and the demand for further investment in these areas. Addressing these issues is critical to unlocking the full potential of the construction sector.
In recent years, advanced technologies such as Virtual Reality (VR) have emerged as transformative tools to address these challenges. 13 VR, defined as a combination of headsets, computer-generated models, and immersive environments, offers a near-real experience of construction projects before they are physically built. 14 This technology has the potential to revolutionize stakeholder collaboration, design visualization, and project execution, thereby mitigating inefficiencies, miscommunication, and costly errors. 15
Through interactive and immersive 3D environments, VR allows stakeholders to conduct unlimited digital walkthroughs, which enhances design understanding and improves constructability. This ultimately leads to better decision-making and reduces the need for changes during execution.16,17 Furthermore, VR helps identify challenging aspects from design documents during reviews, such as insufficient maintenance space, installation clashes, and simulates construction processes for effective management and planning. 18 These capabilities make VR an invaluable tool for improving project outcomes.
The application of VR extends across multiple domains within the construction industry. It enhances safety management, particularly in high-risk operations such as tower crane activities 19 and construction site safety training.20,21 Additionally, VR supports risk management, design development, and project delivery, allowing stakeholders to identify and address issues early in the design phase. 22
Despite these advantages and applications, the adoption of VR remains uneven. Developed countries like the United Kingdom and the United States lead the way, while developing countries lag significantly behind. The global VR market is projected to reach $80 billion by 2025. 23 However, the application and integration of VR in developing countries present unique challenges. These nations face multifaceted and deeply ingrained barriers, including limited resources, infrastructural challenges, and economic disparities, which impede the widespread adoption of VR technology. 24
The limited adoption of VR in developing countries is further underscored by the absence of these countries among the top ten countries actively researching VR applications in the construction industry, as shown in Figure 1. This gap highlights the urgent need for enhanced research collaboration and participation to harness the full benefits of VR in these countries. Furthermore, although existing studies have provided important insights into the benefits and barriers associated with VR adoption, many often concentrate on isolated factors, neglecting the broader implications and interrelated elements that contribute to successful implementation. This narrow focus limits the understanding of how various components interact and affect the overall adoption process. Finally, there is a notable methodological gap in literature, as no previous study has successfully employed both Partial Least Squares-Structural Equation Modeling (PLS-SEM) and Measurement of Alternatives and Ranking according to the Compromise Solution (MARCOS) to provide a holistic analysis. Active countries in VR research.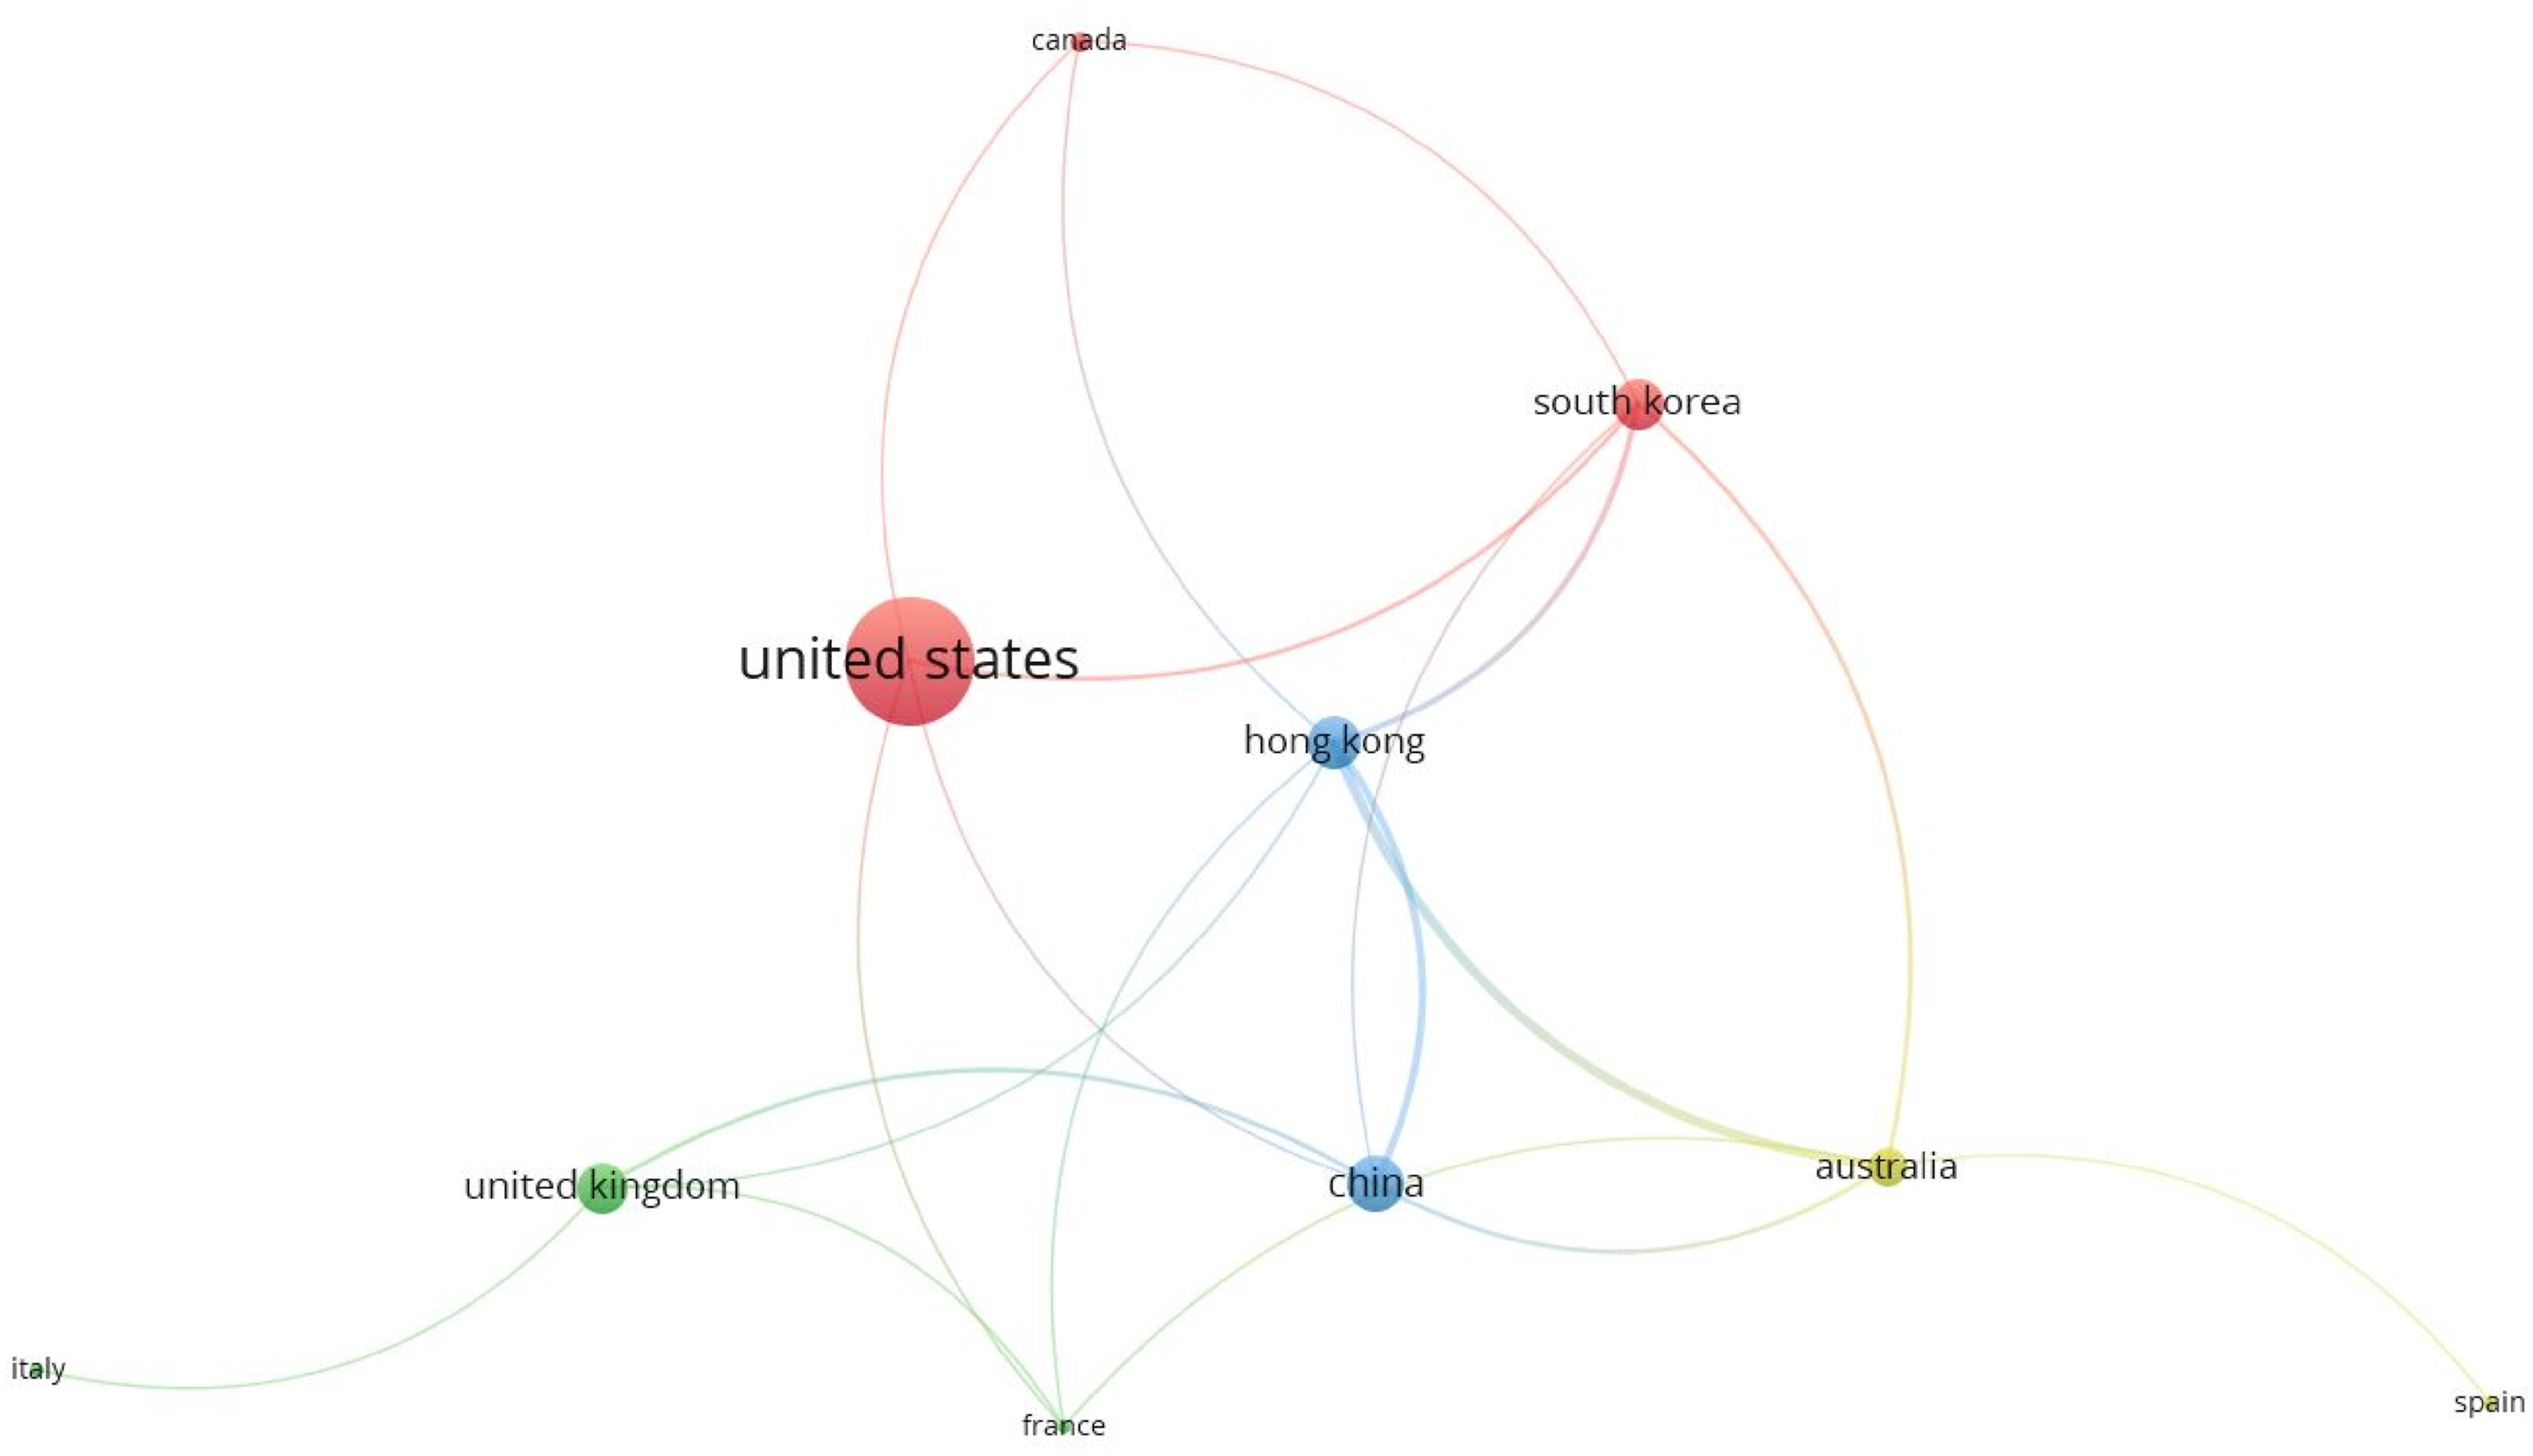
This study aims to bridge these gaps by investigating the effects of overcoming VR Challenges (VRCs) on the successful implementation of VR in the construction industry of developing countries, with the goal of unlocking its associated benefits. This aim can be achieved through the following objectives: (a) systematically identifying the various VRCs that hinder VR implementation in developing countries; (b) systematically identifying the benefits of VR implementation in developing countries; (c) classifying and categorizing the VRCs using the Exploratory Factor Analysis (EFA) approach; (d) examining the relationship between overcoming VRCs and achieving VR Benefits (VRBEs) using the PLS-SEM approach; and (e) prioritizing and ranking VRCs and VRBEs using the MARCOS method.
The novelty of this research lies in the introduction of a unique framework designed to test a distinctive hypothesis regarding VRCs and VRBEs, an area that has not been previously explored in this context. Additionally, this study prioritizes the various VRCs and VRBEs, providing a comprehensive approach to enhance the understanding and implementation of VR technology in the construction industry of developing countries. This combination of innovative methodologies provides a valuable contribution to the field, with significant implications for policymakers, industry practitioners, and researchers aiming to integrate VR into construction practices in developing countries.
Literature review
VR applications in different domains
VR is an immersive technology that creates simulated environments, enabling users to interact with 3D spaces and objects. Its versatility has led to widespread adoption across various fields, including but not limited to education, healthcare, industry, and construction, fundamentally transforming traditional practices and enhancing user engagement.
In the education sector, VR offers unique opportunities for interactive learning experiences. For example, Wang et al. 25 investigate the integration of VR technology in civil engineering education, highlighting its transformative potential in teaching methodologies. The study demonstrates how VR can enhance student engagement and deepen understanding of complex engineering concepts. The researchers developed a VR teaching model featuring a 3D simulation of a structural steel foot column, enabling students to visualize and interact with engineering processes effectively. Their findings reveal that this model significantly improves comprehension and skill retention, allowing for repeated practice in a safe environment. However, the research study has certain limitations. Its focus on a specific VR model may restrict generalizability across all civil engineering disciplines.
In Education, Lin et al. 26 present a comprehensive exploration of the applications of VR in education, focusing on three key areas: educational games, art education, and political education. The paper aims to establish a framework for effectively integrating VR technology into these contexts, underscoring its potential to enhance engagement and improve learning outcomes. The methodology includes a descriptive analysis of existing VR applications and their effectiveness, bolstered by literature reviews and practical examples. The findings demonstrate that VR can create immersive and interactive learning environments, fostering creativity and facilitating a deeper understanding of complex concepts. However, the study also identifies several barriers. The current maturity of VR applications in education may not adequately address psychological issues or provide the tailored guidance students need. Additionally, challenges related to technology implementation and the necessity for supportive environments, such as dedicated VR art studios, are emphasized.
In the healthcare sector, VR is redefining training and patient care through its immersive capabilities. For instance, Javaid and Haleem 27 examine the application of VR in the medical field, emphasizing its transformative potential across various domains, including training, diagnosis, and treatment. The paper offers a comprehensive review of relevant studies, identifying numerous applications of VR technology in healthcare and elucidating how it can enhance the learning experience for medical professionals. The findings highlight significant benefits, such as improved surgical skills, better patient outcomes, and effective pain management. For example, VR training enables medical professionals to practice complex procedures in a risk-free environment, ultimately enhancing their proficiency and confidence. However, the study also acknowledges several barriers to the widespread application of VR in this field, including the high costs associated with implementation and the need for extensive software and hardware support.
Additionally, the adoption of VR technologies in the healthcare sector is accompanied by important health-related challenges. One of the most pressing concerns involves Virtual Reality Induced Symptoms and Effects (VRISE), a set of symptoms including nausea, eye strain, disorientation, headaches, and decreased cognitive performance.28,29 These symptoms primarily stem from sensory conflicts between visual and vestibular inputs, device-related factors such as latency and field of view, and ergonomic issues associated with Head-Mounted Displays (HMDs). Notably, even short VR sessions (5–8 min) can trigger discomfort in susceptible individuals.
To mitigate these risks, several strategies have been proposed. These include limiting session durations, ensuring ergonomic adjustment of HMDs, and incorporating recovery periods post-use. Technical improvements such as dynamic content blurring, Carnegie and Rhee 30 optimized navigation speeds, enhanced audiovisual quality, and reduced latency have also shown promise in reducing VRISE symptoms. Kourtesis et al. 31 further recommend moderate-length sessions (55–70 min) with gradual acclimation, along with improvements in software design, graphics, and instructional clarity to reduce user discomfort and promote broader adoption. Addressing these health considerations is essential for enhancing user safety and overcoming a critical barrier to the widespread use of VR in both healthcare and construction sectors.
In the industrial sector, VR is revolutionizing design processes and enhancing efficiency. For instance, Eswaran and Bahubalendruni 32 critically examine the challenges and opportunities presented by Augmented Reality (AR) and VR technologies within manufacturing systems, especially in the context of Industry 4.0. Their paper provides a comprehensive review of various AR/VR applications across manufacturing activities, emphasizing how these technologies can enhance product design, assembly, maintenance, and quality control processes. The study highlights several benefits, including significant reductions in training times, increased productivity, and improved quality assurance. However, the authors also identify key limitations, such as issues with tracking accuracy, registration challenges, and ergonomic concerns related to prolonged device usage. Furthermore, the study addresses the practical challenges of implementing AR/VR systems in real-world manufacturing environments, primarily stemming from technological constraints and organizational resistance.
Additionally, 33 reviews the applications of VR in industrial practice, particularly within enterprises, offering critical insights into how VR technology can enhance operational efficiency and training. Utilizing a qualitative methodology, the research includes a comprehensive review of existing VR applications and consultations with companies specializing in VR solutions. The findings reveal diverse applications of VR across various industries, including manufacturing, logistics, and safety training. These applications demonstrate significant benefits, such as improved training effectiveness, enhanced safety, and better operational management. However, the study also highlights challenges, particularly the nascent stage of VR adoption in the industry and the scarcity of practical examples currently available. This indicates that while VR holds substantial promise, further exploration and broader implementation are essential to fully harness its potential in industrial settings.
Finally, in the construction sector, the integration of VR technology offers transformative potential. For instance, Kapoor 34 offers a comprehensive exploration of VR applications in the construction industry, emphasizing its potential to enhance both project effectiveness and safety. The study provides a qualitative review and detailed analysis of current VR technologies, focusing on their applications in design assessment, project planning, and safety training. It illustrates how VR can facilitate virtual walkthroughs and simulations, improving the understanding and identification of design flaws before construction begins. The findings indicate that VR can significantly enhance stakeholder engagement, hazard identification, and training efficiency in construction projects. However, the study also acknowledges several limitations, including a lack of empirical data supporting the effectiveness of VR in real-world construction scenarios. Additionally, challenges related to the implementation of VR technologies, such as cost and user acceptance, may hinder its widespread adoption.
Moreover, Akindele et al. 35 analyze the applications of VR in construction health and safety. The study provides a comprehensive overview of how VR technologies can enhance safety practices in the construction industry, highlighting their potential for hazard identification and safety training. The findings reveal a growing interest in VR applications within health and safety, showcasing significant advancements in immersive, desktop-based, Building Information Modeling (BIM)-based, and AR technologies. Key themes identified in the study include hazard identification and the effectiveness of VR training programs in preparing workers for real-world scenarios. However, the study also addresses challenges that could impede widespread adoption, such as infrastructure limitations and health concerns related to prolonged VR use.
Challenges impeding VR implementation in the construction industry
Despite the growing significance of VR in the construction industry, particularly its wide-ranging applications in project visualization, design collaboration, and immersive safety training, several barriers continue to impede its widespread adoption. These include high implementation costs, technical constraints, limited user accessibility, and a lack of standardized integration protocols within existing workflows. For instance, Laurell et al. 36 investigate the barriers to the adoption of VR technology by employing social media analytics and machine learning to assess user perceptions and identify critical factors influencing adoption. The study enhances the understanding of VR technology diffusion by systematically analyzing user-generated content related to leading VR headsets, specifically the Oculus Rift and HTC Vive. The findings reveal that discussions predominantly focus on the technology and network externalities associated with VR, indicating that insufficient performance and a lack of complementary applications hinder adoption. Although price and trialability discussions were less frequent, they still posed significant barriers. However, the study has its limitations, including a focus on Swedish social media, which may restrict the generalizability of the findings to other contexts. Additionally, the reliance on user-generated content means that perceptions may not always reflect objective realities, potentially skewing the analysis.
Ghobadi and Sepasgozar 37 explore the adoption of VR technology in the construction industry, identifying key barriers and potential drivers for its increased use. This study enhances the understanding of VR adoption by exploring user perspectives, particularly among students and academic staff. It highlights critical factors influencing acceptance, such as performance expectancy, effort expectancy, and social factors. The authors employed semi-structured interviews and thematic analysis to categorize responses and identify barriers to VR adoption in the construction sector. The findings indicate that while participants view VR as beneficial for training and productivity, significant barriers remain, including high costs, technical challenges, and accessibility issues. Participants also noted emotional resistance among older workers, suggesting that age and experience affect technology acceptance. However, the study has limitations, including a small sample size and a narrow demographic focus, which may restrict the generalizability of the findings. Furthermore, the use of only one type of VR application may have influenced participant responses, highlighting the need for further research to explore a broader range of VR technologies in the construction industry.
Delgado et al. 13 systematically investigate the drivers and hindering factors affecting the adoption of AR and VR technologies in the construction industry. This research enhances the understanding of AR and VR adoption by identifying and categorizing 42 factors that influence their use, providing a clear framework for stakeholders to address barriers and leverage drivers for technology adoption. The authors employed a mixed-methods approach, combining qualitative focus group discussions with quantitative data collected through a questionnaire administered to 54 experts from various sectors within the construction industry. Principal component analysis was used to group the identified factors into manageable categories. The findings reveal that the primary barriers to adoption include high hardware costs and training, fears of job insecurity, training requirements, perceptions of technology immaturity, and other specific implementation challenges. Despite these contributions, the study has several limitations. Its focus on the UK construction sector may restrict the generalizability of the findings to other regions. Additionally, the reliance on expert opinions may introduce bias, as the perspectives of end-users were not extensively captured.
Bakhoum et al. 38 investigate the implementation of VR technology in the Egyptian construction industry, assessing its impact and identifying barriers to adoption. This study systematically evaluates both the benefits and barriers associated with its adoption. It highlights how VR can improve project delivery, design reviews, and stakeholder collaboration. The authors employed a mixed-methods approach, combining qualitative focus group discussions with quantitative surveys. The results of the surveys were then analyzed using Analysis of Variance (ANOVA). The findings indicate that VR has a high perceived impact on project objectives, scoring an average of 4.24. Key benefits identified include improved design coordination, early detection of issues, and enhanced communication among stakeholders. In contrast, key barriers such as high initial costs, lack of technological familiarity, and resistance to change within the industry are considered significant barriers. However, the study has some limitations, including a focus on a specific geographical area, which may affect the generalizability of the findings. Additionally, the sample size, while adequate for ANOVA, may not fully capture the diverse perspectives of all stakeholders in the construction sector.
Maqsoom et al. 23 systematically examine the drivers and barriers influencing the adoption of Mixed Reality (MR) technologies, encompassing both AR and VR in the construction industry of developing countries. This study identified and ranked a total of 37 barriers and 41 drivers, offering a structured overview that helps stakeholders understand the complexities involved in MR. A mixed-methods approach was employed, beginning with an extensive literature review followed by a quantitative survey distributed to 220 professionals across relevant sectors. The Relative Importance Index (RII) was utilized to assess and rank the significance of each factor. The results indicate that the most critical barriers to MR adoption include high initial capital investment, perceptions of technological immaturity, insufficient market demand, lack of expert support, and user health concerns. On the other hand, key drivers identified include cost reduction, enhanced project understanding, low-cost training simulations, reduced development costs, and improved user experience. Despite its valuable insights, the study has notable limitations. The use of RII, while effective for prioritization, is an old statistical analysis for ranking. Additionally, it does not evaluate the interdependence among various factors influencing adoption, and it may oversimplify the complexities involved.
Seyman-Guray and Kismet 39 explore the drivers and barriers to implementing Extended Reality (XR), which includes AR, VR, and MR technologies in the construction industry within Turkey, contributing valuable insights. The study adopts a quantitative approach involving a survey of 33 companies to assess their current engagement with XR technologies, as well as their future plans and perceptions regarding implementation challenges and benefits. The authors employed statistical tools such as SPSS, frequency analysis, mean score, standard deviation, and one-sample t-test data analysis. The results reveal that key drivers, including increased efficiency and enhanced communication and coordination, are among the most significant drivers, while the primary barriers include technical limitations, high costs, and a lack of qualified professionals. However, the study has several limitations, such as its focus on Turkey, which restricts generalizability to other developing countries, and the relatively small sample size, which may limit the robustness of the findings. Additionally, the reliance on self-reported data could introduce bias.
Hong et al. 40 explore the barriers to the adoption of VR technologies in construction activities within China’s construction industry. The study employs qualitative research design, utilizing semi-structured interviews with professionals from various segments of the Architecture, Engineering, and Construction (AEC) sector. Through thematic analysis supported by open coding and categorization techniques, the authors identify three major clusters of barriers, including technical, economic, and social limitations, each encompassing sub-themes, such as lack of technical expertise, high costs of implementation, and resistance to change among stakeholders. The findings highlight that while awareness of VR’s potential is growing, its practical application remains limited due to systemic issues, including fragmented supply chains, insufficient technical depth, and a lack of standardized workflows. However, the research study has several limitations. Its focus on China restricts the generalizability of findings to other national contexts. Additionally, the reliance on qualitative data from a relatively small sample limits the ability to generalize conclusions across the broader AEC industry.
Finally, Mbaraja et al. 41 investigate the factors hindering the adoption of VR for construction workers’ skills training in Zimbabwe. The study categorized key barriers into five main categories: organizational and training-related inadequacies, awareness and operational constraints, funding and management-related obstacles, governmental policy deficiencies, and technological limitations. The authors employed a qualitative approach through semi-structured interviews with industry experts, trainers, and construction professionals. Thematic analysis was used to interpret the data and identify recurring patterns and themes influencing VR adoption in training settings. The findings reveal that lack of organizational support, insufficient funding, limited awareness of VRBEs, inadequate government policies, and poor technological infrastructure are the most significant impediments to effective implementation of VR-based training programs. However, the research study has several limitations. Its reliance on qualitative methods limits the generalizability of findings and precludes statistical validation of the identified factors. Additionally, the focus on Zimbabwe restricts applicability to other developing countries with differing socio-economic and technological landscapes.
Comprehensive summary of existing literature on barriers to VR adoption in the construction industry across developed and developing countries.

Challenges facing VR practices.

Benefits of VR implementation in the construction industry
VR has attracted substantial interest within the construction industry due to its transformative potential in enhancing design visualization, improving project planning, facilitating immersive training, and fostering more effective stakeholder communication. For instance, Wang et al. 42 presents an innovative approach to quantity surveying education by integrating VR with BIM to enhance students’ understanding of construction processes and cost estimation. Its primary contribution lies in developing a user-friendly, immersive VR-BIM system that allows learners to navigate 3D building models, visualize structural components, and perform quantity take-offs in a more intuitive and engaging manner than traditional 2D drawing-based methods. The methodology involved creating a prototype system using Autodesk Revit for BIM modeling and Unity 3D for VR integration, followed by usability testing and feedback collection from students and educators through surveys and interviews. The results demonstrated that the immersive VR-BIM system significantly improved students’ spatial understanding, engagement, and accuracy in quantity surveying tasks, while also reducing cognitive load associated with interpreting 2D plans. However, the study has limitations: it focused only on architectural elements without incorporating detailed 3D structural modeling (e.g., beams, columns), and its sample size was relatively small, limiting broader generalizability. Additionally, the system’s reliance on specific software platforms may pose accessibility challenges in resource-constrained educational settings.
Ahmed 43 presents a comprehensive review of the opportunities and applications of AR and VR in construction project management, contributing to the growing discourse on immersive technologies in the AEC industry. The study systematically categorizes existing research into thematic areas such as project planning, design validation, safety management, quality control, and collaboration, highlighting how AR and VR enhance decision-making, visualization, and communication throughout the project lifecycle. The findings illustrate that AR and VR offer significant potential to improve project scheduling, progress tracking, worker training, safety management, and quality control by providing real-time visualization and immersive learning environments. Additionally, these technologies enhance project visualization, support worker training through simulations, improve safety preparedness by replicating hazardous scenarios, and aid in identifying quality issues early in the construction process. Despite its comprehensive synthesis of existing knowledge, the study has several limitations: it does not incorporate a meta-analysis or critically evaluate the methodological rigor of the reviewed studies, and its focus remains primarily descriptive rather than prescriptive.
Sangeetha et al. 44 explore the application of VR technology in the construction design process, aiming to enhance client-builder communication and improve satisfaction. The study’s key contribution lies in proposing a practical VR-based framework that transforms traditional 2D architectural plans into interactive 3D environments, allowing clients to experience their future buildings from a first-person perspective. The methodology involves converting 2D blueprints into 3D models with accurate spatial dimensions, integrating dynamic elements such as furniture and appliances through coding, and rendering the final simulation compatible with VR headsets for immersive navigation. The results demonstrate that this approach significantly improves client understanding and engagement, facilitates real-time design modifications, and reduces the risk of costly post-construction changes or demolitions due to dissatisfaction. However, the study has certain limitations: it lacks empirical validation or user testing data to quantify the effectiveness of the VR system in real-world construction settings. Additionally, it does not address potential implementation challenges such as the technical expertise required, computational demands, or scalability across larger or more complex projects.
Rokooei et al. 45 provide a comprehensive analysis of the opportunities and challenges associated with integrating VR into construction processes. The study’s key contribution lies in identifying and categorizing 21 challenges and 23 benefits, grouped into five and four thematic categories, respectively. This categorization offers stakeholders a structured understanding of VR’s implications in the construction industry. The methodology involved conducting expert surveys and interviews, drawing insights from 57 VR professionals to assess the relevance and impact of each identified factor through quantitative scoring. The results indicate that while VR offers significant advantages, such as improved decision-making, flexible visualization systems, and enhanced access to project models, major challenges persist, including high initial costs, resistance to change, and insufficient expertise. Despite its methodological rigor, the study has certain limitations: it relies on subjective expert opinions rather than empirical data, which may limit the generalizability of the findings. Furthermore, it does not explore specific implementation strategies or long-term impacts across different types of construction projects.
Oke et al. 46 explore the benefits of VR adoption in the construction industry within a developing economy, offering valuable insights into how VR can enhance project outcomes in resource-constrained and rapidly evolving construction environments. The study used structured questionnaires administered to built-environment professionals to collect the data. EFA and MARCOS approaches were used to catgorize and rank key benefits associated with VR use. The EFA results indicate that these benefits can be grouped into six distinct categories adopted in this study: (1) Risk Management and Digitalization (RMD); (2) Resource Management (RM); (3) Design Flexibility and Reputation (DFR); (4) Quality Control and Sustainability (QCS); (5) Post-contract Stage Planning (PO-CSP); and (6) Pre-contract Stage Planning (PR-CSP). Furthermore, the MARCOS findings reveal five principal benefits, including improved communication and collaboration, enhanced project performance, better risk identification, increased digitalization, and more effective safety planning. However, the study has a notable limitation. While the analytical methods employed (i.e, MARCOS and EFA) are robust, they may not fully capture the complexity of VR implementation challenges or contextual nuances specific to developing economies.
Mohammadi and Martins 47 introduces a novel cost-benefit analysis framework to support decision-making regarding the adoption of VR technologies in the construction industry. Its primary contribution lies in systematically identifying and categorizing both tangible and intangible costs and benefits associated with VR implementation, offering stakeholders a structured financial evaluation tool under conditions of uncertainty. The methodology integrates literature-based input variables with Monte Carlo simulation techniques using the @Risk add-in for Microsoft Excel, allowing for probabilistic modeling of net benefits by simulating various scenarios based on synthetic data. The results indicate that, despite high initial investment costs, VR implementation can yield positive net benefits over time, particularly through long-term savings in design revisions, rework reduction, improved safety training, and enhanced client communication. However, the study has notable limitations: it relies heavily on assumptions and synthetic data rather than real-world case studies or empirical validation, which may affect the generalizability and accuracy of the model’s predictions. Additionally, the model does not account for qualitative factors such as user resistance or organizational readiness, which can significantly influence VR adoption success.
An extensive summary of the literature on the benefits of VR adoption within the construction industry.

VR benefits.

Research gaps and model development
The literature review conducted on VR technologies within the construction industry reveals significant trends and insights, particularly in several developed countries and most developing nations. The research covers a range of topics, including barriers to adoption, factors and drivers influencing the implementation of VR, and the benefits associated with its adoption in this sector. Among the 14 studies discussed, eight focused on barriers, representing 57% of the total, while six examined the benefits, accounting for 43%. This distribution underscores an urgent need to address these obstacles to fully realize the benefits of VR in construction.
Across all studies addressing VR challenges, high costs consistently emerged as a predominant barrier. Both developed countries, such as Sweden, Australia, and the UK, and developing nations like Egypt, Turkey, and China, emphasize the significant initial cost required for implementing VR technology. This commonality highlights the need for strategies to mitigate financial barriers and promote the adoption of VR in the construction sector. In contrast, studies from developing nations identify additional barriers such as a lack of technological familiarity, insufficient qualified professionals, low market demand, and fragmented supply chains. These factors underscore the systemic issues faced in these regions, where foundational technological infrastructure may be lacking. Addressing these challenges is crucial for fostering the successful adoption of VR technologies in the construction industry and ensuring that these nations can fully benefit from the advancements that VR offers.
On the other hand, among all the studies focusing on the benefits and opportunities of VR, the most commonly identified benefits include enhanced communication and engagement, improved decision-making and collaboration, training and safety improvements, and real-time visualization and progress tracking. These benefits highlight the transformative potential of VR technologies in the construction sector. The implementation of VR can significantly enhance overall efficiency and project outcomes in the industry. This is achieved through better interactions among stakeholders, fostering collaborative problem-solving, providing immersive training experiences, and enabling real-time monitoring of projects. Such integration of VR not only streamlines processes but also contributes to safer and more effective construction practices.
Regarding the methodologies applied in the studies discussing barriers and benefits, there is a wide variation that includes both qualitative and quantitative analyses. Common qualitative methods include semi-structured interviews, focus groups, and literature reviews, which gather in-depth insights. On the quantitative side, studies often rely on questionnaire surveys for data collection. Analysis methods include RII, ANOVA, frequency analysis, mean score, EFA, and MARCOS. Additionally, other methods such as BIM, Unity 3D, and Monte Carlo simulation are also implemented, showcasing the diverse approaches used to explore the implications of VR technologies in the construction industry.
Nevertheless, no prior research has effectively utilized a hybrid analysis that integrates PLS-SEM with MARCOS, underscoring a notable methodological gap that presents a remarkable opportunity for advancement in the field. This innovative approach could significantly enhance the depth and rigor of studies, facilitating a more nuanced understanding of complex interactions within the research landscape. While existing studies have delivered important insights into the benefits and barriers associated with VR adoption, many often concentrate on isolated factors or a single aspect, neglecting the broader implications and interrelated factors that contribute to successful implementation. Additionally, based on the data presented in Figure 1, the adoption of VR in developing countries remains limited. This limitation is highlighted by their absence from the top ten countries actively engaged in researching VR technology within the construction sector. This gap signals an urgent need for improved research collaboration and participation to fully capitalize on the benefits of VR in these regions. Strengthening these efforts could lead to enhanced knowledge sharing and more effective implementation of VR technologies in the construction industry.
Consequently, there is a pressing need for a more comprehensive exploration of the specific obstacles that impede VR adoption in developing nations, as well as an investigation into the potential benefits that could arise from this significant transition. Addressing these areas can lead to more effective strategies for leveraging VR technologies in the construction industry. To this end, this study aims to address these gaps by integrating PLS-SEM and MARCOS to leverage their complementary strengths. This approach is intended to establish a more robust analytical framework that combines two distinct statistical techniques: one that tests hypotheses and examines the relationships between overcoming barriers and realizing benefits, and another that ranks these barriers according to their significance. This integration contributes to the development of a novel methodological standard in the field. Furthermore, this study focuses on two key aspects: identifying the challenges that hinder the adoption of VR technologies and determining the associated benefits, while also exploring the interconnection between them within the construction industry of developing countries. This methodology provides a comprehensive framework for understanding how the mitigation of these challenges interacts with and influences the outcomes of technology adoption, ultimately contributing to the development of more effective strategies for implementing VR solutions in the sector.
Once the key challenges impacting the adoption of VR technologies and their associated benefits in developing countries have been identified, the next important step is to develop a comprehensive model that analyzes the relationship between these challenges and benefits. This model is represented in Figure 2, illustrating the conceptual model that encompasses these relationships. Developed conceptual model for VRCs and VRBEs.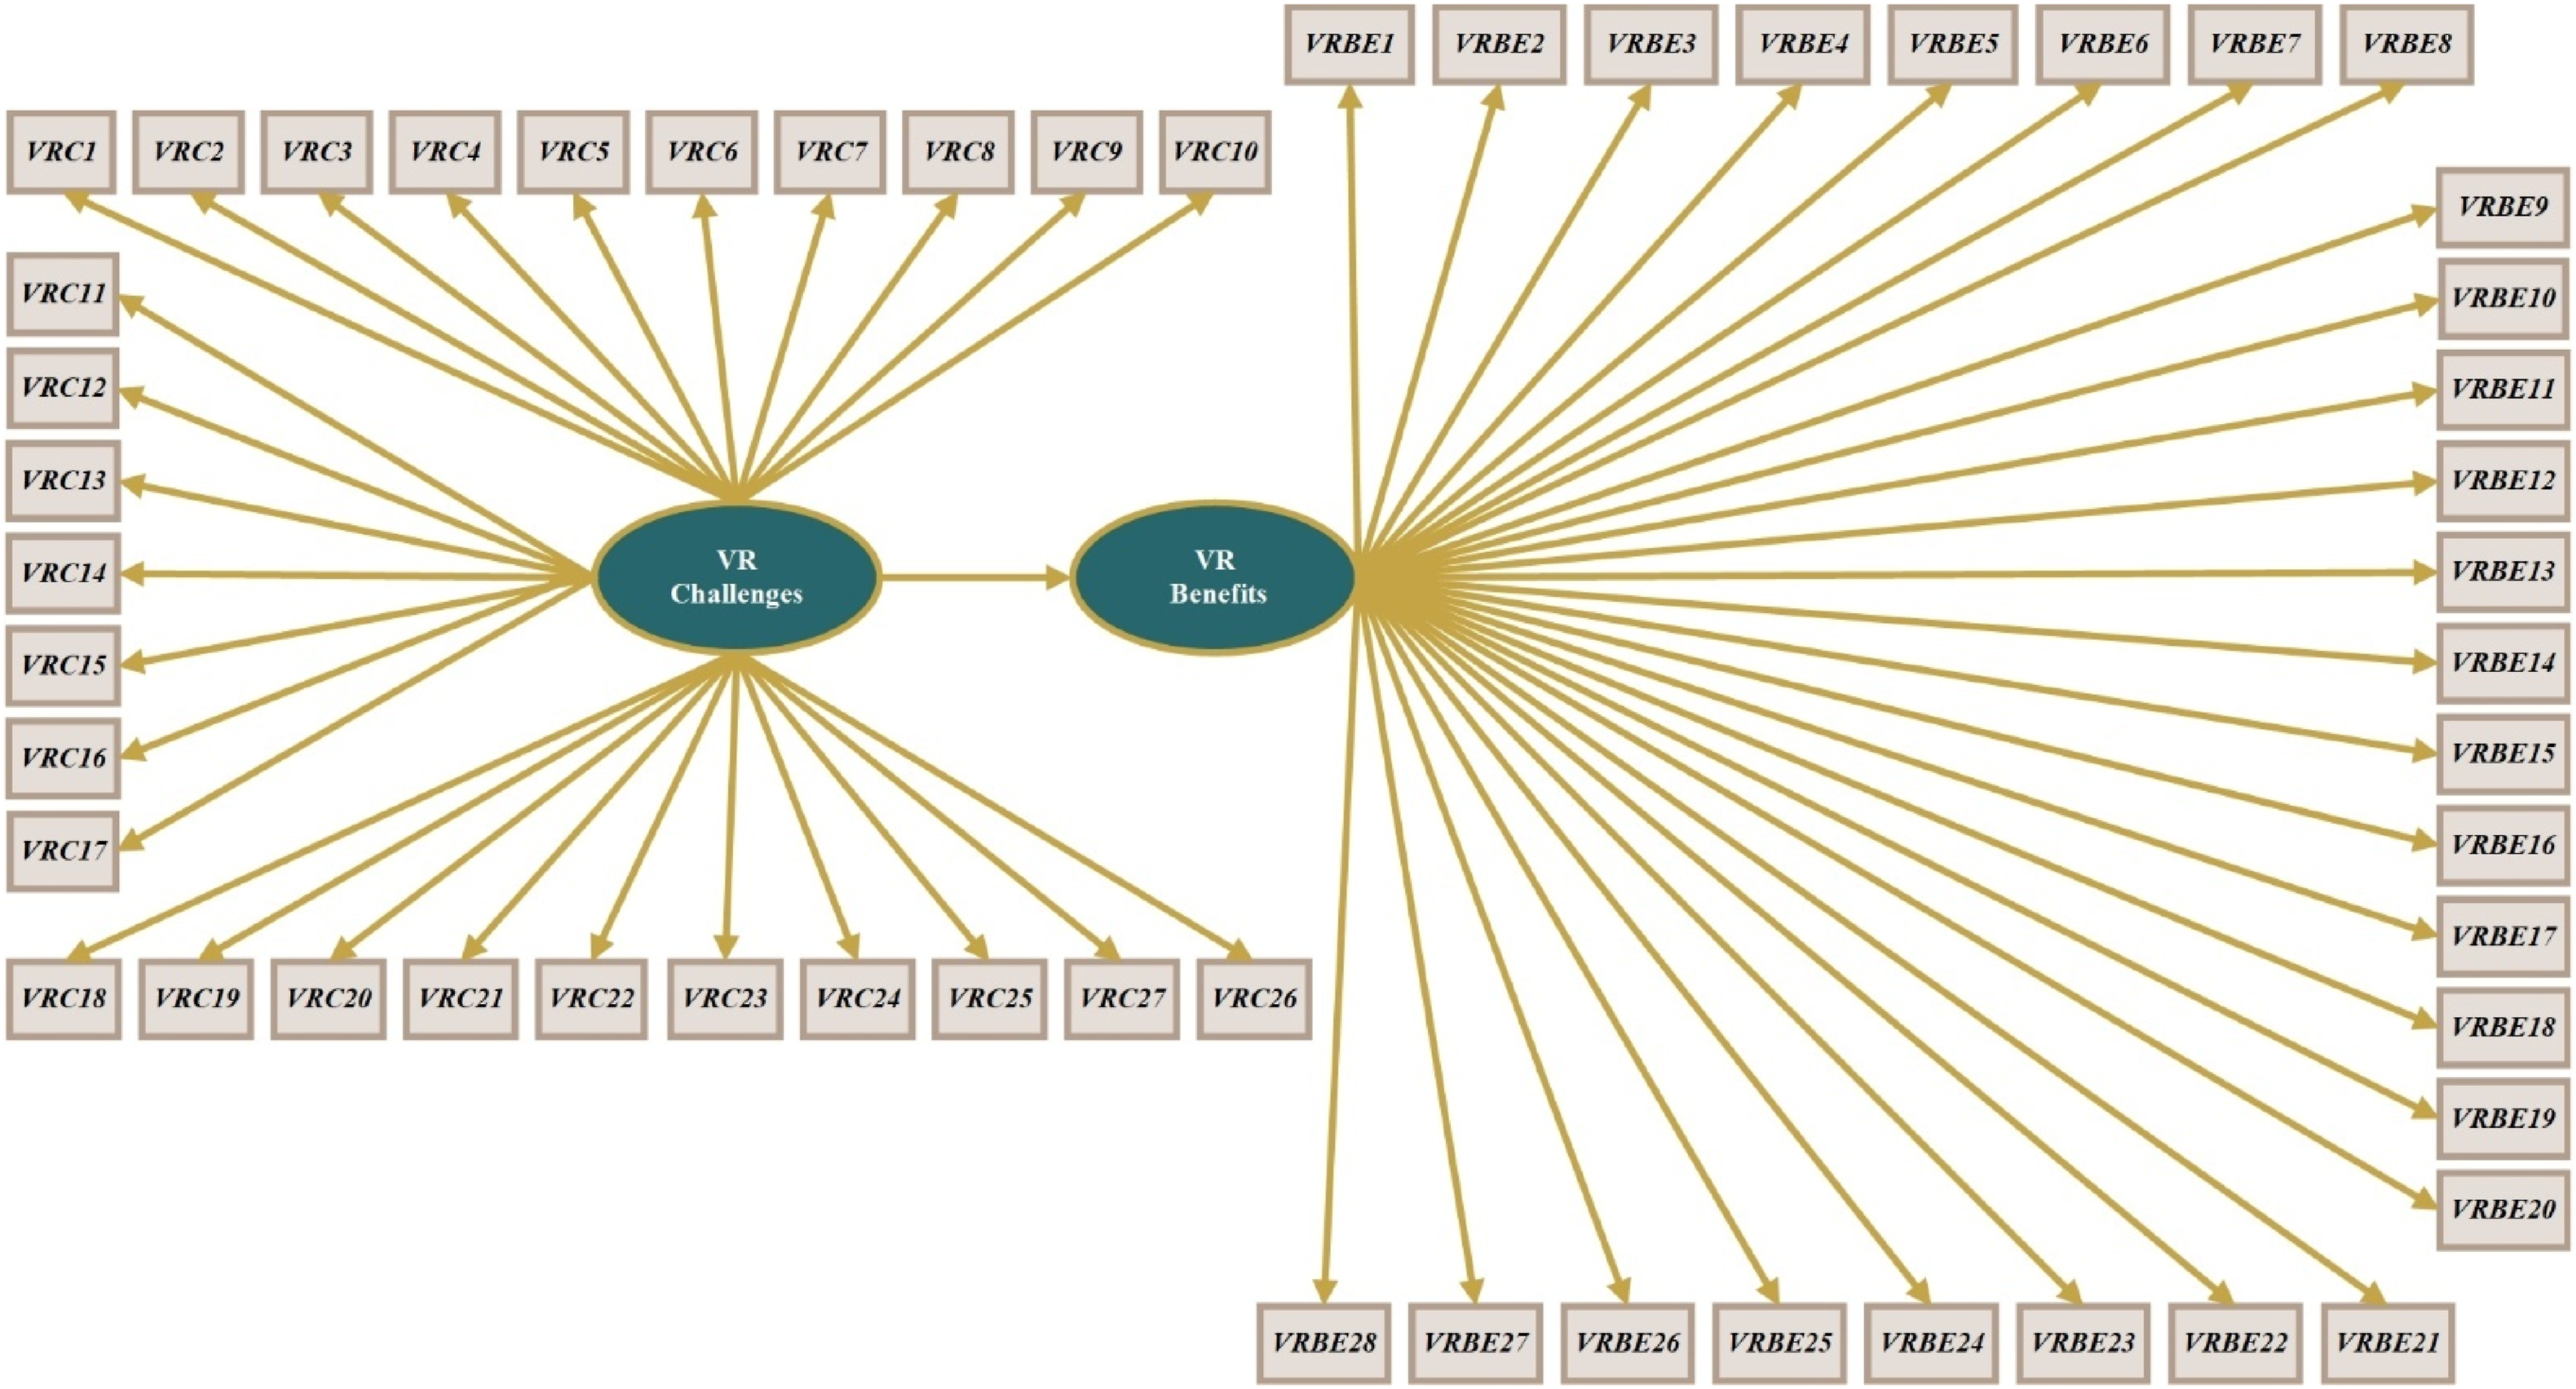
Research methodology
This study consists of four phases, as shown in Figure 3: (1) systematic search; (2) scientometric analysis; (3) developing a questionnaire survey; and (4) employing data analysis approaches such as EFA, PLS-SEM, and MARCOS. Each phase will be discussed separately in the following sections. Research methodology.
Phase 1: Systematic search
A systematic search of literature from the past decade was performed using the Scopus database to investigate the theoretical foundations of VR and identify research gaps. A thorough search strategy was implemented, employing specific keywords in the “article title/abstract/keyword” fields of Scopus to ensure a comprehensive selection of relevant papers. The outcomes of the search query were assessed against predetermined inclusion and exclusion criteria to refine the retrieved studies, ensuring that only relevant articles were retained. The authors selected articles published in peer-reviewed journals and conferences within the engineering domain, excluding studies that lacked full-text access, those published before 2013, and articles in languages other than English.
Phase 2: Scientometric analysis
The scientometric analysis utilizes science mapping to visually represent knowledge and contributions within a research field. Its primary goal is to demonstrate the relationships among publications, countries, and keywords. 19 This study employed VOSviewer for the scientometric analysis, which is known for its user-friendly interface and widespread use in this type of analysis.48,49 The analysis primarily focuses on identifying active countries to determine the presence of developing countries in VR research. Figure 1 illustrates the collaborative efforts and leading countries in VR research, with each node representing a nation. The size of each node correlates with the volume of research publications, highlighting the United States, China, Hong Kong, South Korea, and the United Kingdom as the largest contributors. Notably, no developing countries rank among the top 10 in VR research, which aligns with the study’s problem statement.
Phase 3: Developing of questionnaire survey
The choice of a questionnaire survey for data collection is based on its capacity to generate quantitative data suitable for rigorous statistical analysis and its convenience for gathering data from numerous participants in a short time.50,51 The survey consists of four main sections: the first gathers demographic data from respondents; the second evaluates VRCs; the third assesses VRBEs; and the final section includes an open-ended question for additional comments. A 5-point Likert scale was employed to measure VRCs and VRBEs, as it effectively captures respondents’ opinions, thereby enhancing response rates and quality while minimizing frustration. 52
Pilot survey development
The pilot test was a crucial step in the questionnaire design process, aimed at identifying and addressing unforeseen issues in the survey. Its primary goal was to enhance the practicality and effectiveness of the main questionnaire. 53 Based on the feedback from participants, adjustments were made to improve clarity and usability.
Targeted participants and sampling technique
The study focuses on participants who are actively practicing in the construction industry in Lagos, Nigeria. The choice of Lagos State as the research location was deliberate, given its status as an economic hub and a major industrial zone in Nigeria. Lagos is renowned for its high level of development, boasting a dense population of construction professionals. It is worth noting that 70% of Nigeria’s construction firms have a physical presence in Lagos, and 60% of Nigeria’s building operations occur in this region. 54 As per the estimates provided by Babalola and Aigbavboa, 55 there are approximately 11,655 construction professionals actively practicing in Lagos State.
The study employed random sampling to select professionals from the population. According to Noor et al., 56 this technique is commonly used in social science research. Random sampling is particularly effective for studies aiming to yield generalizable outcomes for the entire population. Previous studies have also employed this approach to reach their target participants, confirming its effectiveness.53,57,58
Sample size
Following the suggestions of Ali et al., 59 an online sample size calculator was employed to determine an adequate sample size, using a 90% confidence level and a 10% margin of error as input values. Using these parameters, the sample size estimation tool predicted a minimum of 68 participants. Abdel-tawab et al. 60 argue that the appropriate sample size for quantitative research should be determined based on the study’s objectives and methodological requirements. Given that this study employs PLS-SEM for data analysis, it is essential to consider the specific sample size requirements of this technique. According to Hair et al., 61 PLS-SEM is particularly effective in handling relatively small sample sizes while still producing robust and reliable results. This is further supported by Attia et al., 62 who demonstrate that PLS-SEM is a suitable analytical approach even when working with limited data sets.
Numerous previous studies have successfully applied PLS-SEM using sample sizes below 100. For example, Kineber et al. 63 conducted their analysis with only 33 responses, Abdulai et al. 64 utilized a sample of 63 participants, and Attia et al. 62 employed PLS-SEM with 70 completed surveys. In this study, a total of 146 questionnaires were distributed, resulting in 83 fully completed responses, representing an acceptable response rate of 56.8%. Given that PLS-SEM is well-suited for small sample sizes and has been successfully applied in previous research using similar or even smaller samples, the sample size obtained in this study is considered sufficient and appropriate for conducting rigorous PLS-SEM analysis.
Phase 4: Developing data analysis
Exploratory factor analysis (EFA)
EFA is a statistical method within the family of multivariate statistical techniques, aimed at identifying the essential set of hypothetical constructs. 65 This method uncovers the fundamental factors that explain relationships among observed variables, simplifying data complexity and revealing the core structure of a concept. 66 Haig 67 and Ali and Kineber 68 explain that EFA involves a systematic examination of correlation patterns among observable variables, which are categorized into factors based on the strength and direction of these correlations. In this study, SPSS software was employed to perform the EFA, enabling researchers to identify constructs within the dataset.
PLS-SEM model development
SEM is highly regarded in construction management for its ability to analyze complex correlations and interdependencies among various variables. 69 This statistical method is a second-generation multivariate technique that integrates confirmatory factor analysis and path analysis into a single model. 70 Two primary approaches exist in SEM: covariance-based SEM and PLS-SEM, each with specific applications. PLS-SEM is particularly effective for small samples and complex models, as it does not assume a specific underlying data distribution, offering flexibility and robustness. 71 Additionally, PLS-SEM is suitable for studies aimed at predicting outcomes and assessing hypotheses regarding variable relationships. 61 Given the goal of examining the relationship between overcoming VRCs and its effect on achieving VRBEs in the construction industry, the authors selected this method for its alignment with their objectives.
MARCOS method
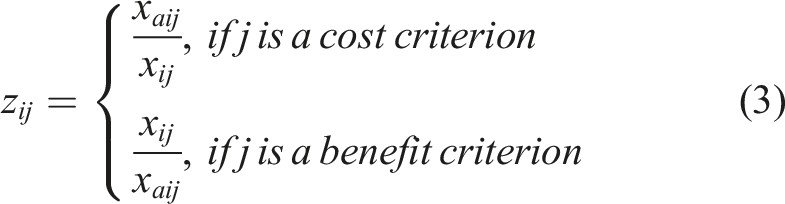
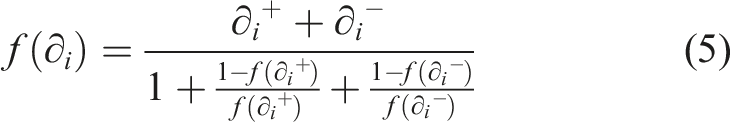
The MARCOS technique is a decision-making method that prioritizes and ranks alternatives based on their compromise solutions.46,72 This study employs the MARCOS technique to evaluate and rank VRCs and VRBEs within the construction industry of developing countries. Implementing this method enables stakeholders to effectively identify and assess key priorities, facilitating informed decision-making. The application of this technique involves four steps. The first step involves creating a decision matrix and determining the best (AI) and worst (AAI) solutions using equations (1) and (2). In this study, solutions refer to VRCs and VRBEs, while criteria reflect respondent feedback on a Likert scale. The second step involves normalizing the decision matrix using equation (3). The third step involves establishing the weighted matrix yij by multiplying the normalized values by the weights of the criteria wj using equation (4). The fourth step involves calculating the utility functions 


Results
Respondents’ profile
Figure 4 visually represents the demographic information of survey respondents, revealing key findings. Most respondents have less than 5 years of work experience in the construction industry, and a significant portion hold a bachelor’s degree as their highest educational attainment. Additionally, the majority work as architects in their companies. Demographic information of respondents.
Exploratory factor analysis (EFA)
EFA was carried out to evaluate the structure of the factors among 27 variables related to VRBs. Several parameters for assessing the factorability of relationships were employed, including the Kaiser-Meyer-Olkin (KMO) measure, the Bartlett test of sphericity, initial communalities, scree plot, and loading factors. It is important to note that this study used the benefit categories and their indicators from prior EFA-based.
46
• According to Tabachnick and Fidell,
73
the KMO measure is commonly used to assess whether the variables under consideration exhibit sufficiently low partial correlations, indicating suitability for factor analysis. A minimum KMO value of 0.6 is considered necessary for factor analysis to be deemed appropriate.
68
In this study, the KMO value was found to be 0.801, which exceeds the recommended threshold of 0.6, thereby indicating that the sample was adequate for factor analysis. • Based on Pallant,
74
Bartlett’s test of sphericity was used to determine whether the correlation matrix deviated significantly from an identity matrix, which would indicate that the variables are suitable for factor analysis. Factor analysis was conducted only if Bartlett’s test of sphericity yielded statistically significant results (p < 0.05). In this study, the test resulted in a chi-square value (χ2) of 1252.21 with 351 degrees of freedom (df), and a p-value of less than 0.001, indicating strong evidence against the null hypothesis of an identity matrix. • As stated by Oke et al.,
75
initial communalities represent the proportion of variance in each variable that is explained by all VRBs in the analysis. Variables with initial communalities greater than 0.5 are generally considered suitable for factor analysis, as they indicate that a substantial portion of the variance is accounted for by the underlying factor structure. According to the results of this study, all variables exhibit communalities exceeding 0.5, suggesting that they are all appropriate for inclusion in the factor analysis. • According to Lloret
65
and Ali et al.,
76
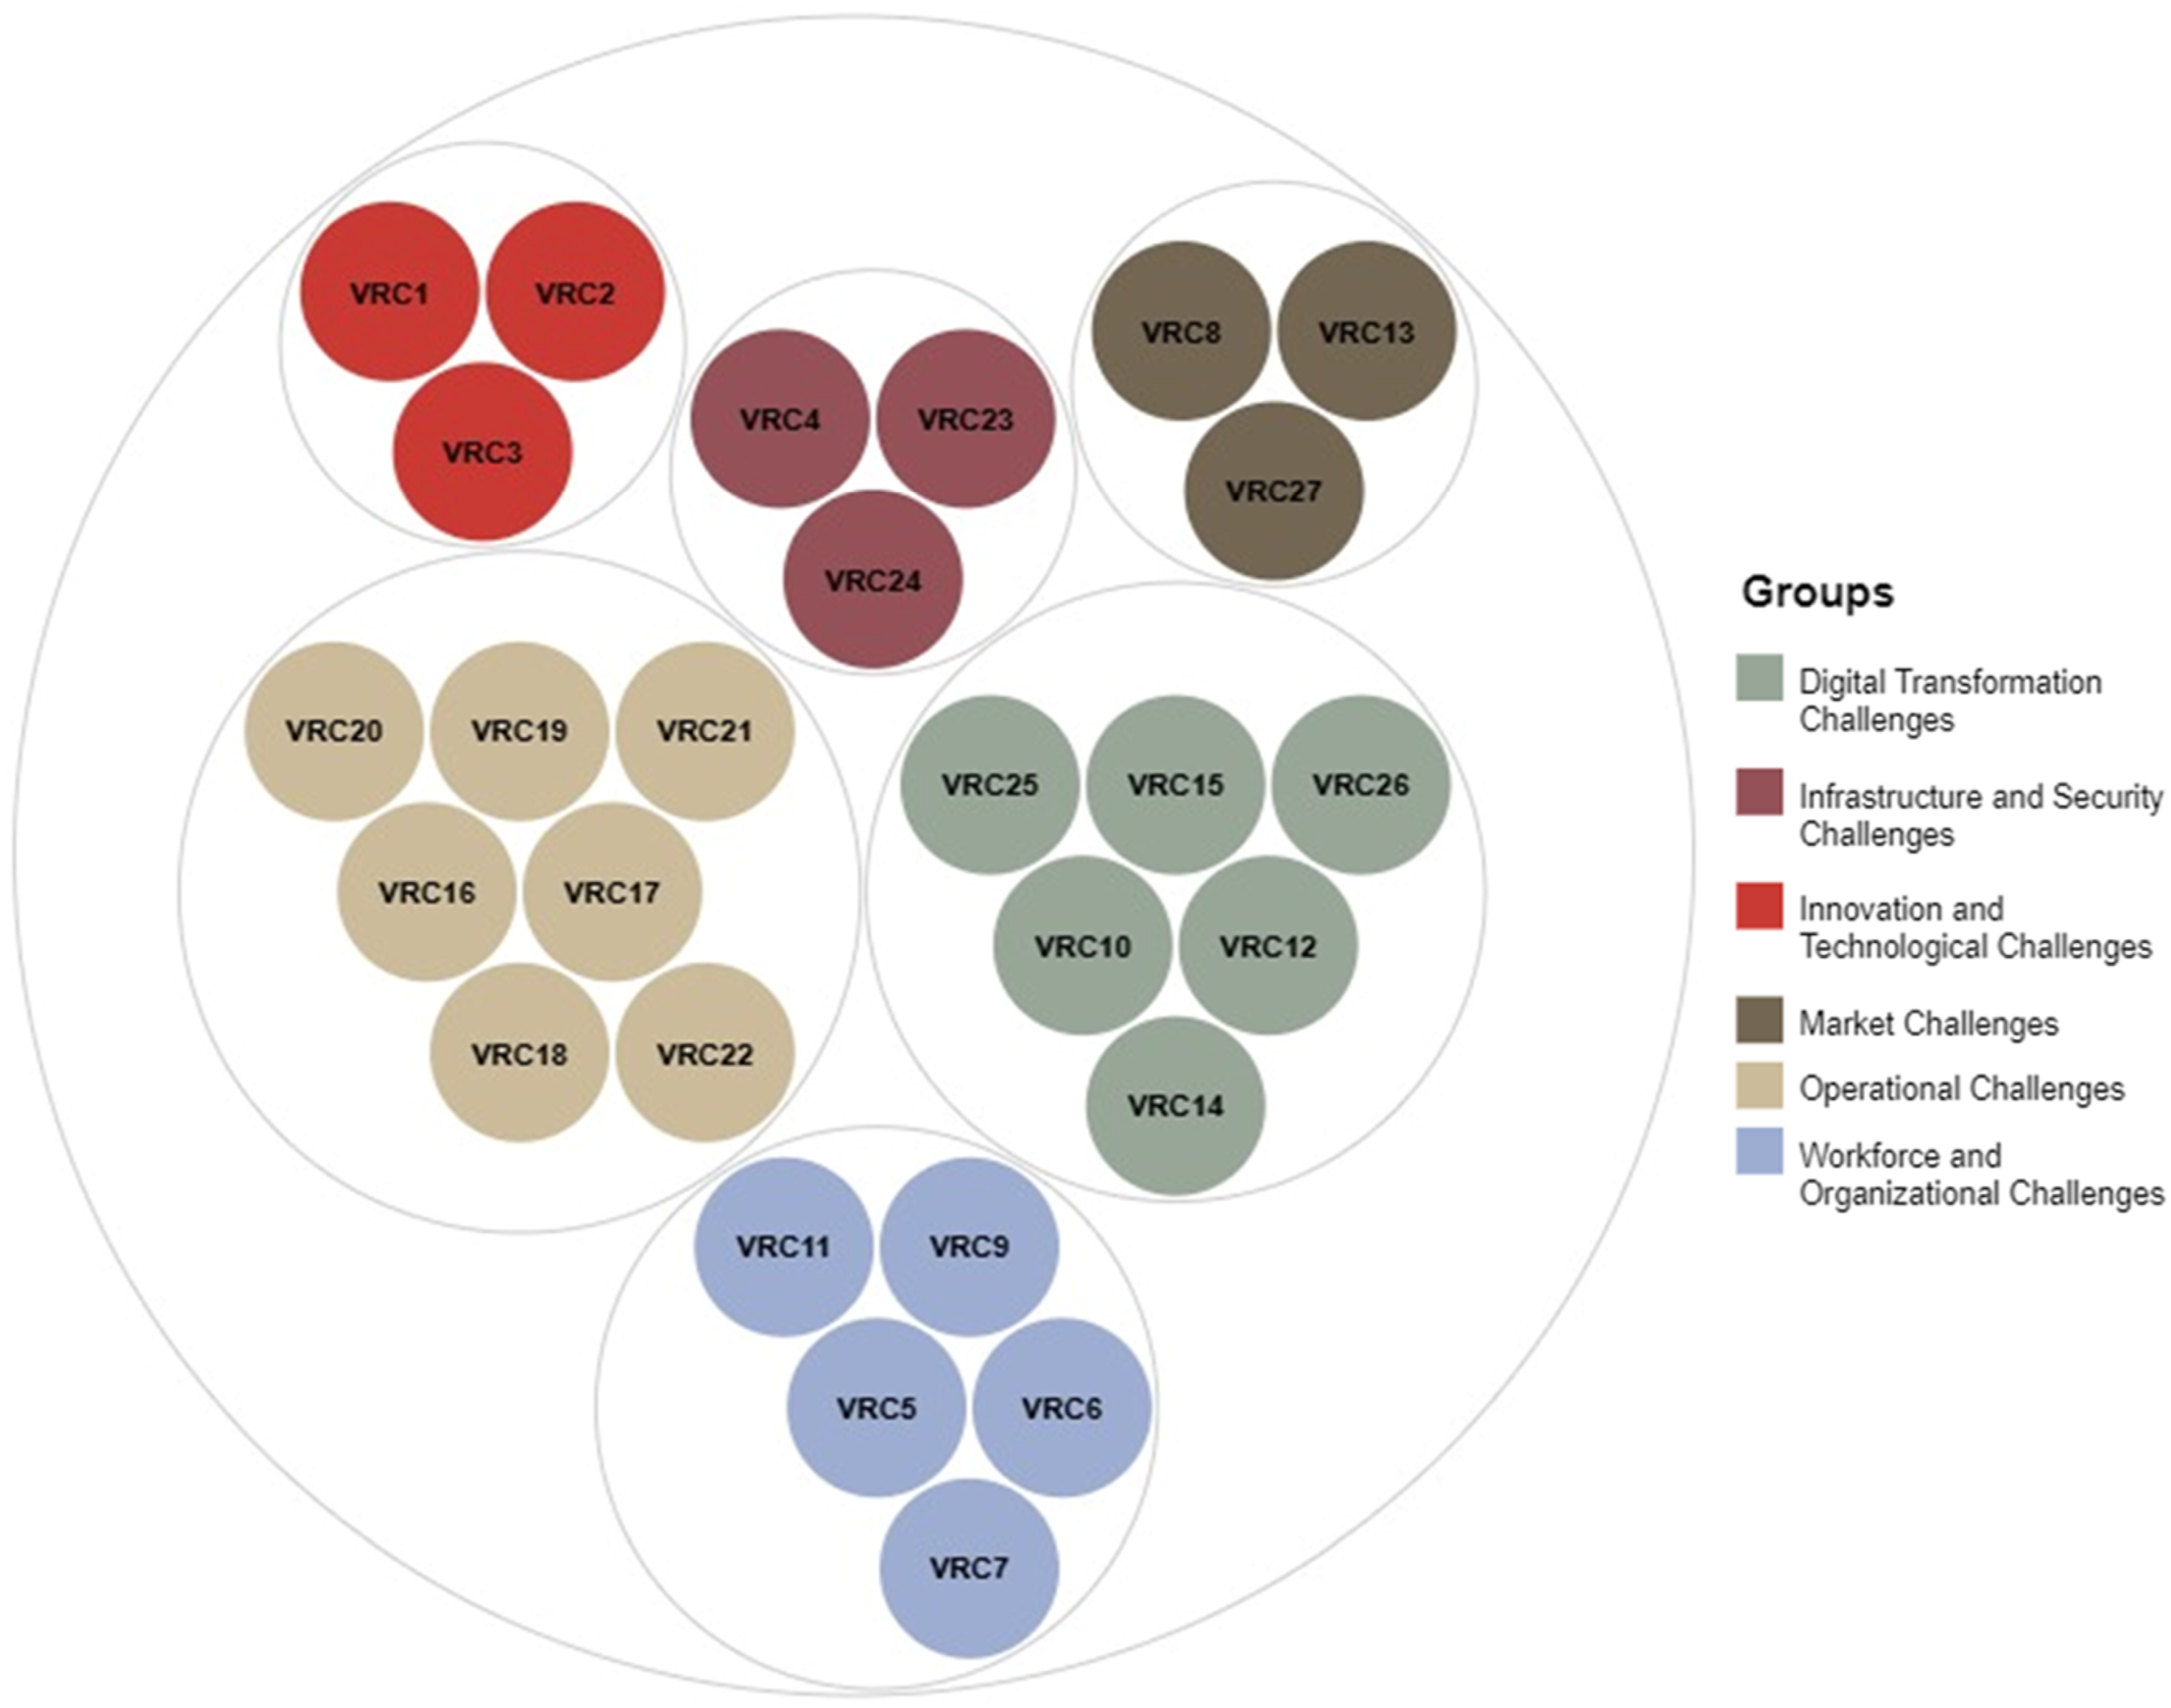
the total number of factors that can be extracted in EFA is often determined using a scree plot, a widely used graphical tool for this purpose. The scree plot is a line graph that displays the eigenvalues associated with each component or factor extracted from the data, plotted against the component number. Eigenvalues represent the amount of variance explained by each component. Typically, components with eigenvalues greater than 1 are considered meaningful and retained for further analysis. The results presented in Figure 5 indicate that six components with eigenvalues exceeding 1 were extracted. • Six components with eigenvalues greater than 1 were retained. A Varimax rotation was applied to the factor matrix to enhance interpretability by redistributing the variance more evenly across components. Following rotation, these components collectively accounted for 66.847% of the total variance, with the following individual contributions: 14.063% for the first component, 13.658% for the second, 12.175% for the third, 11.477% for the fourth, 8.658% for the fifth, and 6.816% for the sixth. • Finally, the rotated factor loadings for VRCs were extracted and are presented in Table 5. Following this, VRCs within each component were analyzed to identify common themes, enabling the development of meaningful category labels. The resulting categorization of the VRCs is illustrated in Figure 6. The scree plot for VRCs. VR challenges rotated component matrix. Categorization of virtual reality challenges based on thematic analysis.


First-order construct - measurement model
A first-order measurement model directly assesses constructs through indicators, which can be reflective or formative. Reflective indicators share an underlying construct, while formative indicators define it. Regression analysis evaluates the relationship strength between indicators and constructs. This model is widely used in SEM to assess the reliability and validity of constructs, addressing convergent and discriminant validity. 77
Convergent validity
VRCs convergent validity.

VRBEs convergent validity.

Composite Reliability (CR) measures the reliability of indicators in accurately representing their construct, with a score of 0.6 considered acceptable. 79 A CR score of 0.8 indicates good reliability, while 0.9 or above signifies perfect reliability. 53 Tables 6 and 7 show that most constructs have good reliability with scores over 0.8, while the WOC, ISC, ITC, MC, and RMD constructs demonstrate acceptable reliability. This suggests strong relationships between indicators and constructs.
Average Variance Extracted (AVE) assesses the convergent validity of constructs in a model. 79 An AVE of 0.5 or higher is acceptable, while 0.7 indicates good convergent validity, and a score of 0.9 or above reflects very high convergent validity. 77 Tables 6 and 7 show that RM and RMD constructs achieved good convergent validity, with AVE scores exceeding 0.7. All other constructs are considered acceptable for convergent validity, with AVE scores greater than 0.5.
Discriminant validity
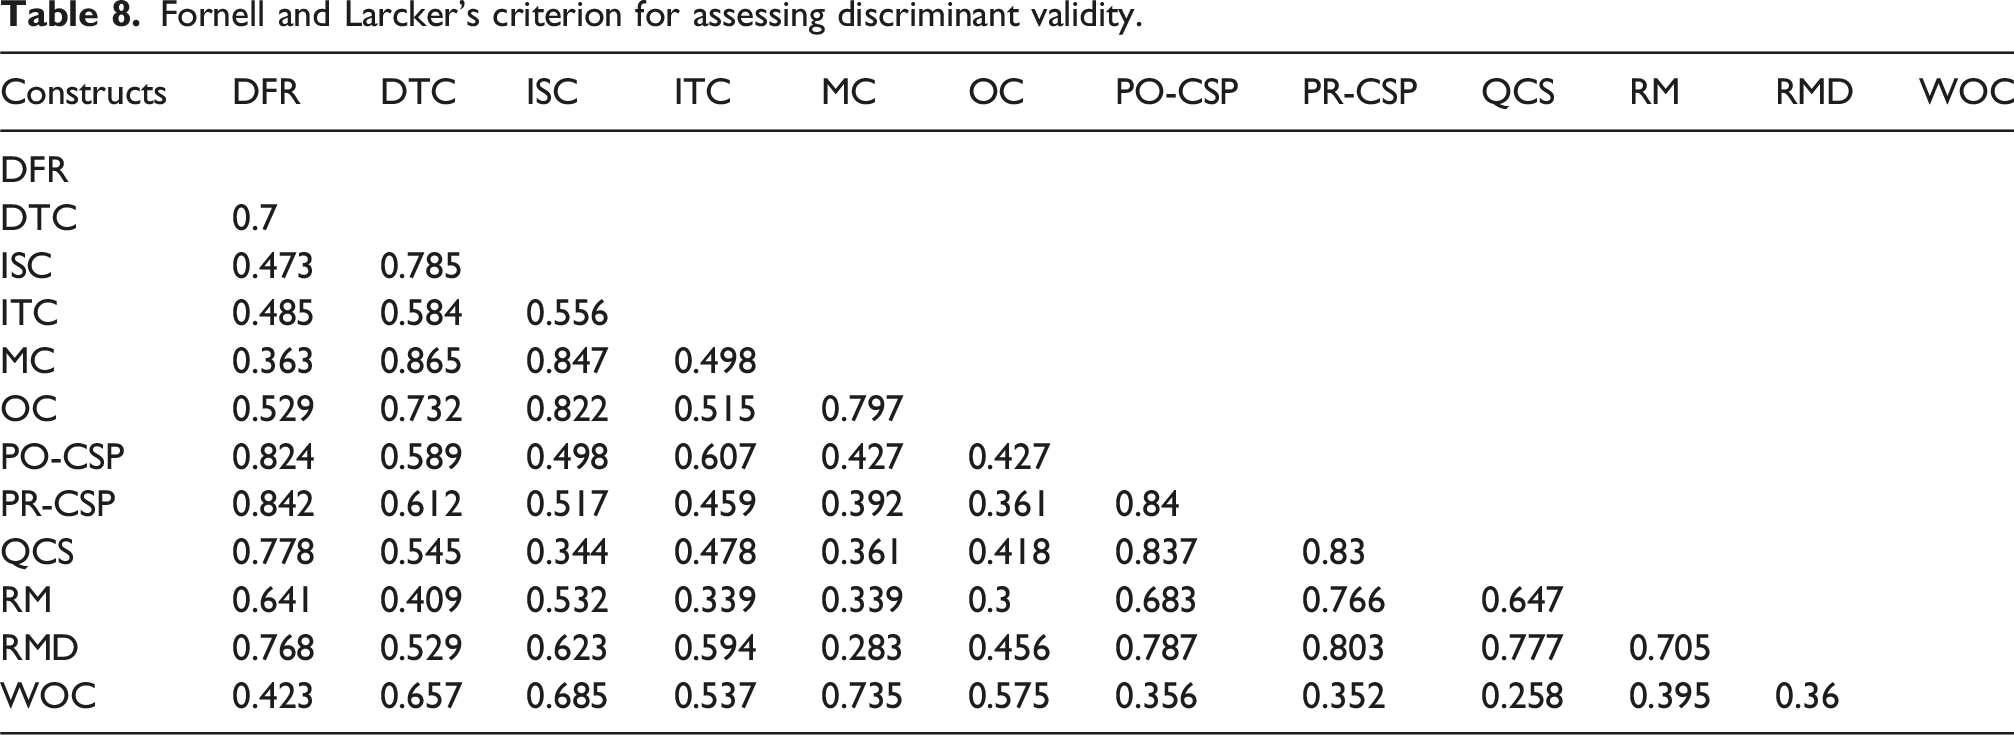
Discriminant validity ensures that the constructs in a model are distinct and do not overlap with those in other models, indicating they measure different underlying concepts and are not highly correlated. 58 Attia et al. 82 assessed discriminant validity using three methods: Heterotrait-Monotrait Ratio (HTMT), Fornell-Larcker criterion, and cross-loadings. Hair et al. 81 argued that any of these methods can establish discriminant validity.
Fornell and Larcker’s criterion for assessing discriminant validity.
Second-order construct - measurement model
Second-order measurement models create a construct from multiple first-order constructs. A second-order latent variable is synthesized from these first-order constructs, with the indicators representing the second-order constructs being the first-order constructs themselves. These models are particularly beneficial when first-order constructs are interrelated and can be integrated into a higher-order construct. 83 Bootstrap analysis is a key technique for evaluating second-order measurement models, testing hypotheses, and establishing confidence intervals for model parameters. It addresses uncertainty in sample data and assesses the stability of PLS-SEM results. The analysis focused on path coefficient (β) values and p-values, which signify the strength and significance of relationships between constructs. 61 The model evaluated first-order constructs, treating VR implementation challenges as formative and benefits as reflective.
Daoud et al.
84
state that a β value over 0.1 indicates a strong relationship between constructs, while a p-value under 0.05 confirms its significance. Figure 7 presents the path coefficients from the bootstrap analysis. The findings reveal that addressing VRCs significantly and positively influences the attainment of VRBEs, with β = 0.556 and p = 0.000. Additionally, all other constructs exceed the thresholds for both β and p-values, demonstrating strong and significant relationships. PLS-SEM results showing path coefficients between constructs.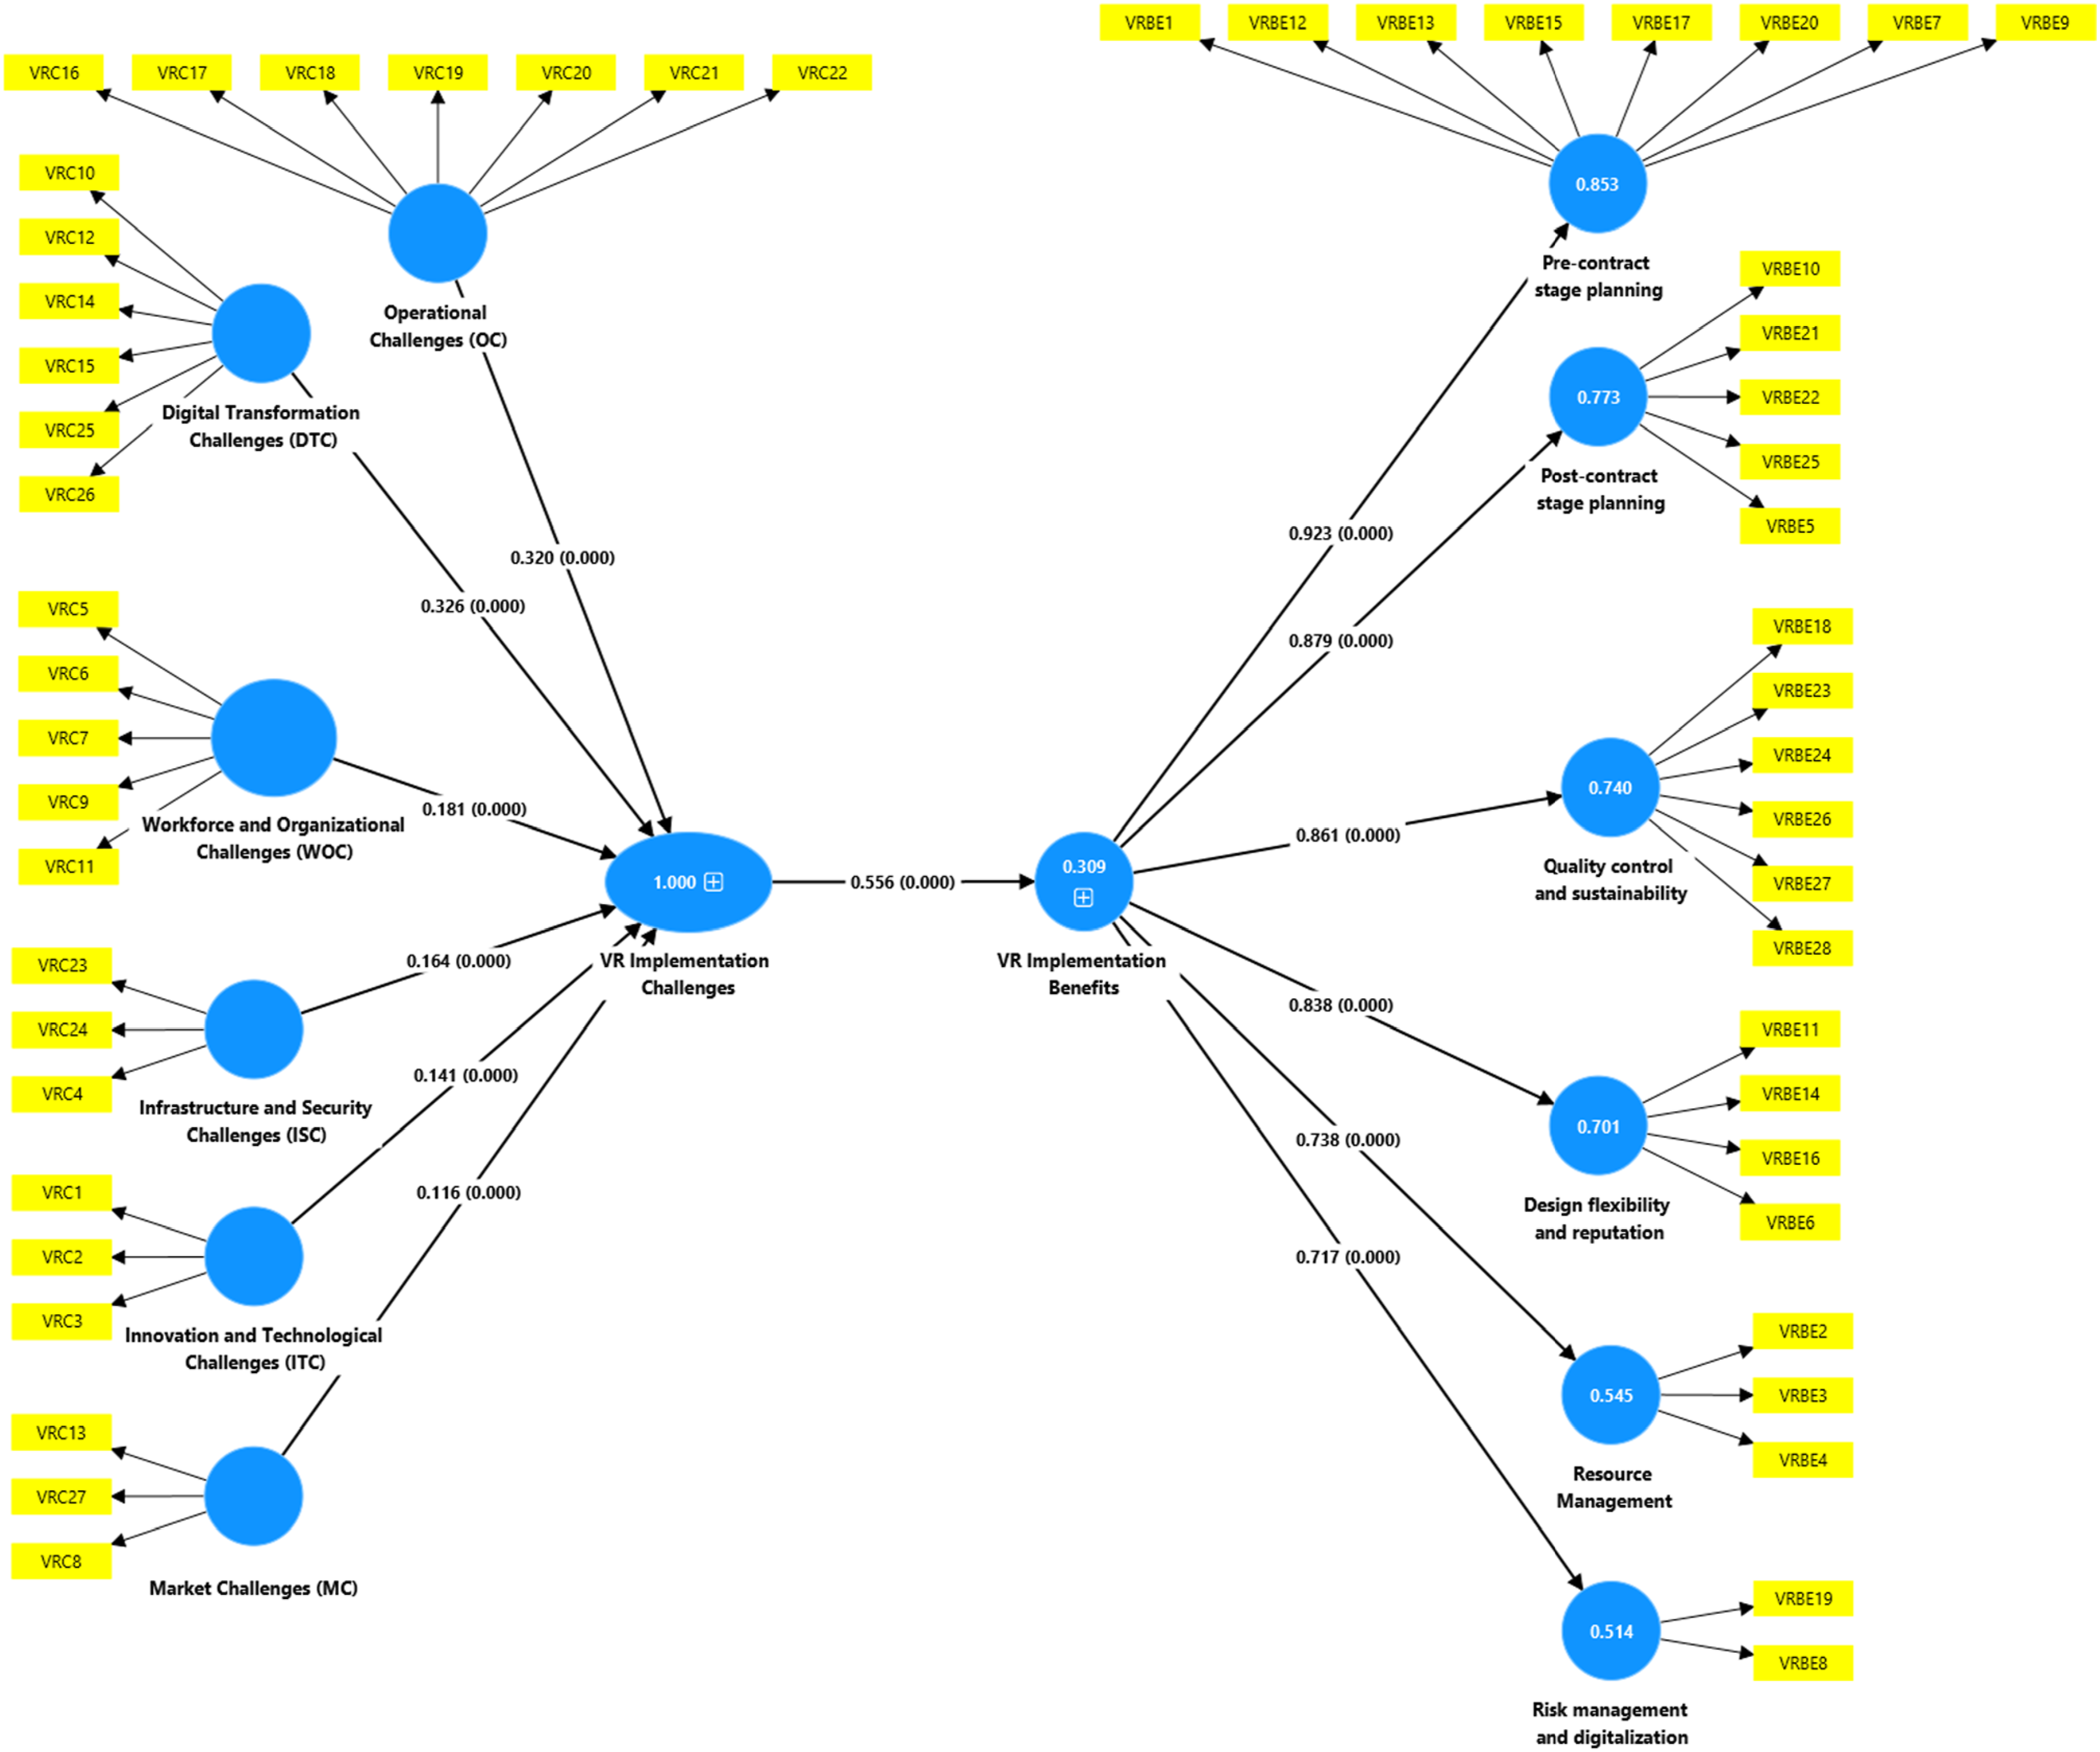
Structural model
R2 represents the explanatory power of the structural model, measuring the variance explained by constructs for each dependent variable. It evaluates the model’s predictive capability, indicating how much variance in the dependent variable is attributed to independent variables. Thus, a higher R2 value indicates a more predictive structural model. 76 The R2 results indicate a value of 0.309, suggesting that the exogenous constructs, particularly “overcoming VRBs”, account for approximately 30.9% of the variation in the dependent variable, “achieving VR implementation benefits”. According to Abdel-tawab et al., 60 this percentage surpasses the findings from their studies, thereby reflecting a moderate level of explained variance.
Ranking and prioritizing of VRCs and VRBEs
Table 9 shows the utility scores of VRCs and VRBEs in the construction industry. The MARCOS technique evaluates VR adoption challenges by identifying the best and worst alternatives based on each expert’s performance measures, resulting in an extended decision matrix. All 83 responses are treated equally, each valued at 1.20%. This equal weighting approach was deliberately adopted to maintain objectivity and prevent bias. It aligns with the study’s objective of capturing a balanced representation of expert opinion without disproportionately amplifying individual responses. The decision matrix is then normalized, and the normalized values are multiplied by the criteria weights to create the weighted matrix. VRC1 is computed as shown below, providing an example of the calculation. The same procedures are subsequently applied to the other benefits and barriers. ➢ The ➢ The utility degrees for both the best and worst alternatives are calculated as follows: ➢ The utility functions of the best and worst solutions can be calculated as follows: ➢ The utility function of the assessed barrier is estimated as follows: Prioritized barriers and benefits of VR adoption in construction projects.


Discussion
This research pinpoints several significant barriers and benefits of VR adoption in the construction sector. These findings align with earlier research, highlighting significant challenges and providing a comparative framework for comprehending their relevance.
Prioritizing barriers hindering VR adoption
Seven operational challenges are examined as critical VR barriers. These factors, together with their corresponding utility scores, are VRC21 – “inadequate power supply” (0.728); VRB18 – “lack of awareness” (0.722); VRC20 – “system malfunctioning” (0.716); VRC19 – “low speed of internet” (0.708); VRC22 – “poor return on investment” (0.698); VRC16 – “lack of client’s interest” (0.677); and VRC17 – “virus attack” (0.665). Based on the utility scores, inadequate power supply is found to be the most critical operational challenge hindering the adoption of VR. This is consistent with the findings of Laurell et al., 36 who emphasized the value of the accessibility of complementary goods at various price points in the spread of VR technology.
Six digital transformation challenges are explored as barriers to VR adoption. These factors are stated as follows: VRC12 – “lack of market knowledge” (0.739); VRC10 – “need for special implementation requirements” (0.719); VRC26 – “difficulties encountered in new ICT technologies” (0.664); VRC14 – “limited access to finance” (0.658); VRC25 – “ICT making professional redundant” (0.631); and VRC15 – “lack of multiuser capabilities” (0.607). Based on the utility scores, a lack of market knowledge is found to be the most critical digital transformation challenge hindering the adoption of VR. This is in line with Delgado et al., 13 who pointed to technology’s immaturity as an obstacle to the uptake of AR and VR in the construction sector.
Five workforce and organizational challenges are reviewed such as VRC7 – “organizational structure” (0.683); VRC9 – “high cost of workers training” (0.655); VRC11 – “job insecurity” (0.629); VRC5 – “reduce the need for knowledge professional skills” (0.614); and VRC6 – “psychological discomfort” (0.604). Among these factors, organizational structure stands out as the most critical challenge (utility function: 0.683). This is consistent with the research of Ahmed, 43 who highlighted the potential of VR technologies to elevate project performance, thereby enhancing organizational culture and boosting overall productivity.
Three infrastructure and security challenges are considered critical barriers. These factors, along with their corresponding utility scores, are VRC4 – “cost of maintenance” (0.725); VRC23 – “poor security and privacy” (0.684); and VRC24 – “personal abuse” (0.617). Based on the utility scores, maintenance cost is found to be the most critical infrastructure and security challenge hindering the adoption of VR.
Three innovation and technological challenges are reviewed, including VRC2 – “lack of technical expertise” (0.754); VRC1 – “high cost of implementation” (0.752); and VRC3 – “unavailability of technology” (0.734). Based on the utility scores, a lack of technical expertise is found to be the most critical innovation and technological challenge hindering the adoption of VR. This result is consistent with the work of Bakhoum et al., 38 who noted limitations caused by a lack of hardware and software availability as well as a lack of expertise in virtual design and building.
Three market barriers are identified, including VRC27 – “lack of government support” (0.725); VRC13 – “branding problems and public perception” (0.643); and VRC8 – “technologies regarded as primitive” (0.604). Based on the utility scores, lack of government support is found to be the most critical market challenge hindering the adoption of VR. This is consistent with the concerns expressed by Bakhoum et al. 38 about the resistance to change and the uptake of VR technology that necessitates governmental support and enforcement.
To support practical implementation, this study suggests tailored strategies to overcome the top-ranked barrier in each category. For operational challenges, addressing inadequate power supply (VRC21) may involve deploying energy-efficient VR hardware or integrating solar-powered backup systems on construction sites. In digital transformation, lack of market knowledge (VRC12) can be mitigated through government-supported awareness campaigns and industry-specific training programs. For workforce and organizational issues, overcoming organizational structure challenges (VRC7) may require leadership-driven change management initiatives and the restructuring of roles to support VR integration. In terms of infrastructure and security, the high cost of maintenance (VRC4) could be managed by investing in scalable, modular VR systems and engaging in vendor partnerships that offer long-term support. Addressing the lack of technical expertise (VRC2) under innovation challenges may involve formal collaborations with academic institutions to establish vocational upskilling programs. Lastly, for market-related barriers, overcoming the lack of government support (VRC27) will likely depend on policy-level interventions such as financial incentives, regulatory frameworks, and pilot demonstration projects to build public trust and encourage widespread adoption.
Prioritizing benefits of VR adoption
Eight pre-contract stage planning benefits are determined to be BE1 – “incorporate labor process” (0.746); BE15 – “minimize errors in the construction process” (0.704); BE20 – “accelerate project delivery” (0.703); BE9 – “improve identification of design clash” (0.701); BE17 – “improve design effectiveness” (0.671); BE7 – “enhance product and material quality” (0.668); BE12 – “eliminate errors in documentation” (0.663); and BE13 – “decrease cost of construction” (0.662). Our findings reveal that incorporating the labor process is the most prominent benefit, with a high utility score of 0.746. This result supports the research of Getuli et al., 85 which highlighted VR’s contribution to improving construction schedule and design clash detection, eventually leading to an improvement in safety training.
Five post-contract stage planning benefits are explored such as BE22 – “determine design defects” (0.739); BE25 – “improve scheduling process” (0.721); BE21 – “promote comprehensive visualization” (0.718); BE10 – “decrease construction time” (0.698); and BE5 – “enhance identification of risks” (0.683). Determining design defects emerges as the most critical benefit, with a utility score of 0.739.
Six quality control and sustainability benefits are investigated, including BE27 – “prevent design and construction flaws” (0.726); BE28 – “improve planning process” (0.704); BE26 – “promote sustainability in construction” (0.703); BE24 – “overcome labor force scarcity” (0.683); BE23 – “simplify complex assignment” (0.669); and BE18 – “strengthen safety training for employees” (0.639). Clearly, the prevent design and construction flaws stand out as the most critical benefit (utility score = 0.726). This is consistent with the findings of Getuli et al., 85 who showed the pivotal role of VR in bolstering design clash detection and improving workers’ safety training.
Four design flexibility and reputation benefits are reviewed, with enhancing project efficiency and performance being the most critical benefits (utility score = 0.730). The other three factors, BE14 – “enhance safety planning of projects”, BE11 – “increase the productivity and efficiency of labor”, and BE16 – “enhance company’s reputation and image” have utility scores of 0.730, 0.729, and 0.723, respectively. Ahmed, 43 who also supported our findings, highlighted the value of VR in addressing defects and enhancing safety throughout the inspection process.
Three resource management benefits are examined, with promoting precise quantity take-off identified as the most critical benefit (utility score: 0.697). In line with our findings Wang et al., 42 also emphasized the accuracy of quantity take-offs, highlighting VR’s ability to reduce assumptions when dealing with 2D designs.
Two risk management and digitalization benefits are assessed, with BE8 – “promote construction digitalization” (utility score: 0.697) standing out compared to BE19 – “facilitate effective decision-making” (utility score: 0.663). This conclusion is consistent with a previous research by Oke et al. 46 that emphasized the advantages of VR in improving teamwork, communication, project performance, risk detection, and digitization. It is important to note that recent studies show growing interest in using technologies like VR and wearable sensors to improve safety in construction, and they also point out common challenges, such as high costs, technical hurdles, and resistance from workers. 86 However, these challenges are not the same everywhere - they can look very different depending on the context. For example, in rural areas or low-income countries, inadequate infrastructure like unreliable power, slow internet, lack of technical skills, and limited funding are often more serious. In these places, solutions like solar-powered systems might help bridge some of these gaps. On the other hand, in urban areas or middle-income countries, the challenges might be more about the high cost of implementation and maintenance, concerns around privacy and data security, or even fears among workers about job losses due to automation. These findings underscore that the adoption of technologies such as VR in the construction sector cannot follow a one-size-fits-all approach. Instead, implementation strategies must be context-specific, considering local conditions to ensure that solutions are practical, economically feasible, and sustainable for the communities in which they are deployed.
Conclusion
This study investigated the barriers and benefits of implementing VR technology in the construction industry of developing countries. A rigorous methodology, utilizing a PLS-SEM statistical model and the MARCOS technique, was employed to analyze the critical barriers to VR adoption and the potential benefits it offers in this context. The findings reveal a significant and positive relationship between overcoming VRCs and achieving the benefits of VR implementation, evidenced by a β-value of 0.556 and a p-value of 0.000. This strong statistical significance indicates that as organizations successfully address VRCs, they are more likely to realize the advantages associated with VR initiatives.
Furthermore, the R2 value suggests that overcoming VRCs accounts for approximately 30.9% of the variation in the dependent variable, which is the achievement of VR implementation benefits. This indicates a moderate impact between the two variables, highlighting that while addressing VRCs is important, other factors may also play a role in achieving VRBEs. These results validate the hypothesis proposed in this study. The research also identified key challenges in integrating VR into construction. Adoption faces seven operational challenges, six digital transformation challenges, five workforce challenges, three infrastructure challenges, three innovation challenges, and three market challenges. Additionally, the benefits of VR implementation include promoting sustainability, enhancing safety planning, and ensuring accurate quantity take-offs.
This research contributes to informed decision-making by examining and quantifying the barriers and benefits of VR technology. It assists stakeholders in advancing the construction industry in developing countries through the adoption of such technologies. The findings have significant implications, offering practitioners valuable insights on overcoming challenges, optimizing VR adoption, and maximizing its benefits. Additionally, government organizations and legislators can leverage this information to develop supportive strategies for VR integration, ultimately fostering economic growth and infrastructure development in these regions.
Implications
This research contributes uniquely to construction management in developing countries by examining VR technology adoption. Utilizing PLS-SEM to develop a novel statistical model for analyzing VR barriers and benefits introduces an innovative approach not previously explored. This methodology clarifies the complex relationship between overcoming VRCs and realizing VRBEs, with important implications for academia and the construction industry in these areas.
Theoretical implications
This study offers a comprehensive compilation of the barriers and benefits associated with the adoption VR in the construction industry. By systematically analyzing these factors, the research contributes to the refinement of theoretical models, enhancing our understanding of the interplay between these barriers and benefits. It establishes causal links between key variables, particularly the relationship between overcoming VRCs and realizing VRBEs. Furthermore, by emphasizing and ranking these barriers and benefits, the research clarifies their inherent complexity, providing nuanced insights that are essential for both academic inquiry and practical application within the field. This work not only enriches the existing literature but also serves as a valuable resource for industry stakeholders seeking to optimize the integration of VR technology in construction practices.
Practical implications
The findings provide industry professionals with a thorough understanding of VR barriers and benefits, aiding future adoption. They support government officials and policymakers in formulating informed VR policies for developing nations. Furthermore, the study offers a complete foundation and framework for integrating VR into construction projects. It also assists small and medium-sized construction firms in grasping VR barriers and understanding the resultant benefits of overcoming them, thereby enhancing VR adoption, bolstering competitiveness, and expanding project opportunities previously hindered by technological issues.
Limitations and future research
The study acknowledges several limitations that open valuable avenues for future research, despite successfully achieving its stated objectives. First, the sample size and geographic scope were limited to respondents from Lagos, Nigeria. While the context is highly relevant to the construction industry in developing countries, this may restrict the generalizability of the findings. To develop a more inclusive and transferable understanding, future studies are encouraged to include larger and more diverse samples, incorporating participants from client organizations and end-users across various developing regions such as Africa, Latin America, and Southeast Asia.
Second, in the prioritization of VRCs and VRBEs using the MARCOS method, equal weighting was assigned to all respondent inputs to maintain objectivity and reduce bias. However, this approach may oversimplify complex stakeholder dynamics, particularly in cases where varying levels of experience, expertise, or organizational influence could affect judgment. Future research should explore the integration of differential weighting schemes, such as those based on stakeholder roles, expert consensus (e.g., AHP), or data-driven entropy methods, to better reflect the nuanced perspectives of diverse construction stakeholders and enhance the robustness of prioritization outcomes across different contexts.
Third, while the model demonstrates a statistically significant relationship between overcoming VRCs and achieving VRBEs (β = 0.556, p = 0.000), the R2 value of 0.309 indicates that only about 31% of the variance in VRBEs is explained by the identified challenges. This suggests that other factors, such as organizational readiness, leadership commitment, regulatory frameworks, or digital literacy levels, may significantly influence VR benefit realization. Future models should consider incorporating these additional constructs to increase explanatory power and provide a more complete understanding of the dynamics of VR implementation.
Finally, this study employed a quantitative approach using survey data and PLS-SEM analysis. Future investigations may benefit from adopting mixed-method designs, incorporating qualitative insights (e.g., interviews, focus groups, or case studies) to explore the contextual and behavioral factors that shape VR adoption. Such approaches would deepen the interpretation of statistical findings and enhance the practical relevance of recommendations for implementing immersive technologies in construction.
Footnotes
Funding
The author(s) disclosed receipt of the following financial support for the research, authorship, and/or publication of this article: The authors express their gratitude to the Middle East University in Jordan for providing financial support to cover the publication fees associated with this research article.
Declaration of conflicting interests
The author(s) declared the following potential conflicts of interest with respect to the research, authorship, and/or publication of this article: The authors acknowledge the use of large language models (LLMs), including ChatGPT, Grammarly, and Quillbot, to enhance the language and readability of this manuscript. These tools were employed to improve clarity and coherence while ensuring that the authors’ original ideas and intellectual contributions remained intact. The authors take full responsibility for the content and interpretations presented in this paper.
Data Availability Statement
The data will be available upon request.