
Abstract
Much focus in the joint retailing and transportation domain has been on the transition to e-tailing and the reformation of supply-chain logistics. However, traditional retailing, where consumers visit stores for shopping still dominates and will continue to do so for the foreseeable future. Retailers continuously expand, contract, and reconfigure their store network for strategic reasons. This paper reports on a project aiming to facilitate the incorporation of environmental consequences into the retailer’s reconfiguration decision process. The paper contributes by providing insights and implementation strategies for deploying eCOmpass, leveraging high resolution spatial data to quantify emissions and optimize facility locations. It describes the design and deployment process of eCOmpass, an online decision support tool that enables retailers to estimate the change in transportation-related CO2 emissions caused by a reconfiguration of their store network. This description encompasses the judgmental choices of data acquisition, optimization technology, and user interface.
Introduction
Location analysis is concerned with the problem of locating service points (e.g., schools, stores, offices, production plants; hereafter facilities) to effectively serve demand points (i.e., a spatially dispersed population or set of users or consumers). It is presumed that the users utilize a transport network to fulfill their service demand in space and time. Here, we focus on road transportation and demand points, which have highly persistent networks and spatial distributions, respectively. Therefore, the facilities’ localization intrinsically affects how the road network is utilized.
While some facilities are under public control, most facilities and their location are under the management and decision-making of private entities. A comprehensive understanding of the location decision is hard to obtain due to the business interests of the private actors. However, it seems sensible to assume that most location decisions follow a systematic analysis of key factors, albeit not as sophisticated as the analyses suggested in scholarly literature like Ref. 1.
Traditional retailing remains dominant despite the popularity of e-commerce due to lower operational complexity, predictable logistics, and consumers’ reliance on physical store experiences.2,3 Issues like logistical complexities, high costs with automation and regulatory restrictions still exist with e-commerce distribution centers. 4 Therefore, it is necessary to optimize the locations of retail facilities to reduce travel distance and carbon emissions. In Ref. 5 key factors were discussed that determine the location decision of offices, manufacturing plants, or retail stores, while Ref. 6 reviewed key factors for the location decision specifically for retailers. Both papers noted that multiple factors determine the retailers’ location decisions. However, none considered the environmental aspect of transportation a critical factor in the entry decision. In the market context of this research, Swedish consumers travel on average 30 km to brick-and-mortar stores when shopping for durables. 7 Majority of these trips are made by car, and these shopping trips account for about a sixth of the total travel by private cars in Sweden. Therefore, the impact of retailing on the environment has been debated in Sweden, with CO2 emissions caused by the retailing sector being a societal concern.
Most retailers have not considered their environmental impact when choosing locations, which might not be a significant problem if consumer travel to and from stores was efficient from an environmental perspective. However, last-mile retail transport from retail stores or e-tailing outlets is still dominated by consumers’ private cars, making last-mile delivery the most expensive, least efficient, and most environmentally problematic part of the overall delivery process.8,9 An early study by Ref. 10 analyzed the locational optimality of brick-and-mortar stores for a selection of durable goods stores in the Swedish region of Dalarna. They found that CO2 emissions were, on average, 22% higher than necessary for sub-optimal locations than for environmentally optimal locations, and notably, they were up to 35% higher for consumer electronics. Moreover, transportation by professional carriers to retail chain stores or e-tailing outlets was environmentally efficient than the last-mile transportation by consumers 11 .Ref. 12 also demonstrated the importance of good locational choices and sound urban planning to reduce CO2 emissions. Similarly, Ref. 13 revealed that siting retail centers for convenience, rather than in optimal locations, lead to higher CO2 emissions. In general, these studies jointly indicate a considerable potential for reductions in CO2 emissions if retailers could choose the locations of new stores and outlets based on their existing store and outlet networks to limit the need for last-mile transportation.
A GIS based spatial decision support system was demonstrated in Ref. 14, to optimize location of public facilities. However, it does not facilitate estimating carbon emissions or hierarchical selection of geographic regions. In Ref. 15, a generalized facility location and design problem was introduced to identify new facilities where there are existing competitors. However, the study does not estimate carbon emission nor use high-resolution population data. Thus, the novelty of our paper lies in providing a decision support system which optimizes facility locations and quantifies carbon emissions incorporating high resolution spatial, network data using hierarchical geographic regions.
The optimized location that minimizes the last-mile transport and, thus, CO2 emissions are rarely known to the retail chain, and the mathematical tools needed to solve the optimization problem are not readily applicable to most retail chain managers. Retailers could use consultants to address this problem, but at considerable cost and inconvenience since the analysis would have to be redone for each new store entry or exit cycle they are contemplating. Therefore, this paper draws on a research project to build a publicly available decision support system, comprising a web-based tool and detailed instructions, for retailers in Sweden who wish to minimize the need for last-mile transports in their location decisions, which we have called eCOmpass. The contribution of the paper includes the insights and implementation strategy of eCOmpass which can be used to support a wide range of facility location problems.
This web application can be easily accessed with any browser, regardless of the operating system. It was made available in web format as it is a requirement from our research funder. A desktop version of eCOmpass is also available. Some commercial software, such as ArcGIS and Maptitude, provide functions for optimized facility location, although abstracted from the CO2 emissions aspect. The eCOmpass tool has been developed to facilitate environmentally attractive location decisions in Sweden. It is open source and may thus be used for location decisions beyond retailing, and it uses tools such as open street maps to illustrate the locations. Moreover, it may easily be transferred to other geographical markets, provided the market’s spatial distribution of demand points and road network is available. For European Union (EU) member states, the Infrastructure for Spatial Information in Europe (INSPIRE) directive should ensure that such data is of good quality.
This paper is organized as follows. We begin by outlining the architecture of eCOmpass. We then discuss possible data sources with their pros and cons and report on what is implemented in the eCOmpass tool. We then compare the performance of optimization algorithms and further explain how the chosen optimization method was implemented in the eCOmpass tool followed by user testing reports. We finally illustrate applying the eCOmpass tool to an expanding grocery store network in a Swedish municipality followed by concluding discussion where we consider some miscellaneous implementation issues and compare the impact of using the eCOmpass tool to other efforts toward reducing CO2 emissions.
The archetype of the decision support tool
Let
There are two types of business decisions to be supported. The first is the exploratory case. Here, the retailer chooses
In the second exploiting case, the retailer intends to locate
The explore or exploit cases are further separated on a geographical (market) level. In the version of the tool built, the retailer chooses between location analysis on a municipal, regional, or national level.
Figure 1 shows the architecture of the eCOmpass tool. There is a user interface (UI) for data inputting by the retailer. The input should be the choice between exploring or exploiting and the market level. In addition, existing facilities ( A representation of the architecture of the eCOmpass tool, where OD refers to origin-destination.
The eCOmpass tool then outputs the estimated change in produced CO2 emissions attributed to the retailer’s modified facility network in addition to the location of the new facilities. The counterfactual computations and the optimizations are executed on an origin-destination (OD) matrix for
We followed a systematic software development approach when developing the eCOmpass tool. We relied on a methodology previously used to develop a matching tool for consumers and parcel delivery companies in e-tailing. 16 The method, called Waterfall, is one of the most widely used and reliable software development methods.17,18 The sequential development phases of Waterfall are conception, initiation, analysis, design, construction, testing, deployment, and maintenance, with each subject to review and verification before proceeding to the next phase. We conducted conception, initiation, and analysis as we developed the engine (i.e., the data processing part of Figure 1).
For design, construction, testing, and development, we opted for a user case in the form of IKEA’s expansion in Sweden from its first store in 1958 to its latest in 2015, and the results are reported in Ref. 19. The counterfactual analysis in this user case estimates the impact on CO2 emissions and traveled distances caused by rolling out the latest seven stores in Sweden in this millennium. Therefore, our test case is the network of IKEA stores during the period 2000–2015. This user case is provided in detail jointly with user instructions for the eCOmpass tool on the website: https://ecompass.se/.
The focus was on the eCOmpass tool’s user-friendliness and ascertaining its open-source characteristics, meaning that, for instance, sufficient documentation is published for users that want to develop the application further. Regarding maintenance, it is imperative for the project’s business and environmental benefits that the eCOmpass tool continues to function after the project’s completion. As such, the Institute of Retail Economics commits to ensuring that the eCOmpass tool is properly maintained for at least 5 years after the project’s completion.
Data acquisition and the trade-off between potential data sources
The eCOmpass tool requires data on the service (i.e., facility) and demand points as well as the generation of an OD matrix. This section explains how we acquired these data and discusses options.
We start with the service points (i.e., the location of existing facilities and candidate locations for the new facilities). We considered identifying the geocoded locations of the existing facilities in the WGS84 (ESPG:4362) coordinate system via either Google Maps or web-scraping the retailer’s webpage. This solution would simplify the tool’s utilization for the retailer. However, testing this approach revealed that the reliability of retail chains in several locations is prone to errors. This issue can be attributed to delays in updating retail locations on Google Maps. Therefore, the retailer is required to submit a list of geocoded existing facilities. This list can either be in the coordinate system or addresses. In the exploiting case, the retailer is further required to provide a list of the
Regarding the demand points, we used the entire Swedish population as of December 31, 2022. The geocoded population data is publicly available through Statistics Sweden (https://www.scb.se), where each resident is geocoded in a
The population’s geodata provided by Statistics Sweden exist because of the EU INSPIRE directive (https://www.inspire-geoportal.ec.europa.eu/). All EU member states are under the INSPIRE directive. Therefore, in principle, it should be possible to replicate this approach for any EU country or any combination of EU regions.
The transportation between a demand point and a facility generates CO2 emissions. The Euclidian distance is the simplest distance measure between these two points, which is readily computable from the coordinates of the two points. As noted by Ref. 22 in their survey (see also Ref. 23), this has historically been the predominant distance measure used in location analysis. The second most common is the rectilinear distance, also called the Manhattan distance, which is a good measure in urban areas comprised of blocks. However, in his early and seminal paper investigating competing distance measures, 24 considered the network distance in addition to the travel time and cost. To our knowledge, Ref. 25 were the first to implement a detailed measure of CO2 emissions generated by transportation on a road network.
Ref. 26 replicated Ref. 24 investigation in a setting comprising mixed urban, peri-urban, and rural areas. Their conclusion indicates that the Euclidian and Manhattan distances are inadequate measures of the distance traveled on the road network. Therefore, we discourage using the Euclidian and Manhattan distances unless the location analysis is limited to an urban area comprised of blocks, with the prototypical example being the Manhattan borough of New York City.
The most complete digital representation of the Swedish road network is the so-called NVDB (National Road Database) by the Swedish Transport Administration. For location analysis, Ref. 27 built the road network of a Swedish region, and Ref. 28 built the road network of the entire country from the NVDB. This building is time-consuming and complex. The experiences of these two projects and the paper by Ref. 21 indicate that this approach is overly ambitious since a less detailed road network tends to generate comparable location analysis results.
More readily available and transferable alternatives to the NVDB are OpenStreet, Google, and Bing maps. For each of these three alternatives, there are open-source, off-the-shelf tools that allow for computing
Consequently, there are data sources, computational methods and tools that provide
Ref. 30 carefully studied the micro-level CO2 emissions produced by transportation by GPS-tracking individuals using various modes of transportation on the road network with both observational and experimental study designs. Furthermore, Ref. 31 complemented GPS tracking with camera-based motion detection in a parking lot. CO2 emissions depend on the vehicle’s type and engine and the driver’s behavior. However, while traveling, the CO2 emissions follow an irregular pattern, primarily due to changes in traffic flow due to intersections, congestion, and speed limits. Ref. 25 provides a map classifying road segments as low, medium, and high CO2 emissions. An exact calculation of
An OD matrix is required for both the exploring and exploiting cases. Since the OD matrix may be large, we have preconstructed and stored it for general use (Figure 1). Computing
Comparing optimization algorithms
There are several commercial and open-source algorithms which can be used to find optimal locations. Commercial algorithms or solvers like CPLEX and GUROBI are not evaluated in this study as they are not comparable to an open-source tool like eCOmpass. Rather, open-source algorithms like Branch and cut, Simulated annealing, Particle swarm optimization and tabu search are compared and evaluated. The Branch and cut solver has a deterministic allocation and it is utilized to solve linear programming or mixed integer programming problems. 34 The Pulp and Spopt packages in python were utilized to apply this algorithm. Simulated annealing is a meta heuristics method which is inspired by the annealing process in metallurgy. 35 It is a common method applied to solve the p-median problem. The Dual annealing package of SciPy is utilized for its implementation in this paper. Particle swarm optimization is also a meta heuristics method which is inspired by the behavior of birds and fish. Each particle is a solution, and the swarm of particles explore the search space to find the optimum. 36 Pyswarm package is utilized to implement PSO for the problem. Tabu search is a meta-heuristic method which refines solutions iteratively based on local search. A tabu list is utilized which prevents revisiting previous solutions. 37 There are other meta-heuristic algorithms like genetic algorithms and ant colony optimization which have not been evaluated in this work.
Performance evaluation.

The optimization engine of the tool
The eCOmpass tool identifies optimal facility locations considering the demand points and their associated driving routes and distances. At the most granular level, each Swede constitutes a demand point in space. However, some practical implementation aspects were introduced to enable real-time computation and efficient optimization.
First, the demand points depend on the selected geographical level: municipal, regional, or national. A municipality is an area of a region, and the national level includes all regions. As mentioned earlier, geocoded population data on
Second, the population grids are also used to define eligible candidate locations. Ref. 28 stressed that a location without a settlement does not make sense as a candidate due to a lack of demand and workers to operate the facility. Therefore, candidate locations are only those grid center points constituting a demand point with the same geographical granularity as above. However, we impose an additional requirement that the grid should have at least 100 inhabitants at the municipal and regional levels and 1,000 inhabitants at the national to be an eligible candidate location. When converted into grid average population density, this reflects a minimum of 100, 4, and 2.5 inhabitants per km2, respectively. Practically, this imposed requirement implies that municipal localizations are limited to peri-urban and urban areas of the municipality, whereas regional and national localizations may also be in rural areas.
Third, the maximum number of existing facilities that can be added to the eCOmpass tool is 100. Further below, we use the grocery chain COOP as an example. COOP is one of the largest grocery store chains in Sweden, with some 800 stores. However, the retailer is divided into local divisions based on geography. The market studied in this paper, Borlänge municipality, belongs to COOP Mitt, with 93 stores in the regions of Gästrikland, Hälsingland, Dalarna, Uppland, Närke, and Västmanland. As such, there are very few examples in Sweden of retailers having 100 or more stores at the relevant geographical levels for location analysis. This restriction reduces the complexity and computational costs of the application. It also reminds the user to consider selecting a lower geographical level for the location analysis whenever this makes business sense.
Fourth, the OD matrix was previously generated at each instance. However, the real-time user experience of the tool was hampered by the unpredictability of processing time. Therefore, OD matrices have been precomputed and stored for many of the about 320 geographical options in Sweden. However, the OD matrix is still computed in real-time for some municipalities with small populations and, consequently, a low-dimensional OD matrix.
Fifth, the OD distance matrices are converted to CO2 emissions matrices based on the approximation proposed by, Ref. 11 where 1 km = 0.15 kg of CO2. The emissions and traversed distance are generally highly correlated unless electric vehicles are utilized; however, only 4% of private cars are currently electric in Sweden. Therefore, this emissions approximation works well, especially in the optimization problem.
Sixth, in the explore mode, the problem of identifying environmentally optimal new locations is an NP-hard problem. This issue is solved in the eCOmpass tool by applying the branch-and-cut algorithm on the OD matrix. We chose this option since it reduces search complexity, improves efficiency, and facilitates global optimality, as discussed in Ref. 38.
UI choices and the validation testing
The eCOmpass tool can be accessed using a mobile or personal computer. However, a personal computer is better suited to using the tool due to the data inputting step. eCOmpass uses HTML for the front-end and Flask and Redis for the back-end tasks. HTML is a popular hypertext markup language used to structure and display webpage content. Flask provides a web framework that facilitates integrating the Python programming language and creating the web application part of the eCOmpass tool. Python was chosen because it is a versatile, high-level language with a wide range of libraries and services that bridge software development and data science. One such example is the PULP library, which provides a solver that utilizes mixed integer and branch and cut algorithms to solve the optimization problem of identifying the candidate facility locations that minimize CO2 emissions.
The OD matrices and the auxiliary data required for the explore and exploit modes are moderately large, which made us choose GitHub as a database to store demand points along with their weights and other relevant data. Redis is a remote dictionary server that supports job queues and asynchronous tasks. It supports multi-threading, which helps to reduce processing time. Finally, the developed prototype of the eCOmpass tool was deployed for testing using Microsoft’s Azure web services, a cloud platform that supports building, deploying, and managing web applications.
The user interacts with the eCOmpass tool using HTML forms, where they choose the geographical level and whether the analysis is in explore or exploit mode as referred in Figure 1. The user then either selects the explore or the exploit option and may optionally upload existing and potential facility locations using a CSV file. The CSV file should contain locational information of facilities and whether the facility is an existing (i.e., predetermined) or potential location. Existing facilities are tagged with a “1” and predetermined candidate locations are tagged with a “0”. Facility locational information may be provided as addresses or coordinates. However, using coordinates is advised to avoid potential errors in geocoding. Furthermore, the number of recommended locations is also provided in the HTML form. In the output, the submitted locations are visualized on a map with existing facilities depicted by blue icons to allow the user to visually verify the correctness of the submitted data. Predetermined new locations and new locations suggested by the eCOmpass tool are depicted by red icons instead.
Since the eCOmpass tool works with spatial data, visualizing these locations on a map is desirable. For this purpose, open street maps are provided when the WGS84 coordinate system is used to display locations of facilities. As mentioned earlier, the spatial aggregation of the demand points varies based on the geographical level of the analysis. The visualization is consistent with this aggregation where each facility location identified by the eCOmpass tool is displayed as a position and buffer area, with the latter’s size contingent on the concerned aggregation. The circular buffer area size is 1 km at the municipal level, 5 km at the regional level, and 20 km at the national level. We chose these sizes based on the amount of aggregation of the demand points used for the respective geographical level.
The eCOmpass tool prototype has undergone both static and dynamic testing, consistent with the recommendations by Refs. 39 and 40. The developer conducted the static testing, performing a review and walkthrough of the code. Functionality and user acceptance testing was performed dynamically, engaging some 15 external users over a 2-month period. These external users had varied experience with location analysis but either had some expertise in either transportation or economic geography or were IT professionals. The feedback from these external users was iteratively collected and assessed for revisions of the eCOmpass tool. As an additional test of the eCOmpass tool, a complete analysis of the historical roll-out of IKEA’s store network in the current millennium was conducted 19 and is provided on the eCOmpass website for instructional use.
Illustrating eCOmpass with a synthetic use case
As mentioned above, an illustration with user data and instructions for IKEA’s national location analysis is provided on the eCOmpass website. Here, we provide another illustration using a local (municipal) location analysis of the store network of grocery chain COOP (https://www.coop.se), a national food cooperative. The COOP began in the late eighteenth century and is one of the oldest grocery store chains in Sweden. It is connected to the internationally dispersed cooperative movement in which members (customers) collectively own and manage the business. Therefore, the customer base distinguishes itself from other grocery stores, making it relevant businesswise to use the eCOmpass tool for COOP stores separate from other grocery stores. In Sweden, the COOP has approximately 800 stores nationwide and 30 in Dalarna. We examined CO2 emissions relating to the locations of its two current COOP stores in the Borlänge municipality in Central Sweden. Borlänge is a municipality of slightly more than 600 km2 with a population center of 35 km2 and a total population of 52,193 inhabitants concentrated along the river that flows through it in a northwest-to-southeast direction. The OD matrix for the Borlänge municipality is a
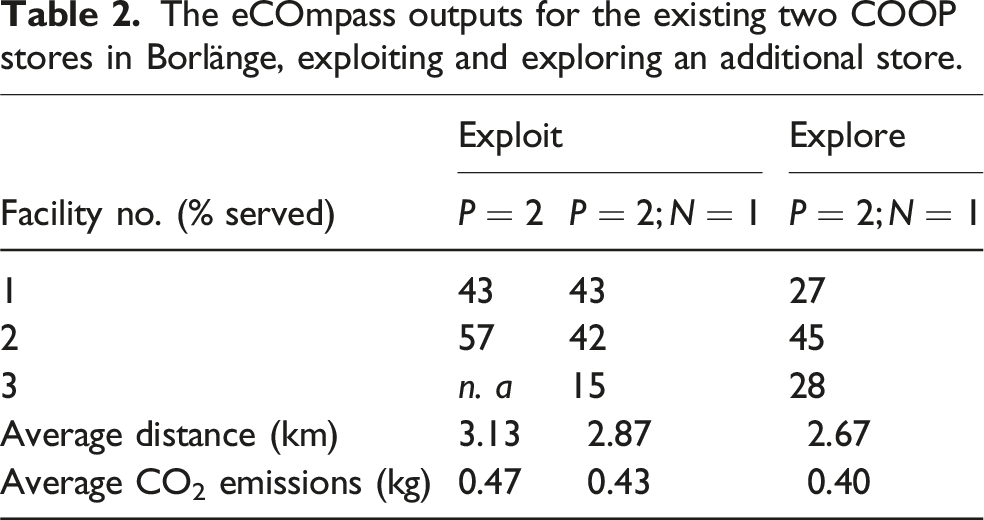
In Figure 2, the two existing COOP stores are depicted by square icons. As provided in Table 2, the northern store currently serves 43% of the population and the central 57%. The average distance to the serving store is 3.13 km, resulting in average CO2 emissions of 0.47 kg. These outputs were found by uploading the CSV file with the coordinates of the two stores, selecting the choice of exploit mode, and setting Existing COOP locations (blue icons) in Borlänge and some eCOmpass suggestions after adding one additional store in the municipality. The eCOmpass outputs for the existing two COOP stores in Borlänge, exploiting and exploring an additional store.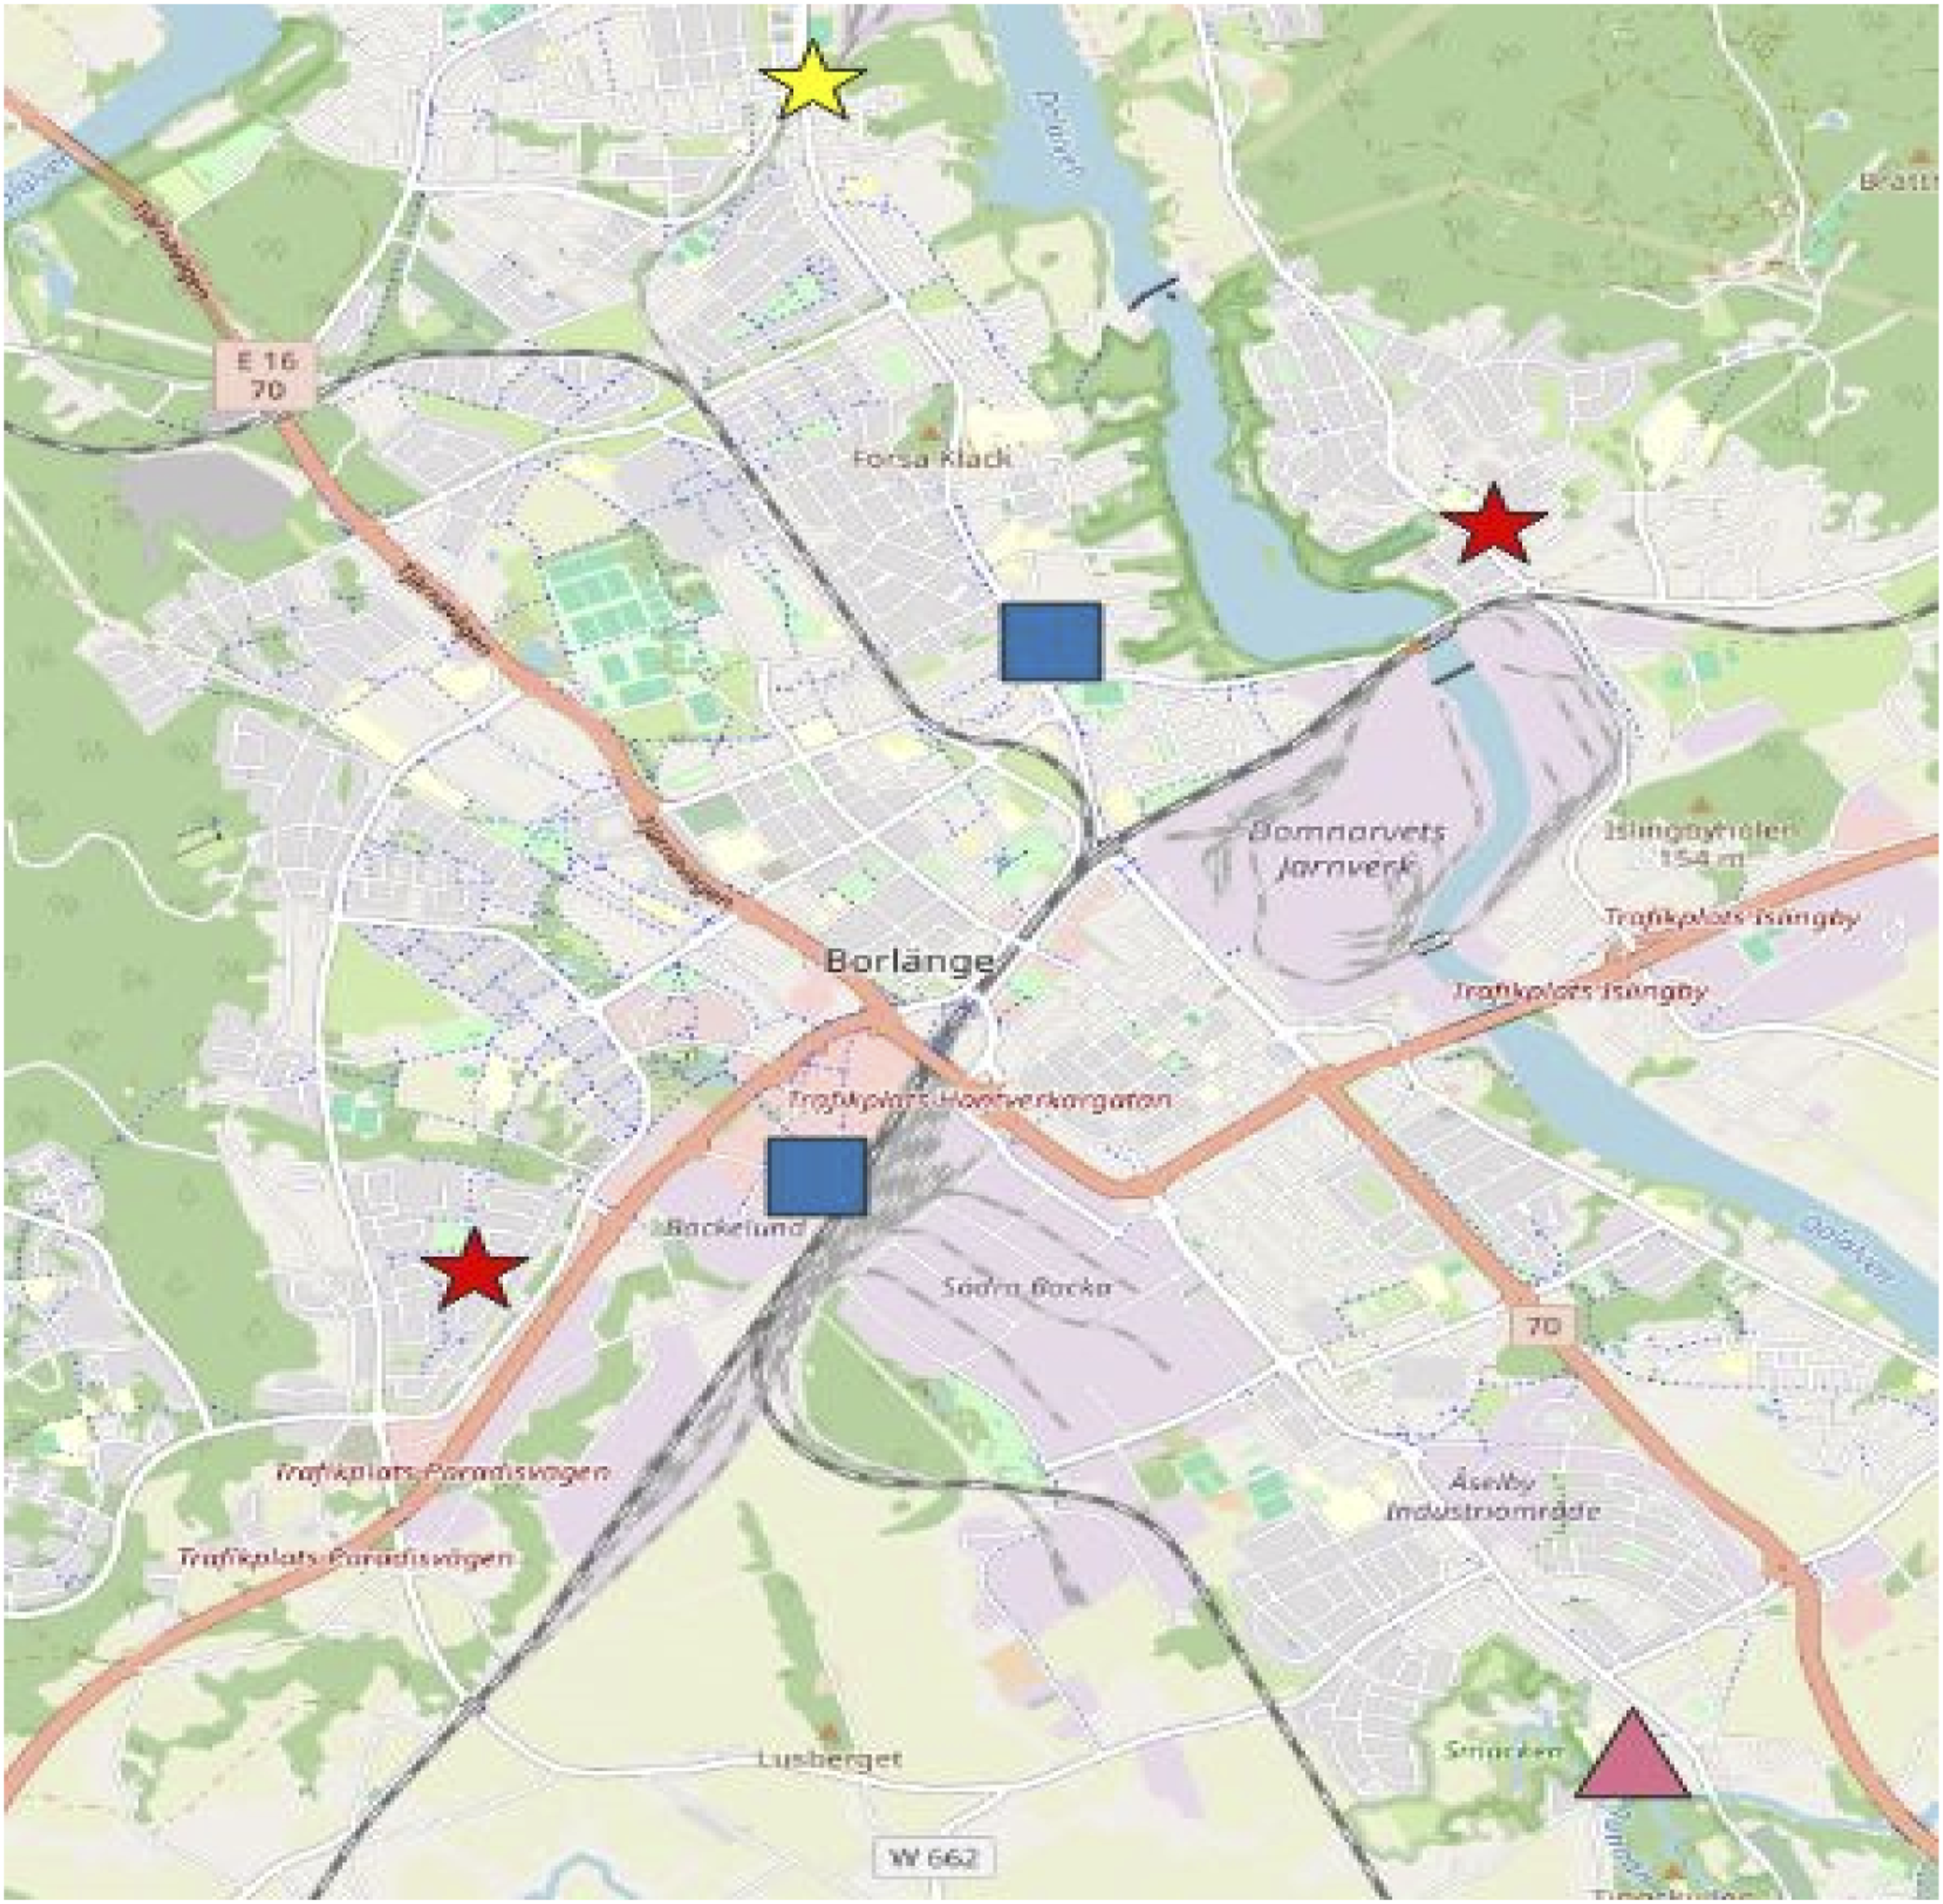
Now, assume that COOP was contemplating adding a store to their network in the municipality. In a first exploit case, it is assumed that they consider three predetermined locations, S. In Figure 2, these three candidate locations are marked by star icons. We selected these three locations because they represent the three major family home residential districts in Borlänge. This case was evaluated by running the eCOmpass in exploit mode, with
It comes naturally to benchmark the solution above with the best possible location of a new store. In this thought experiment, it is assumed that the third store may be located anywhere in the municipality. This assumption was tested by uploading the locations of the existing stores to the eCOmpass tool, choosing the explore mode, and setting
In Figure 3, we compare the locations of the current COOP stores and the locations suggested by the eCOmpass tool for the examined exploit and the explore cases. It includes the visualizations provided by the eCOmpass tool in its output, where the blue color highlights existing stores and the red highlights the new store locations it identified. The locations are indicated as both a position and a buffer circle with a radius of 1 km for this geographical level to properly account for the spatial error introduced by the spatial aggregation of demand points and candidate locations. The existing COOP locations (blue icons) in Borlänge and eCOmpass solutions for exploit (b) and explore (c) after adding additional store(s) in the municipality.
Concluding discussion
One set of location problems is known as on-the-flow localization, where the business intends to serve the customers on route. A typical case is gas stations. The eCOmpass tool is not applicable to such problems; it is intended for localization problems where the facility attracts customers to itself. Many retailers are of this kind, but so are many other facility types, such as schools, sports arenas, and veterinary clinics. The eCOmpass tool may be used for location analysis of such facilities without further amendments.
One current restriction of the eCOmpass tool is that it is applicable only to the Swedish market. As discussed in this paper, its open-source nature and building blocks ensure its transferability to other markets. We consider the only critical data source to be the digital, spatial representation of demand in the concerned market. In principle, the EU INSPIRE directive should mean that at least all EU member states should have access to comparable data to Sweden; however, we do not know whether this is the actual case. Most European markets have substantially smaller areas and greater customer densities than the Swedish market. We recommend deciding on any spatial aggregation of demand points and candidate locations based on the particular market rather than re-implementing those applied here for Sweden.
The computational cost of the eCOmpass tool is highest when computing the OD matrix or running the optimization algorithm in the explore mode in highly populated areas. The processing time can vary from a few seconds to minutes or even hours based on the chosen N and the market’s population. This computational complexity led us to implement a background worker like Azure cache. Since online websites do not maintain the connection to the server beyond 180 seconds, using background workers enables the retaining and printing of outputs even after the server connection is terminated. Problems of this kind are further exacerbated by multiple users concurrently accessing the tool. When the CPU is occupied on a longer-running task, the next user will experience a noticeable delay unless memory is allocated to concurrent users. However, the latter would be expensive to maintain for long periods. The deployment presented in this paper utilizes cloud resources like Azure, creating these multi-user issues. Consequently, we intend to use a local instead of a cloud server in the future. Using a local server might create some restrictions on scalability, but the costs of hosting and maintaining the website would be significantly reduced.
Can the eCOmpass tool impact CO2 emissions? The COOP illustration suggests a scope of reducing the CO2 emissions per store trip by 15–20%, which is the low end of the many retail cases we have examined over the years. A reduction of 25–35% would be more common. To put this opportunity into perspective, several political and public efforts have been made to reduce transport-related CO2 emissions. In 2009, the EU Renewable Energy Sources (RES) directive set the goal of 10% of member states’ transportation-related energy consumption being from renewable resources by 2020. To achieve this goal, the EU attempted to stimulate the transportation sector’s uptake of biofuels and electricity. Besides direct regulation and emission taxation, the EU also implemented other emission mitigation strategies, such as Eco-driving, by educating drivers in efficient driving techniques. A report by the Swedish National Road Administration 41 reported that about 1% of Swedish drivers had been trained in eco-driving over a 10-year period. Moreover, the Netherlands, which had the world’s most ambitious eco-driving strategy, achieved about 20% of drivers adopting eco-driving but at the cost of 30 million euros. The Dutch strategy resulted in a 2% reduction in CO2 emissions by motorists.
Several cities have also implemented congestion charges to reduce congestion and related CO2 emissions. In Sweden, congestion charges were implemented in Stockholm in 2007, and their societal impacts have been extensively studied and stimulated similar policies in other cities. For the Stockholm case, a 14% reduction in CO2 emissions by inner-city traffic was reported, translating to a general reduction of 2-3% in metropolitan Stockholm. 42 While some retailers in Stockholm expressed concerns that introducing the charges would negatively affect their sales, this was not the case, and their introduction seems to have mainly had positive environmental effects.43,44
Comparing transport-related CO2 emissions in Sweden in 2009, the year the RES directive was implemented, to today, it can be argued that the political and public initiatives have been successful since CO2 emissions have fallen by about 35% (The Swedish Environmental Protection Agency, https://www.naturvardsverket.se). However, driven by public initiatives, this reduction might now and in the future be leveraged by the private actors responding to consumers’ demand for sustainable products. We believe that the eCOmpass tool can achieve a comparable reduction in CO2 emissions by targeted location analysis.
The eCOmpass tool does not address all the complexities associated with facility location. It does not consider capacity constraints of the facilities which would improve inventory optimization and customer experience. Similarly, it does not evaluate emissions involved in building a facility nor does it consider competitiveness or availability of a facility location. The population density is utilized as weights in the tool. The user cannot modify or update weights for a geographical region limiting the tool’s dynamic capabilities. We intend to address some of these limitations in our future work.
Footnotes
Funding
The author(s) disclosed receipt of the following financial support for the research, authorship, and/or publication of this article: this work was supported by the Familjen Kamprads Stiftelse: 20200049.
Declaration of conflicting interests
The author(s) declared no potential conflicts of interest with respect to the research, authorship, and/or publication of this article.