
Abstract
Ghana addresses its energy challenges by promoting policies to diversify the energy mix, reduce reliance on imported petroleum, and promote its green economy. Ghana’s Bioenergy Policy underscores this transition by promoting biofuel integration into Ghana’s petroleum supply chain to diversify the energy mix and reduce reliance on imported petroleum. However, the lack of robust infrastructure for biomass-to-biofuel supply chains presents a significant challenge. This research aims to address this gap by integrating biofuels into the existing petroleum supply chain and optimizing the distribution taking into account the unique infrastructural, economic, and logistical challenges. The study used a mixed integer linear programming (MILP) model to model the integration of biofuel into Ghana’s petroleum supply chain and subsequently analyzed different production scenarios using statistical data. The simulation results suggest that to achieve the targeted 20% biofuel integration goal, the country needs to produce up to 465,000 Mt of bioethanol and 528,000 Mt of biodiesel. Blending biofuels with fossil fuels can promote Ghana’s energy sustainability and security, job creation, and economic benefits, including incurring an opportunity cost of US$845 million from fossil fuel imports annually. Hence, strategic planning and investment in infrastructure are essential to leverage the benefits of biofuel and support Ghana’s sustainable energy transition. The research brings clarity to Ghana’s agenda of integrating 20% biofuels into Ghana’s petroleum supply chain by 2030, indicating the benefits and the essential investment required.
Introduction
Perhaps climate change and energy sustainability are the central topics on the globe due to the increasing impact of these challenges on human health, environment, and social wellbeing. Efforts are directed toward the threat of climate change associated with the rise in greenhouse gas (GHG) emissions and the consequent concerns about the long-term environmental sustainability of population and economic growth. 1 According to the World Energy Outlook (WEO), global energy demand is expected to increase by 45% by 2030, dominated by fossil fuels (coal, oil, and gas) driven mainly by developing countries. 2 Pelizan et al. 3 argue that although fossil fuels have provided enormous economic benefits, playing crucial roles in economic expansions globally, their trade-offs in environmental pollution, such as high greenhouse gas (GHG) emission, give rise to an additional concern that necessitates consideration. The aggravating and prevalent climate change caused by prolonged fossil fuel use is becoming critical, and several organizations are committing to limiting carbon footprints and their associated impact. In this context, the Paris Agreement aims to hold the global warming temperature rise to 2°C with a foresight of limiting it further to 1.5°C in the future above pre-industrial levels. 4 The United Nations (UN) reports steady progress toward the Universal Access to Clean and Affordable Energy goal- Sustainable Development Goal-7 globally, despite sub-Saharan African states reporting declining. Energy poverty is a critical challenge in the region and is projected to increase further, leaving over one billion residents lacking access to clean energy by 2030. 5
Like several sub-Saharan African countries, Ghana is heavily impacted by climate change. It faces increasing vulnerabilities, exacerbated by its reliance on natural resources, especially in agriculture, which contributes about 21% of the GDP and employs over 38% of the total labour force. Leveraging the region’s vast arable uncultivated land, reported close to 60% of the world’s forest reserves and heavy agro-wastes, which can provide feedstock for biofuel production, is an innovative approach to green economy (GE).6–8 As it stands now, Ghana is a net-energy import-dependent country with about 95% of fossil fuel use outsourced, exposing the country to vulnerabilities, including supply chain market disruptions and volatility of global energy prices.9,10 There is an urgent need to diversify the energy mix by transitioning to a low-carbon energy solution like renewable energy (RE) to address the social, environmental and economic concerns. Ghana is actively promoting policies to encourage greater utilization of renewable energy, which aligns with global sentiments. The Ghana Energy Transition and Investment Plan (GET & IP) policy, introduced in 2023, focuses on the shift towards low-carbon renewable energy solutions, like biofuels, to replace fossil fuels in transportation. The ultimate aim is to achieve the climate goal of Net Zero carbon dioxide (CO2) emissions by 2060. However, the immediate goal is to integrate 20% biofuels into the national petroleum supply chain by 2030, according to the Ghana Bioenergy Policy (BEP).10–14
The narratives surrounding Ghana’s RE transition are intricate and multifaceted. Despite having an abundant feedstock supply for biofuel production, the absence of biomass-to-biofuel supply chain (BSC) infrastructure, along with technology and technical concerns, are the country’s main barriers to biofuel development. Capital cost for setting up these infrastructures is a significant economic hurdle for most developing countries, while integration with other supply chains presents an opportunity to offset some costs.7,15,16 Yue et al. 17 research analyzed three (3) main approaches for integrating BSC into the fossil petroleum supply chain, namely: (1) processing crude oil with biomass extracts within a conventional refinery, (2) introducing the semi-processed biomass with a specific level of processing in the conventional refinery, and (3) blending the completely refined biofuel and fossil fuel stocks. Therefore, the imperative remains the critical consideration of biomass/biofuel insertion points, choice of conversion technologies, and existence and capacity level of biorefineries. 18
To capitalize on the opportunities in biofuel production, balancing food security and land management imperatives and prioritization of the limited resources is critical. To ensure the sustainable transition to biofuels, biofuel production must comply with policy and regulatory requirements, environmental sustainability and market dynamics to ensure optimal environmental, economic and social outcomes.15,18 Biomass-to-biofuel supply chain (BSC) optimization is an integrated process to enhance efficiency and sustainability and minimize wastage across environmental, social, and economic dimensions. GHG emissions are associated with the various stages of the BSC, including feedstock transportation, biomass processing, biofuel distribution and final biofuel use. Therefore, selecting suitable locations to minimize transportation across the supply chain is essential while enhancing operational efficiencies and reducing costs.18,19 Cost reduction strategies, including biofuel integration, distributed supply chain and economies of scale, can effectively promote economic benefits from BSC. 20 Aligning the location of biofuel production facilities with the existing petroleum supply chain offers significant cost savings, such as transportation costs, to leverage the benefits of integration. 19
Biofuel supply chain decision-making can be classified into strategic, tactical and operational levels. Strategic planning is the long-term plan that can affect the entire lifecycle of the BSC, which involves decisions on feedstock, processing technology, supply chain network design and capacity planning. Tactical and operational level decisions are the medium to short-term actions that align with the strategic decision, which includes resource allocation, inventory planning and supply chain logistics. Adopting the right planning tool helps determine cost-effective methods of biofuel production, transporting and handling, thereby enhancing the competitiveness of biofuel products in the market and reducing their environmental impacts.17,21 Demand forecasting enables players in the BSC selectively determine the allocation of resources to support sustainable production practices and facilitate long-term planning. 22 Integrating services such as On-Demand Services (ODS) in BSC planning models provides the consumer and service providers (Oil Marketing Companies (OMC), etc.) flexibilities like blend ratio selection can enhance service quality and competitive market. ODS also enables producers and service providers to optimally align available resources with customer needs and regulatory requirements, thereby creating profit enhancement opportunities. 23 By providing answers to the following questions; (1) how can a mathematical optimization models be used to support production planning of biofuel production supply chain? and (2) to what extent does biofuel adoption support sustainable energy transition in developing countries? The research aims to provide a tailored solution to sustainable biofuel transition with Ghana serving as a case study.
State of the art
Over the years, researchers have conducted a wide range of studies on biofuels, and exploring Ghana’s sustainable energy landscape reveals a plethora of empirical research that provides invaluable insights into the present study. Much of these researches were focused on biofuel production feedstock assessments, classified into first-, second- and third-generation feedstock. First and second-generation feedstock has been the most in-depth studied, with researchers like Pelizan et al., 3 Kwao-Boateng et al., 24 and Asante et al. 25 highlighting the viability of palm kernel oil and jatropha for biodiesel production, whereas feedstock including corn, cassava and sugarcane for bioethanol production. These studies detailed their production seasons, location analysis and yield volume for biofuel production. Nelson et al. 26 explored non-conventional feedstock, including agricultural wastes, emphasizing their advantage in navigating the food-energy nexus over conventional feedstock. Studies on third-generation feedstock in the study region remain limited, with studies like Owusu et al. 27 exploring sargassum seaweed for bioethanol production, presenting these feedstocks as more sustainable. Collectively, these studies are essential for establishing biorefineries with the right technology to process the feedstock in the context of this study. Infrastructure and resource assessment has been pivotal in identifying the gaps in current infrastructure, providing opportunities for optimization, identifying the resource availability and outlining the bottlenecks in establishing biofuel distribution in Ghana. Research conducted by Singh et al. 28 and Sarkodie et al. 29 examined Ghana’s resources and infrastructure required for biofuel production, emphasizing the critical importance of establishing a biofuel processing plant to facilitate large-scale production. Studies like Ansah 30 and Brinkman et al. 31 have explored biofuel production’s social and environmental challenges, specifically regarding food security and land management. These studies emphasize optimizing BSC and planning resources to avoid negative consequences. The reviewed studies have provided comprehensive insights to support decision-making in selecting the most suitable resources for biofuel production, ensuring compliance with regulations, and offering valuable information on the challenges associated with biofuel in Ghana. The reviewed studies inform the approach to tackle these challenges. Nevertheless, there is a substantial gap in the mathematical optimization-based decision support models for optimizing BSC within the study region.
Researchers have applied several mathematical optimization methods for BSC for economic, social and environmental objectives in many ways. Zahraee et al. 32 and Sun and Fan 33 highlighted mathematical optimization’s effectiveness in supply chain logistics, particularly in managing BSC from various perspectives, such as operational, tactical and strategic planning levels. Zahraee et al. 32 reviewed biomass-to-biofuel (BSC) modeling and optimization, accessing up to 300 papers published in the past 40 years. The paper emphasizes the consistency of researchers using mixed integer linear programming (MILP) modeling to address various problems across strategic, tactical, and operational levels of planning. They stressed that MILP is generally preferred due to its simplicity and ability to integrate non-linear real-world constraints. Similarly, Sun and Fun 33 analyzed studies across the entire BSC, reviewing the widely researched operations components and mathematical models. They stressed the application of MILP in mathematical optimization with BSC. At the same time, other models like integer programming (IP), mixed integer programming (MIP), non-linear programming (NLP) with heuristic algorithms like the genetic algorithm (GA), tabu search (TS) and ant colony optimization (ACO), are also widely explored. Overall, MILP with single objective economic optimization is BSC’s most commonly explored mathematical model.
Abdel-Aal 23 developed a metaheuristic MILP model with a profit maximization objective in Pakistan based on customer demand. The study, while applying tactical level planning on electricity production from biomass, aimed to minimize the time for transportation within the centralized supply chain. The study considers a processing plant that utilized a biomass feedstock to generate electricity with no emphasis on conversation technologies for use in the transportation sectors. Ivanov et al. 34 modeled a multiple objective MILP focusing on operational and strategic level planning using dairy waste scum feedstock for biodiesel production in a real case study from Bulgaria. The study was implemented based on the existing BSC, focusing on finding the optimal location for the biorefinery, the refinery’s production capacity, and transportation scheduling for biofuel distribution. The study focused only on biodiesel and did not emphasize the other biofuel types and blending. Similarly, Moretti et al. 19 focused on bioethanol production. The study leveraged a single, economic objective MILP model for optimizing BSC in Italy to minimize costs. A strategic planning level was explored to select the optimum location for biofuel production facilities, including feedstock production, pre-treatment, refinery and storage, making provision for blending; however, the customer sites were not accounted for. Furthermore, Tesfamichael et al. 16 designed a biomass-to-biofuel supply chain (BSC) focusing on tactical and strategic decisions over 20 years within Ethiopia, using a multi-objective economic optimization MILP model. The study tackled the major challenge of biofuel adoption in developing countries: the lack of production and distribution infrastructure. However, the study failed to address the customer distribution in the BSC network. León-Olivares et al. 35 applied strategic planning in BSC in Mexico focused on feedstock assessment, pre-processing and storage locations. The study applies an economic objective MILP, minimizing the total cost of bioethanol supply. The model considered the entire biofuel supply chain, from biomass harvesting to customer demand sites, offering valuable insights for optimizing biofuel integration scenarios. However, the research was limited to bioethanol supply, neglecting other types of biofuels such as biodiesel.
The reviewed studies thus far have provided valuable insights into the strategic, tactical and operational planning levels. In contrast, most studies addressed the network design problem, and location selection was the most studied. However, the studies have focused on upstream and mid-streams of the biofuel supply chain network with little focus on the customer demand regions, while blending facilities are mostly ignored. This gap remains a significant challenge to realizing biofuel use in a ‘developing countries’ context where prevalent challenges exist, including limited infrastructure, complex economic issues and novelty in biofuel adoption, including setting up a holistic BSC infrastructure. 16 Therefore, it has become mandatory to incorporate the existing fossil fuel supply chains into the biofuel network design problem if biofuel planning is to be extended to developing countries. Considering the existing petroleum infrastructure, this study leverages MILP to develop a tailored, cost-effective, and sustainable biofuel integration model using real-world cases from a developing country. By leveraging the gaps in the reviewed papers, the aim is to develop a strategic-tactical planning model to optimize the midstream and downstream BSC focused on production and distribution. The study adopted e-commerce (technology) for customers’ direct requests for biofuel at a preferred blend ratio, providing much flexibility and aiding in demand planning and resource allocation.
Statement of the problem
The primary goal of this study is to model an integrated strategic and tactical planning approach for integrating biofuel and fossil fuel supply chains, with a particular emphasis on production and distribution efficiencies. The study focuses mainly on optimizing the midstream and downstream segments of the biofuel supply chain, leveraging the petroleum supply chain infrastructure to minimize costs (economic optimization). Strategic decisions include network design that inculcates biofuel blending and distribution to customer sites, technology adoption, capacity planning and storage logistics. Meanwhile, tactical planning involves production planning and inventory management across the BSC and the existing petroleum supply chain facilities. The model incorporated the locations of the petroleum infrastructure, including transportation modes, oil terminals, and customer locations, while considering multiple products, echelons and periods. The objective of the MILP model is to minimize the cost along the BSC structure (economic) while analyzing its impact on society and the environment. This model consists of four main echelons: biorefineries, Bulk Import, Distribution and Export Companies (BIDECs), oil terminals, and customer demand areas (OMCs), as depicted in Figure 1. (1) The process begins with customers pre-ordering biofuel-fossil fuel blends using E-commerce through a central regulator (NPA), as shown in Figure 2. (2) The central regulator then relays this information to the available biorefinery for biofuel production, which is then transported to the oil terminal for blending. (3) Fossil petroleum imports, aligned with the customer demands, are conveyed through pipelines mainly into the country through the oil jetty and oil tanker ships to the coast terminals. (4) Blending technologies are then utilized at these terminals to mix biofuels and fossil petroleum in predetermined ratios, yielding blended products. (5) The ordered product can then be supplied to the customer through the central regulator. Superstructure of the proposed supply chain. Source: Author’s construct (2024). Production planning and distribution of biofuel through E-commerce. Source: Author’s construct (2024).


E-commerce offers an effective tool for production planning and distribution of biofuels by providing a platform for inventory management, as highlighted by Li et al. 36 The study emphasized the importance of stakeholder collaboration to ensure effective planning and decision-making. Figure 2 provides an approach to effective E-commerce production planning of biofuel-fossil fuel distribution.
The following assumptions were made during the development of the MILP model: (i) Identical trucks with fixed capacity are available to transport all types of biofuels. (ii) There is enough feedstock available for biofuel production to feed the system. (iii) Sustainable infrastructure, including biorefinery, oil terminals, and customer sites, is available to facilitate the supply and distribution of biofuels. (iv) Biofuels are assumed to have homogeneous characteristics, allowing for the blending with fossil fuels. (v) Fixed blend ratios are assumed for all oil terminals throughout the study period. (vi) Fixed and predictable costs are assumed. (vii) Gasoline is required to blend with bioethanol, and gasoil is blended with bioethanol, while the two products are assumed to have homogeneous characteristics.
The following paragraph discusses the MILP mathematical model; refer to Appendix 1 for the nomenclature.
Methodology
The research approach involves (1) developing a MILP model, (2) validating the model using statistical data, and (3) analyzing results based on the scenarios. The analysis consisted of 5 scenarios selected to imitate the study region’s biofuel integration policies and regulatory requirements. The Bioenergy Policy (BEP) prescribed 10% and 20% biofuel integration for 2020 and 2030 respectively represented as scenarios 1 and 2. Scenarios 3 and 4 were modeled considering 30% and 40% integration for 2040 and 2050 respectively, while scenario 5 representing 100% integration for 2060 was based on the Ghana Energy Transition and Investment Plan Policy (GET&IP). The solution approach involves the optimum product transportation through the various nodes, modeled as a capacitated vehicle routing problem (CVRP). For the CVRP, using fixed and predetermined routes, a fixed capacity bulk road vehicle (BRV) is assumed to transport biofuel from the biorefinery i, to the oil terminal j, and the customer site n. This section discusses the MILP model, consisting of the objective function and constraints. Refer to Appendix 1 for nomenclature.
Objective function:
The aim is to minimize the total costs along the BSC. The equations define the cost function involving production, transportation, bending, storage and distribution costs given below:


Subjected to:
The MILP model incorporates various constraints to reflect real-world limitations and ensure the feasibility of solutions. These constraints include:


The first section (objective function) minimizes the total cost along the BSC. These costs are the cost of biofuel production at the biorefinery (equation (1)), the cost of transportation for biofuels from the biorefinery to the oil terminal (equation (2)), the cost of blending biofuel with fossil fuel at the oil terminal (equation (3)), the cost of storage of biofuel at oil terminal (equation (4)) and cost of transportation for biofuel-fossil fuel blend from the oil terminal to the customer site (equation (5)). Overall, equation (6) gives the total cost function along the BSC, which integrates multiple types of biofuels (b), a set of biorefinery locations (i), a set of oil terminals locations (j), a set of fossil fuel types (f), the ratio of blending (ѱ), set of customer location (n) and the specific year (t).
The second section deals with the minimization problem constraints. Equation (7) ensures lean manufacturing of biofuels by matching the demand by production. Similarly, equation (8) limits biofuel production to the biorefinery’s capacity. Equation (9) ensures the total biofuel produced is transported to the oil terminal using a fixed-capacity vehicle fleet. At the same time, equation (10) also ensures enough room at the oil terminals for biofuel storage to prevent overstocking. Additionally, equation (11) sets a maximum threshold for fossil fuel imports, limiting it based on the blend ratio to regulate the proportion of biofuel in the final product. Equation (12) ensures the total biofuel-fossil fuel blend is transported from the oil terminals to the customers, while equation (13) ensures the quantity of biofuel in the mixture is the proportion of the blend ratio to the fixed-capacity vehicle fleet. Equation (14) stipulates that at least one operational biorefinery must be available at any given time to sustain biofuel production. Equation (15) guarantees the availability of blending technology in the oil terminal for blending and storing biofuel-fossil fuel mix. Equation (16) ensures the availability of customers, which is essential for the sale and distribution of biofuel blends. Lastly, equations (17)–(19) enforce non-negativity constraints in the decision variables.
Data
The National Petroleum Authority of Ghana provided statistical data comprising 48 Bulk Distribution Companies (BDCs), 235 Oil Marketing Companies (OMCs), and 30 bulk oil terminals (storage depots) nationwide (see Figure 3). This dataset covers comprehensively the petroleum demand and supply in Ghana, ensuring the robust outcome of the research.
10
Map of petroleum distribution infrastructure locations in Ghana. Source: Google maps (2024).
Distance between biorefinery and oil terminal location (km).

Source. Author’s construct (2024).
Distance between oil terminal and OMC distribution points (km).

AR = Ashanti Region; GAR = Greater Accra Region; WR = Western Region; VR = Volta Region; ER = Eastern Region; BAR = Brong Ahafo Region; CR = Central Region; NR = Northern Region; UER = Upper East Region; UWR = Upper West Region.
Source. Author’s construct (2024).
Input parameters.

Note. 1 US$ = GH¢ 16.09.
Source. Author’s construct (2024).
Results and discussion
The developed MILP model was implemented using the Generalized Algebraic Modelling System (GAMS) version 28.1.0 and solved with the IBM ILOG CPLEX v28.2.0 commercial solver. A laptop equipped with Intel i7-6700HQ @ 2.60 GHz processor, 8 GB RAM, and Windows 10 OS was used to run the simulations. The results for validating the model using empirical data were presented and discussed. The simulation results and cost analysis of the proposed scenarios will help determine the region’s most appropriate biofuel use policy. The robustness of the MILP model was tested using 5 scenarios. The first two scenarios were based on the specific requirement of the Ghanaian Bioenergy Policy (BEP) objectives for 2020 and 2030, which are 10% (E10, B10) and 20% (E20, B20) biofuel blends, respectively. Additionally, two other scenarios involving adjustments to the blending ratios (ψ) for 2040 and 2050, consisting of 30% (E30, B30) and 40% (E40, B40) blend ratios, were considered. The final scenario (scenario 5) represents an extreme case where a 100% (E100, B100) biofuel integration is assumed to assess the Ghana Energy Transition and Investment Plan’s net zero emission (NZE) across all sectors’ goals for 2060. By varying ψ, the analysis discussed the optimal solutions aligning with the study objectives.
Scenario 1 (E10, B10)
Scenario 1 (base scenario) provides an essential foundation for analyzing all other scenarios. The target was to implement the BEP 2020 goal of 10% Biofuel blend (that is, 10% bioethanol (E10) and 10% biodiesel (B10)) in the study region based on the actual petroleum consumption data. Annual production of 152,689 Mt of bioethanol and 193,164 Mt of biodiesel was forecasted to meet the 10% blend ratio goal. An ideal biorefinery with a total production capacity of 200,000 Mt/year for bioethanol and biodiesel production is envisioned to operate under lean manufacturing. For storage capacity planning, the existing oil terminals are planned to accommodate a storage utilization rate (SUR) of 23% and 28% per month, providing storage space up to 155,495 Mt for bioethanol and 197,771 Mt for biodiesel, respectively, annually. The strategic goal is establishing the optimal route and supply quantities for cost-effective biofuel distribution along the BSC.
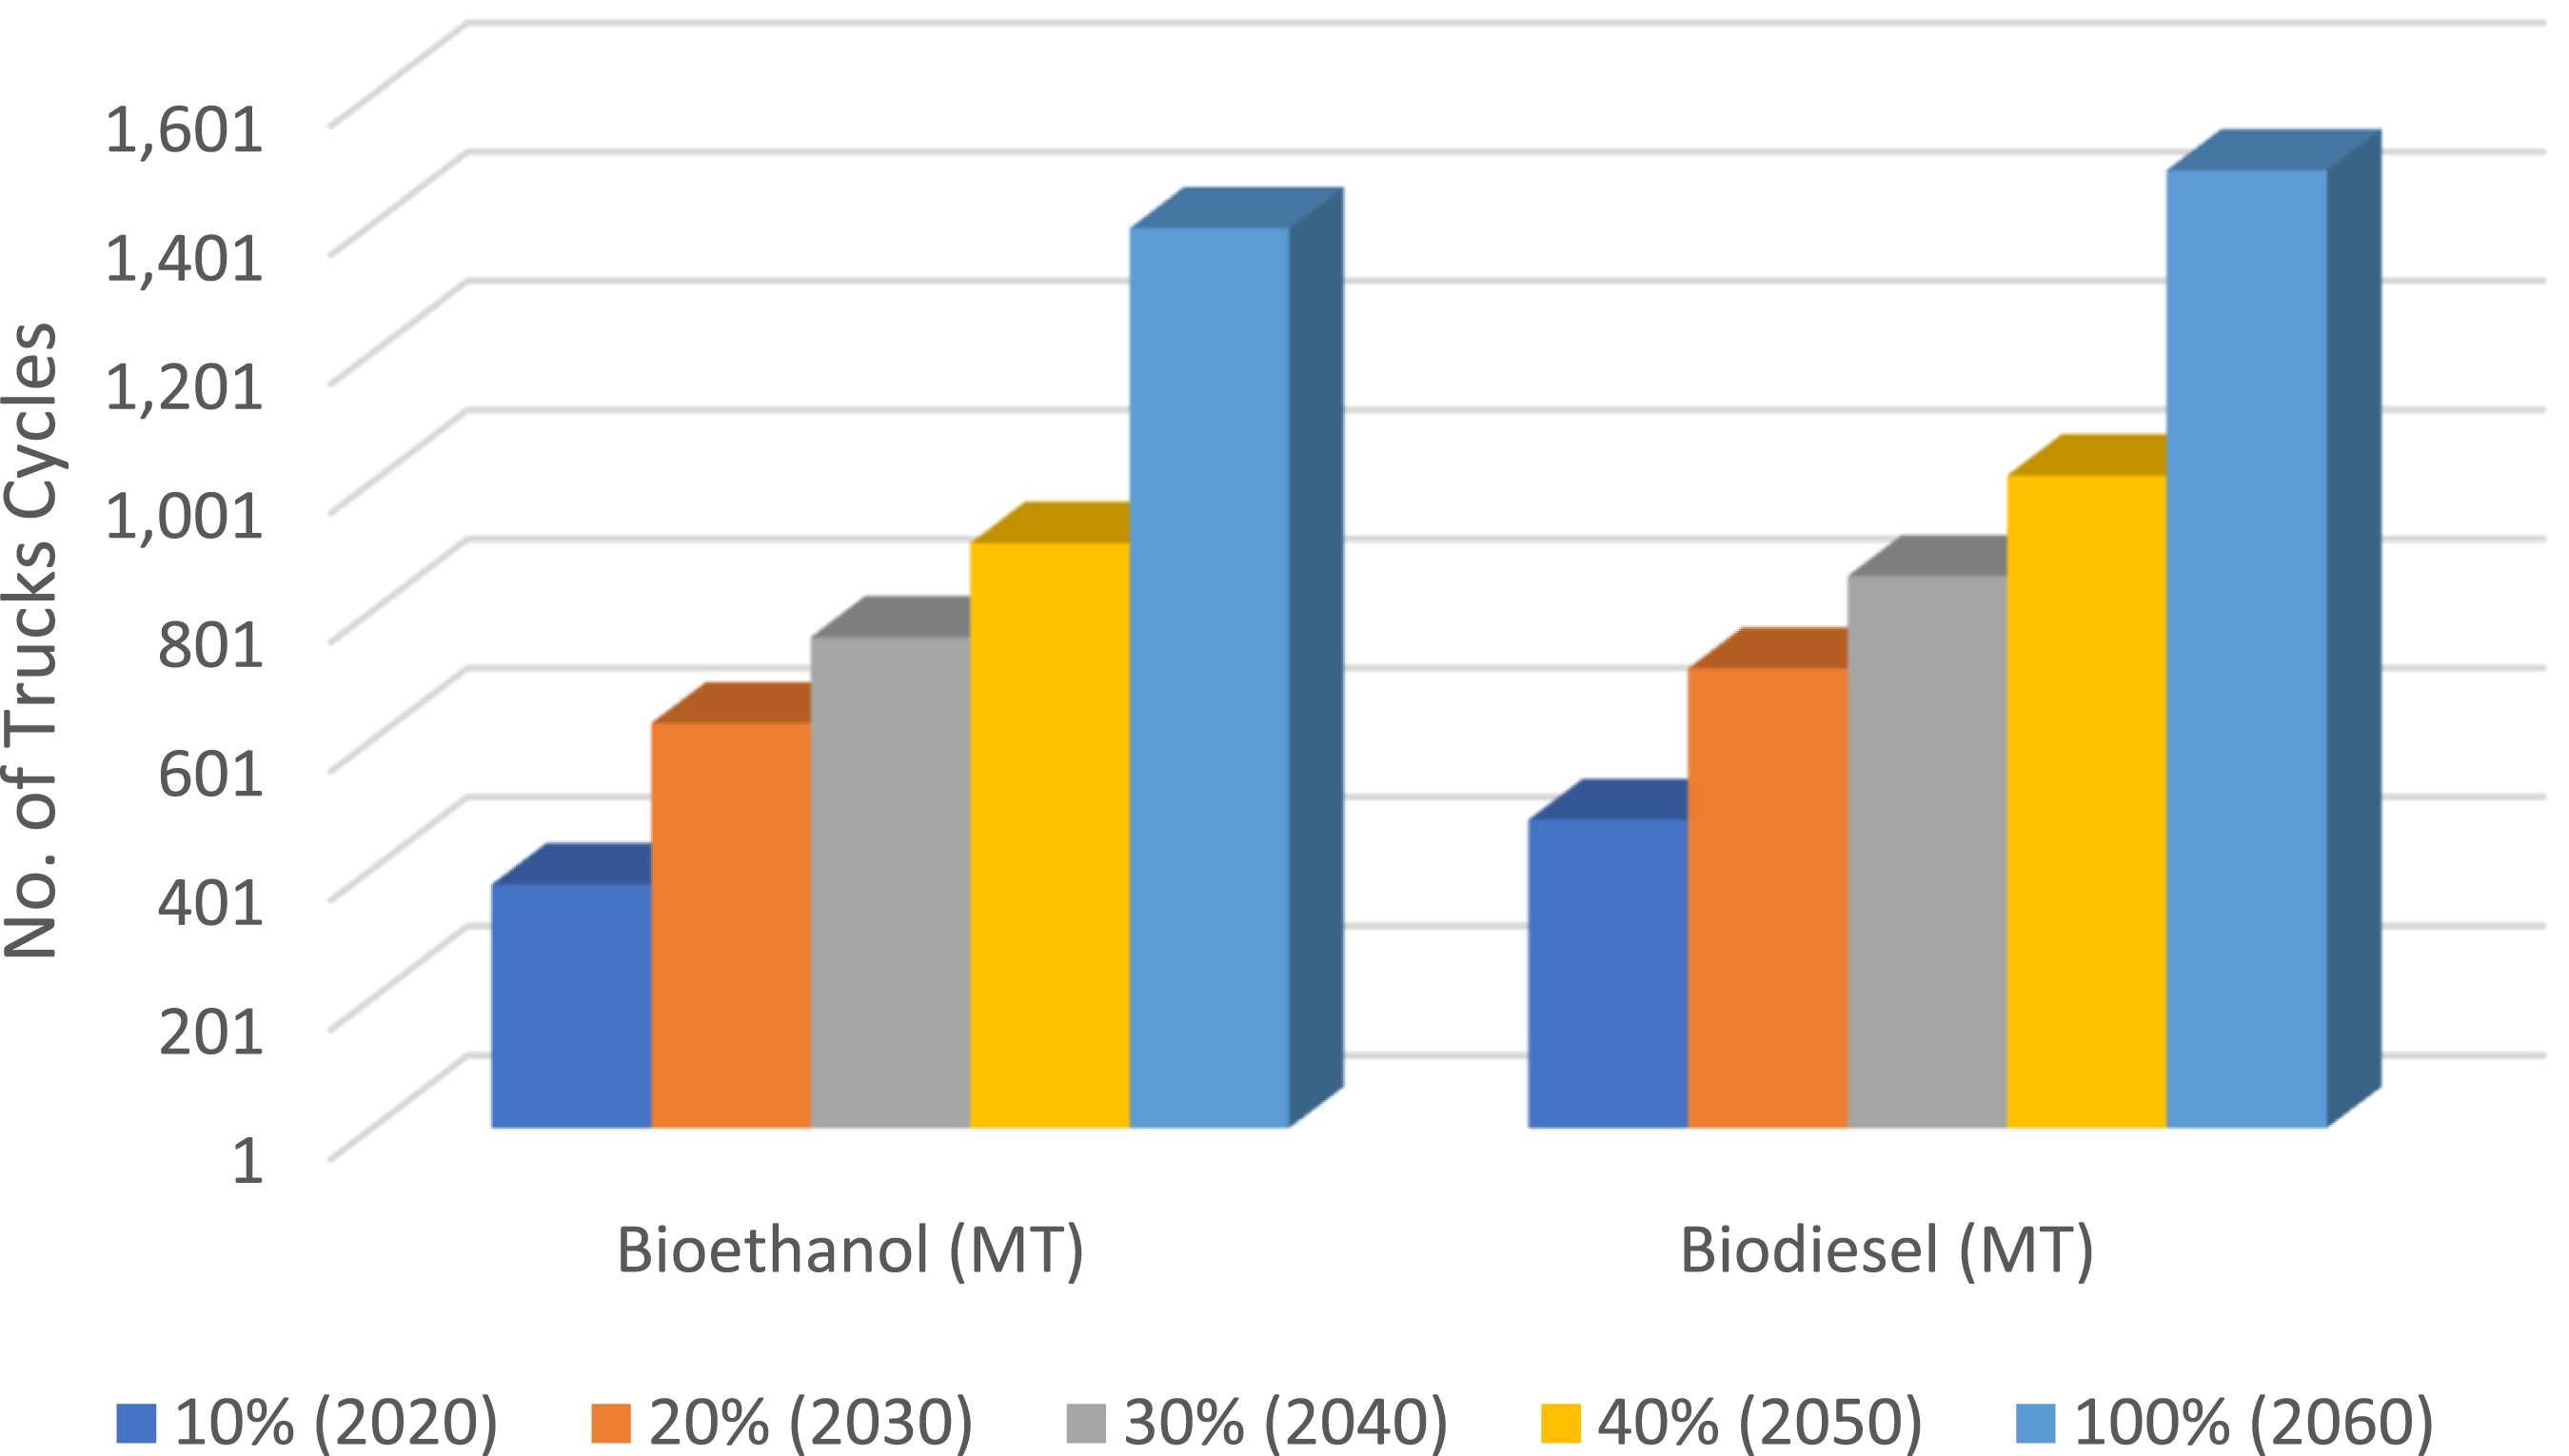
The optimal network diagram, which provides the routes for biofuel supply, given the distances between the nodes, is shown in Figure 4. Figures 5 and 6 specifies the flow quantity along the BSC given bioethanol and biodiesel respectively. The overall cost after optimization sums to Gh¢272 million (US$21.49 million) for bioethanol and Gh¢351 million (US$27.73 million) for biodiesel. The cost components comprising production, blending, storage and distribution costs are shown in Figure 7. Transportation costs presented the highest expenses, covering approximately 76% and 78% of the total costs for bioethanol and biodiesel distribution, respectively. The cost covered 378 and 478 truck fleet cycles for bioethanol and biodiesel yearly (see Figure 8). The exorbitant transportation costs are mainly due to shipping products over long distances beyond the threshold mark (300 Km). This emphasizes the need for modification in the supply chain by expanding oil terminals to demands with locations beyond this mark. Additionally, 23% and 21% of the total costs were directed toward producing bioethanol and biodiesel at the biorefinery. The cost for blending represented the lowest fraction, covering 0.04% of the total costs for both bioethanol and biodiesel. Finally, the storage cost covered a fraction of 1.25% and 1.37% for bioethanol and biodiesel, respectively. Figure 6 provides a detailed breakdown of the cost distribution structure of integrating biofuels into Ghana’s petroleum supply chain, highlighting transportation as the primary financial focus and investment area. Optimal transportation network diagram. Note: A. Koforidua: B. Tema: C. Spintex: D. Takoradi: E. Kumasi: F. Akosombo: G. Buipe: H. Bolga: I. Ashanti: J. Brong Ahafo: K. Central: L. Eastern: M. Greater Accra: N. Northern: O. Upper East: Q. Volta: P. Upper West: R. Western. Optimal transportation flow diagrams for biodiesel. Optimal transportation flow diagrams for bioethanol. Cost distribution structure for scenario 1. Number of cycles for truck fleet for scenarios 1–5.


Scenarios 2, 3, and 4
Scenarios 2, 3, and 4 are discussed in this section to present the comparative analysis, sensitivity assessment and general discussion of results where each scenario corresponds to 20% (E20, B20), 30% (E30, B30) and 40% (E40, B40) biofuel blend ratios respectively. These ranges, representing 10-years intervals and 10% blend ratio increasing rates, were estimated based on the Bioenergy Policy (BEP) prescribed range from 2020 to 2030, providing uniformity and standard for comparability, consistency and mapping trends. The criteria for the analyses revolve around setting predetermined and fixed boundaries for the decision variables (blend ratio) while examining the trends and variations in the production capacities, storage and cost structures. Increasing bend ratios directly affect production demand, necessitating modification across the supply chain, leading to increased operational and capital expenditure. All operational costs were observed to be sensitive to the blend ratio, as the number of trucks required per cycle increased significantly across all scenarios, contributing to higher transportation costs and vehicular emissions. Sensitivity analysis was explored to find potential economic and environmental efficiency trade-offs. As the blending ratio rises from scenario 2 to 4, ensuring a balance in costs and environmental sustainability becomes critical.
The operational costs analyzed in the study included transportation, production, blending and storage, which are sensitive to blending ratios. The cost of distribution was represented by the sum of the cost of transporting biofuels within the supply chain measured by the distance traveled from nodes, the unit cost of biofuels being transported and the quantity demand at the respective node. The overall distribution cost is impacted by the number of trucks per cycle for each scenario illustrated in Figure 8. The analysis across Scenarios 2, 3, and 4 provides essential insights into the distribution network analysis, revealing the cost structure as indicated in Figure 9. Transportation costs represented the main cost factor across all scenarios and biofuel types. At a 20% blend ratio representing scenario 2, transportation costs remain dominant as usual, while the number of trucks per cycle corresponds to 378 and 478 trucking cycles for bioethanol and biodiesel, respectively. The cost of production is the next substantial cost, followed by storage while blending remains the lowest cost. When transitioning to scenarios 3 and 4, the transportation cost continued to lead the costs; however, a sharp rise in the storage cost was recorded, particularly for biodiesel. The required trucking cycles increased to 21.26% and 19.16% for bioethanol, while the biodiesel percentage increased from 20.10% to 18.24%. While storage and blending costs accounted for smaller shares in all the scenarios, their rise remained steady. These trends give room for prediction and emphasize the significance of strategic investments in storage infrastructure to manage inventory effectively as demand increases. Again, although blending cost remained the least recorded cost in all the scenarios, investments in blending technologies become essential if their cost component is to be maintained for long-term cost savings. This analysis provides a solid foundation for stakeholders on informed decision-making, denotes areas of cost reduction, and aids in optimizing resource allocation in biofuel production. Costs for biofuel integration scenarios 2, 3 and 4.
Biofuel production demand was estimated based on the annual petroleum consumption data, considering the scenarios’ blending ratios for the respective years. The demand across the scenarios denotes a significant rise as blend ratios increase from scenario 2 to scenario 4, illustrated in Figure 10. The bioethanol demand for scenario 2 was estimated at 465,164 Mt, while biodiesel stood at 528,162 Mt, translating to a total of 993,326 Mt in 2030. A 67.04% increase in production is expected transitioning into scenario 3, representing a total of 1,659,306 Mt biofuel production requirement for 2040. The bioethanol and biodiesel production demand from this scenario was set to 780,991 Mt and 878,315 Mt, respectively. Finally, the production demand from scenario 3 to scenario 4 increased to 46.94%, representing 2,438,163 Mt biofuel production. For 2050, Ghana will be expected to produce 1,152,314 Mt bioethanol and 1,285,849 Mt biodiesel, given the 40% blend ratio envisioned. In all 3 scenarios, the demand showed high sensitivity to the respective biofuel integration level, requiring an urgent increase in investment in production capacity and infrastructure every decade. Providing the dynamic trend in biofuel production shown in both bioethanol and biodiesel provides policymakers with a plan to aid in forecasting to ensure that the biofuel supply chain remains sustainable and resilient. Biofuel production requirement for S2, S3 and S4.
The storage utilization rate (SUR) is another critical assessment area in the BSC. Analyzing the shift in production demand reflects an associated rise in biofuel storage capacity across scenarios 1, 2 and 3. A significant storage terminal hub for the Ghanaian biofuel industry is Tema, representing up to 87% SUR across the entire scenario, asserting its dominance in capacity for bioethanol and biodiesel, emphasizing its fundamental significance in the BSC. Takoradi and Kumasi also provided some appreciable storage capacities for bioethanol and biodiesel, while Spintex could provide a storage facility for only biodiesel. It represented up to less than 1% SUR of biofuel storage facilities across all scenarios. Scenario 3 saw a visible rise in storage capacities, particularly in Takoradi and Kumasi, which provides a strong expectation for the future. Similarly, for Scenario 4, Bolga witnessed a comprehensive capacity upgrade to accommodate increasing biofuel volumes. The SUR for the various oil terminal locations is shown in Figure 11, highlighting the impact of strategic storage allocation to support the evolving biofuel demand market to support supply chain resilience. Tema represented a beneficial storage hub. However, its centralized nature makes it a vulnerable hub to supply chain disruptions. Therefore, resources must be allocated to other storage hubs, ensuring operational efficiency and supply chain flexibility. Biofuel storage capacities across scenarios 1–4.
Scenarios 5 (E100, B100)
Scenario 5 aims at a total transition to biofuel from fossil fuels, aligning with the Ghana Energy Transition and Investment Plan’s net zero emissions (NZE) goal across all sectors by 2060. For this scenario, production levels for bioethanol and biodiesel were set to 3,103,220 Mt and 3,302,230 Mt, respectively, representing 567.5% and 524.5% increase in demand from 2020 to 2060. This heavy demand mandates investment in feedstock production to support the entire population. At the production level, a centralized biorefinery is maintained to leverage the benefit of economies of scale, leading to significant cost reductions per unit of biofuel produced compared to earlier estimates. Additionally, the cost of storage increases highly to accommodate this demand. However, the absence of fossil fuel in this scenario eliminates the blend cost, adding up to the cost savings of leveraging the existing petroleum supply chain. The transition to 100% biofuel supports the goal of NZE by eliminating GHG emissions associated with fossil fuel use when produced sustainably; however, considerable trade-off requires consideration. The transition from E10 to E100 saw a rapid hike with approximately 313.1% increase in the number of trucks needed per cycle, while the bioethanol transition (B10 to B100) saw a 210.8% increase (see Figure 8). This represents a higher transportation cost, leading to the rise of transportation-related emissions, including GHG, potentially offset some environmental benefits. Furthermore, the substantial rise in demand necessitates considerable alterations in the existing petroleum supply chain infrastructure, feedstock production enhancement, and logistics and infrastructure expansion to satisfy biofuel demand fully. The complete transition to biofuels (E100, B100) eliminated blend costs and boosted energy security. However, the trade-offs emphasize the need for optimization and strategic planning to ensure that the increased production, logistics and infrastructure costs do not compromise biofuel’s environmental and social benefits. This increased demand necessitates significant investments in infrastructure, adding up some capital expenditure and potentially affecting the economic viability. Additionally, the paradigmatic shift from fossil fuel to biofuels is expected to exert adequate pressure on feedstock production, which may lead to competition of land with food crops, which can affect food prices according to multilevel perspective (MLP). In this transition to biofuel economy (or green economy), though there is a general vision for the emergence of sustainable technologies, their actual occurrence must still face additional barriers, such as the absence of a well-defined technological trajectory, long development times, and crucially, uncertainty about market demand and social and environmental gains. 1
Access to reliable data plays a significant role in quantifying the impact of renewable energy (RE) on environmental, social and economic developments. The lack of inadequate data on biofuels makes it challenging to quantify the effect of biofuel implementation in most developing countries. Researchers are then compelled to use comparative analysis, estimation and interpolations to support policymakers and stakeholders in decision-making for implementing RE policies. 38 Romero et al. 38 developed a robust model supported by combined quantitative and subsector surveys to forecast the social impact of employment rate for the biofuel sectors, emphasizing the effects of employment rate on economic development within a developing country. They noted that, within the biofuel industry, bioethanol generates more jobs as compared to biodiesel, while economies of scale play a significant role in increasing the employment rate up to 378% provided the production capacities were increased up to 50%, translating into a total profit rise by US$ 421 million. The GHG emission savings mostly quantify the environmental impacts of biofuel use by comparing them to fossil fuels. 1 Their research provided an in-depth estimate of biofuel energetics and GHG emission saving comparative study. A key takeaway from the research indicates that bioethanol has a net GHG emission saving of up to 87%–96% with E100 compared to their counterpart gasoline, while bioethanol has also provided higher emission savings. At the same time, the economic impact of biofuel production can be estimated based on annual cost savings. NPA 10 provided the average free-on-board (FOB) price for refined fuel, mainly gasoline and diesel imports to Ghana, estimating US$ 824.06 and US$ 874.81 per metric ton (pMt) respectively.
Estimated biofuel cost savings.

Source. Author’s construct, (2024).
Conclusions, limitations and future research
The global energy future for developing countries is in doubt. Challenges, including energy security, climate change and air pollution issues, have continued to burden most sub-Saharan African countries’ economic development with severe health and environmental sustainability impacts. Yet many of these countries have abundant agricultural and waste extracts as feedstock for biofuel production. 7 Ghana addresses its energy challenges by promoting policies to diversify the energy mix, reduce reliance on imported petroleum, and promote its green economy (GE). Ghana aims at a 20% biofuel integration (E20, B20) by 2030 and gradually transition, targeting a net zero CO2 emission by 2060 by eliminating fossil fuels from the transport sector.12,14 Literature has offered viable insights into Ghana’s biofuel landscape, including feasibility studies on feedstock and land availability, policy and regulatory requirements, and potential challenges.3,25 However, there was a noticeable gap in addressing the specific challenges of integrating biofuels into the existing petroleum supply chain as an approach to the sustainable transition to biofuels. It became evident that the absence of a robust biomass-to-biofuel supply chain (BSC) infrastructure is the primary challenge, and strategic planning coupled with mathematical optimizations are essential to provide stakeholders and policymakers with the right analytical tools in setting up the needed infrastructure to support the biofuel transition goals. This research modeled biofuel integration into Ghana’s petroleum supply chain for sustainable cost-energy transition using mixed integer linear programming (MILP), considering the unique infrastructural, economic, and logistical challenges. The study modeled and simulated scenarios to depict the BEP and the GET&IP policies. The simulation results indicate that high biofuel production is mandatory to meet the increasing blend ratios, necessitating optimization to balance biofuel production with food security. Furthermore, increased biofuel demands require high capital expenditures for facility expansion and upgrades to ensure operational efficiency and supply chain resilience. Transportation costs were identified to be sensitive to blend ratios. Therefore, strategic planning, including reallocating storage facilities to meet the evolving biofuel market, is essential to minimize transportation costs. These findings can thrive in an environment of constant research and strategic planning and can be evaluated and assess by using industrial performance measurement and management systems. 39
Despite the significance of this study in providing a pragmatic guide to promote sustainable bioenergy transition in developing country cases, the tailored scope introduces some limitations which can inform further research direction. Delimitations include the absence of upstream biomass-to-biofuel supply chain (BSC) optimization, operational level planning, and multiple objective optimizations. The analysis may be improved by inculcating multi-step modeling to capture temporal variability and improve the robustness of the results. Future studies can focus on incorporating uncertainty, life cycle assessments, and price fluctuations into this fixed and deterministic model.
Footnotes
Acknowledgement
We wish to acknowledge Scientific African for their decisive feedback which shaped the manuscript.
Ethical statement
Author contributions
Akyene Tetteh aided with the methodology validation (analysis and interpretation of data), reviewed, and edited the manuscript. Gideon Fraser performed the original drafting, formal analysis and data curation, justified the methodology and edited the manuscript.
Funding
The authors received no financial support for the research, authorship, and/or publication of this article.
Declaration of conflicting interests
The authors declared no potential conflicts of interest with respect to the research, authorship, and/or publication of this article.