
Abstract
The objective of this study is to address existing study gaps by defining what materials are demand-driven material requirements planning (DDMRP) suitable and building a tool that helps to identify such materials. The research problems are approached with three different questions about suitability, features of the identification tool, and financial impact. The research methodology consists of a mixed method case study approach, where semi-structured interviews were conducted with supply chain professionals from the case company, and quantitative data related to the case company’s operations was analyzed. The data consisted of the relevant data of over 10,000 purchased materials. The findings of this study suggest that there are no certain characteristics that materials suitable for DDMRP have, but the potential must be defined individually in the case of every purchased material. The tool initially developed in this study helps to identify materials that meet the requirement of providing potential positive financial impact if brought into DDMRP scope by analyzing historical demand data, lead times, and inventory carrying costs.
Keywords
Introduction
In today’s fast-paced business environment, effective material planning is crucial for companies with manufacturing activities to improve their operations, or even remain competitive. Demand-driven MRP (DDMRP) is an approach to material planning that emphasizes responsiveness to customer demand, allegedly resulting in the improvement of material flow. The structure of the theoretical framework is formed on the themes of DDMRP, suitability identification tools, and profitability.
Study background and research gaps
Effective planning of operations and materials is crucial for companies to remain competitive in today’s fast-paced business environment. Material requirements planning (MRP) is a widely used planning and control system for managing production and inventory (Butturi et al., 2021), 1 which involves forecasting demand (Lee & Adam, 1986), 2 planning production (Thevevin et al., 2020), 3 and managing inventory levels (Thürer et al., 2022). 4 However, despite its popularity, traditional MRP systems have limitations. The limitations can be demeaning for profitability in the business environment of today’s world, which has been depicted as volatile, uncertain, complex, and ambiguous (VUCA-world). To address the shortcomings of conventional MRP, professionals and academic literature have invented many new approaches to material planning across decades.5–8 One of them, demand driven MRP (DDMRP), is a relatively new approach that aims to improve material planning by emphasizing responsiveness to customer demand and reducing the risk of overstocking or stockouts. 6 The core intention of the planning method is to “position, protect and pull” (Ptak & Smith, 2019), 9 which has been identified as a crucial element in different segments of business.
Even while MRP is a useful tool for managing inventories and production, any negative effects on operations must be minimized by being aware of the risks and vulnerabilities it may present. 9 To put it in a broader perspective, Li and Disney (2017) 10 claim that using MRP as a planning tool causes supply chain anxiety, which in turn causes inventories and decreased productivity as well as operational confusion. The increasing inaccuracy of material and information as one move towards the ends of supply chains exacerbates the anxiety. The bullwhip effect, which leads to unfeasibly changing production and procurement plans, capacity loss, and rising inventories, is what is known as the previously mentioned inaccuracy. 10 To put it plainly, the unpredictability increases the requirement for active operative purchasing and purchase order rescheduling, which may not be long-term viable. It has been suggested that the bullwhip effect increases and transfers unpredictability across the supply chain.1,51
Many hybrids push-pull systems have been developed over the years because MRP, along with other more sophisticated material planning techniques, such as MRP II, Lean, Theory of Constraints, etc., have limitations and room for improvement. 7 Conversely, it has been suggested that combining push and pull systems is challenging since it may result in conflicts. 11 This study focuses to identifying materials from all purchased goods that are now active in the case production facility (CPF), which might be useful if incorporated in the DDMRP scope. The emphasis is on the replenishing parts because the primary goal of this study is to define the range of materials that should be purchased using a demand-driven planning method. Additionally, the research findings regarding each material’s suitability should only be used as a guide for decision-making; in actual situations, their suitability may vary.
Study aims and research questions
The aim of this research is to determine which proportion of purchased materials could be beneficial to purchase with planning done in a demand-driven way in a complex manufacturing environment, and what the financial impact of implementing DDMRP would be. This research study presents an extensive overview of the topic DDMRP applicable to operative purchasing. It outlines the larger context of the research and provides readers with both orientation and a solid basis. The significance of the research area is established, and the study gaps in the current understanding on DDMRP are emphasized to underscore the necessity for more investigation.
Moreover, this study provides insights for supply chain professionals on how to identify materials suitable for DDMRP and contribute to the field of supply chain management by providing a practical tool for a case company to implement DDMRP and improve their material requirements planning. Consequently, the research problem is the lack of knowledge about what purchased materials could be procured with the DDMRP method. As mentioned, the research problem consists of the lack of knowledge on general characteristics of materials suitable for DDMRP and a lack of tools available to help companies identify such materials. Nevertheless, the financial impact of DDMRP as a planning method must not be neglected. Based on such study aims, this study identifies three research questions (RQs), which are stated as follows:
What conditions must be met for a purchased item to be purchased with the DDMRP method?
What features should a tool designed to identify DDMRP-suitable materials include?
What are the consequences of deploying the DDMRP method with respect to a financial perspective?
Research questions 1 and 2 are exploratory by nature, and RQ3 can be defined as an explanatory question. The research questions are addressed in a separate way in this study. The first research question is addressed to find the appropriate breakdown of the purchased materials from the point of view of DDMRP-suitability with the help of DDMRP buffer levels and protected inventories. The second research question, on the other hand, is centered around the identification of features that are required from an identification tool that aids in dividing stock keeping units (SKUs) of the case production facility (CPF) into DDMRP-suitable and unsuitable items. Thus, the second question is subject to contributing to the development of the objective of developing the tool to identify DDMRP-suitable materials. The third research question is addressed by calculating an estimate of the possible monetary effects of implementing DDMRP on a larger scale in the use of the CPF.
The structure of the study is as follows: Section 2 briefly describes the studied case company while Section 3 provides a literature review of existing literature on the topics of conventional MRP, DDMRP, the general characteristics of materials suitable for this approach, and tools for identifying DDMRP-suitable materials. Section 4 describes the research methodology, including the research design, sampling and data collection, data analysis, and quality of the research. Section 5 presents the case study results, including the identification of characteristics of materials for DDMRP, the development of the tool for identifying such materials, and the financial impacts of different implementation scenarios. Finally, Section 6 provides a summary of the study, its contributions, practical implications, and recommendations for future research.
Description of the case company
This research is conducted in cooperation with a case company that has piloted a procurement system that implements DDMRP as the planning methodology. The case company is a multinational company with production activity in an important business sector. 12 This study concentrates on the portion of the case company’s operations that are conducted in one of its production facilities in Finland. Furthermore, the scope of this study is the case company’s operative purchasing department, the objective of which is to ensure with the help of logistics, that all material needed by production is available at the needed time and in the needed quantity. As a part of continuous improvement in the case company, development of material planning has led to initiating the project of developing some practices, including procurement. Some changes have originated from the volatility and uncertainty of the business sector, and major amendments in the production facilities and information systems utilized. According to the case company, the uncertainty has led to increasing excess inventory levels in some portions of the purchased material portfolio, and to material shortages in other sectors.
While the piloting of the DDMRP method has provided the case company with some results, there is a gap in knowledge about what the restrictive characteristics of purchased materials are that would exclude them from the DDMRP scope.5,12,13 Furthermore, the financial impact of implementing DDMRP is unknown. Consequently, if the case company had all the needed information about the implementation of DDMRP, the presumed benefits of DDMRP could be exploited in a way that the whole process of procurement would face improvements. While there have been some promising results from the implementation of DDMRP in the industrial sector, it might be that not all materials are suitable for DDMRP.14–16 Consequently, companies need to identify the materials that can be purchased using DDMRP as a planning method. The case company desires to identify what scope of purchased materials could be reasonable to include in the procurement system dictated by the demand-driven planning method. The topic areas are reviewed from the perspective of the operative purchasing department located in the case company.
Literature review
The intention of materials requirements planning is to determine the needs of materials beforehand based on the overall demands of a production facility. 12 Addressing the need for a way to determine the requirement schedule ahead of time has generated a demand for a planning tool. MRP was first conceived in the late 1950s and was widely introduced in 1975 when it transformed material planning (Miclo et al., 2019)7–9 and the overall manufacturing world profoundly.17,
MRP is often integrated into an enterprise resource planning (ERP) 18 system when it comes to the practical world (Butturi et al., 2021; Thevenin et al., 2020),1,19 because of the numerous limitations of a plain MRP system. 7
MRP as a planning method has been referred to as one of the industry’s most extensively utilized systems for production control and planning by e.g., Butturi et al. (2021) 1 and Ptak and Smith (2019). 9 This might be due to simple mathematics in the core of the model, as well as easy integration. MRP uses simple mathematical formulas in the calculation of purchase requisitions based on the bills-of-materials (BOM). 19 The date on which the purchase requisition is released is equal to the date of demand minus the effective lead time (LT). 20 The demand for a specific day is calculated in MRP from the requirements of components that are on a higher level of the BOM. 21 Because the levels of the BOM are interlinked, the MRP material requirements are referred to as dependent.
DDMRP and its implementation in supply chain management
DDMRP is a relatively new method, introduced by Ptak and Smith (2009) 9 in the third edition of the book Orlicky’s Material Requirements Planning (2011) that has been proposed as a hybrid push-pull solution (Butturi et al., 2021) 1 to overcome MRP nervousness and uncertainties caused by the bullwhip effect. DDMRP has been argued to solve the problems caused by volatile markets, fluctuating demand, and the great variety of products.9,14,22,23 At the core of DDMRP is the intent to control material flow effectively (Ptak and Smith, 2019), 9 and the main difference from MRP is the focus of DDMRP toward the pull method, which shifts the control on qualified demand signals.24,28,29 According to Miclo et al. (2019), 7 basic MRP logic forms the foundation of DDMRP, which has been built with the intention of combining the best practices from former planning models. While DDMRP has been widely studied in the field of SCM, the lack of generalizable literature related to the implementation of the system in a real-world context is clear, apart from studies conducted by e.g., Kortabarria et al. (2018), 25 and Ihme and Stratton (2015). 26 This deficiency 27 has been also acknowledged by Orue et al. (2020), 6 and by Azzamouri et al. (2021). 14 The scarcity of concrete DDMRP applications reported in academic literature limits the validation of its implementation and integration strategies.1,31 This paucity underscores the need for more empirical studies to confirm the purported benefits of DDMRP and furnish concrete guidelines for its implementation and integration. Furthermore, no established calculation method or tool using historical data has been developed thus far (Duhem et al. 2023), 30 indicating a significant gap in DDMRP methodology that needs addressing to facilitate more widespread and effective implementation.
Supply chain management and methodical operations inside an organization are prerequisites for creating a long-lasting competitive advantage over rival businesses.32,52 Nevertheless, achieving this objective has grown more challenging in the current economic climate since conventional planning and control techniques were not made to handle such challenges, which has led to the supply chain’s extreme complexity. 46 In response to such circumstances, planners are moving away from the conventional push-based, deterministic MRP methodology and towards the more methodical pull-based demand-driven material requirement planning (DDMRP) approach, which is unmatched in its ability to maintain flow stability in the manufacturing process and operates in a more complex and unstable business environment.46,47 The primary goal of DDMRP’s establishment is to keep the flow of work properly while keeping an eye on inventory levels and related expenses. 32 The practitioners’ inability to execute the concept correctly and attain the intended outcome is a result of their inadequate comprehension of the DDMRP approach.47,48
Identified research gaps
A conspicuous gap in current research revolves around the absence of tools to adeptly identify materials that would be beneficial to be replenished using the DDMRP model. However, it is worth noting that certain tools pertaining to the parametrization of DDMRP have been created.2,21,35 This suggests a relatively more well-addressed dimension of the model’s implementation. Consequently, while there remains a pronounced need for comprehensive tools in one area, the presence of tools in another facet signifies a step towards a more holistic understanding and application of the DDMRP framework.32–34
Identified research gaps through the survey of existing literature.

Research methodology
Research design
The empirical methodology of this study was carried out using a single-case study and a mixed method, which created the research strategy. According to Chumney (2015),
43
mixed methods as a research methodology is defined using both qualitative and quantitative methods in the research process. The use of this methodology was justified by the nature of the study’s research questions as presented in Figure 1. From Figure 1, it is seen that the research question 1 can be specified to be exploratory by nature, and the research method chosen to address the question was picked to be mixed method, which is incorporated with semi-structured interviews and quantitative data analysis. Methodological design of the research based on the research questions.
Likewise, RQ2 is exploratory by nature, proposing the use of qualitative methods. The objective of building a tool to identify the DDMRP-suitable materials dictates the direction of the methodology to be qualitative since an in-depth review of the subjective need for the features of the tool was seen as beneficial. RQ3 is yet again explanatory by nature, which led to conducting the research with mainly quantitative research methods.
According to Chumney (2015) 43 and Mitchell (2018), 44 the research method of a study is usually determined more by the nature of individual research questions, and the expected outcomes. Additionally, the choice of research methods is case-sensitive and thus requires analysis of the nature of the research questions. As for the RQ2, the objective of finding needed features for the tool requested by the case company shifted the methodology toward the usage of qualitative methods, since the needed features were somewhat subjective opinions, rather than numerical facts that could have been extracted from quantitative data. Alternatively, research questions 1 and 3 intended to find out specific characteristics of materials and financial effects, which both relied on numerical data. For the RQ1 however, the case-specific attributes for suitable materials were mapped out with aid of qualitative methods, shifting the methodology toward mixed methods.
Data collection and sampling
Required master data attributes that were used in the calculations.

To address RQ2, qualitative data was collected with semi-structured interviews. The interviews were conducted with respondents from the purchasing department of the CPF. The invitation was sent to a portion of the members of the purchasing department all of which had some prior knowledge about DDMRP. Following the sampling, an individual timeslot of about 15 min was booked with each respondent. The interviews were conducted in a hybrid form, using both live interviews and remote video calls using Microsoft Teams as software. The interviews were conducted fully in Finnish to ensure perfect understanding since all respondents had Finnish as their native language. All interviews were recorded.
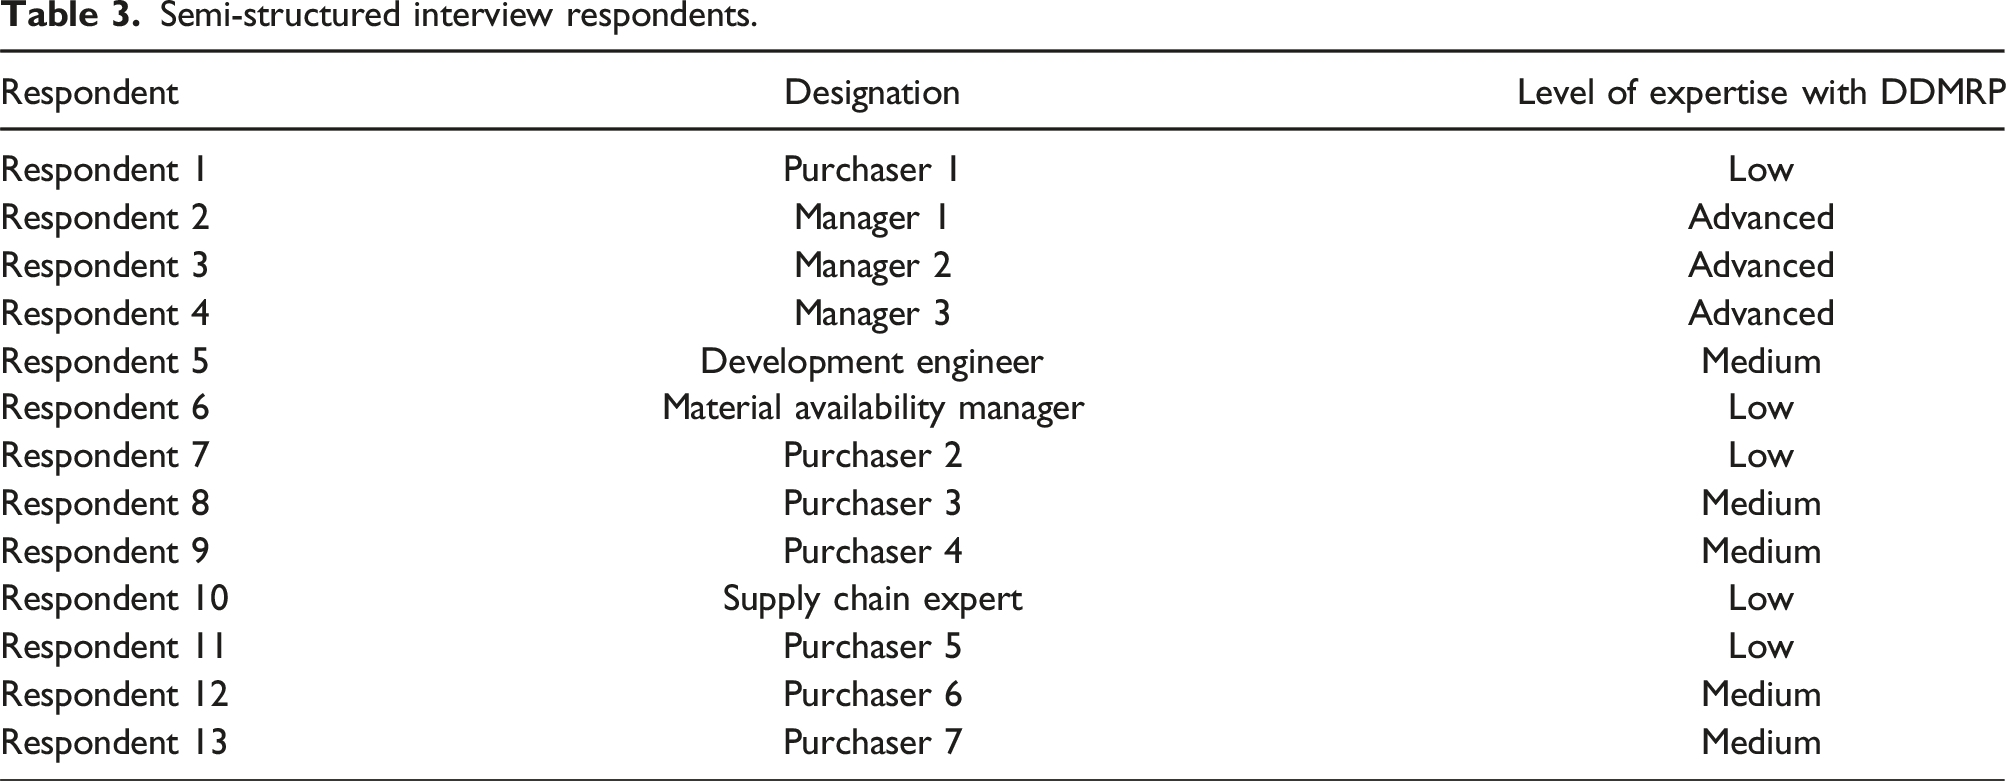
Semi-structured interview respondents.
Semi-structured interview questions.

When collecting data with interviews, research ethics must be considered. While the interview questions were not sensitive by nature, the anonymity of the respondents was crucial regardless. To address the ethical point of view, a consent of recording was gotten from each respondent before starting the recording. Also, the recordings were not stored longer than is needed for the research process, and the storing was done properly. RQ3 is also explanatory by nature, and a quantitative method was required to form a tangible answer. The sampling for resolving the problem imposed by RQ3 was the same as the outcome of RQ1. This was done since the sampling was already efficiently done by identifying PIs that were performing inventorially better when the planning was done with the DDMRP method. Consequently, the data collected was the same sample of PIs that are the outcome of RQ1.
Data analysis
Excel calculations.

Recommended LTF ranges. 9

Variability factor ranges. 9

Lead time factors (LTFs) are considered as the factors that can impact over lead time including shortage of raw materials, transportation problems, labor shortages, natural calamities, and human mistakes. LTF is calculated by combining the number of days required to obtain supplies, produce things, and deliver completed goods. While variability factors (VFs) are the factors that quantify the degree to which data points deviate from both the average and from one another. If used to gauge the fluctuation between investment refunds, it is a helpful metric in financial services.
When deciding on what ranges the lead time (LT) and variability categories determined in Table 5 should be divided, the LTs of the purchased parts are divided into the three categories by multiplying ADU with decoupled lead time (DLT). The distribution is further explained in Table 6, where long LT is formed over parts that have 20%–40% of ADU × DLT, medium LT with 41%–60% of ADU × DLT, and short LT with 61%–100% of ADU × DLT. These calculations to distribute the parts and form the LTF (see Table 6) are recommended by Ptak and Smith (2019). 9
To address the variability factor (VF) that divides variability into categories (see Table 7), some other factors must be examined. According to Ptak and Smith (2019), 9 the variability of supply must be calculated based on sourcing, variance of delivery dates from actual dates of delivery, and possible disruptions. The calculation of variability can be expressed mathematically with standard deviation for each material. The distribution of the VF and recommended segments can be referred to in Table 7. High variability is 61%–100% of the safety base, medium variability is 41%–60% of the safety base, and low variability is 0%–40% of the safety base.
Both LTF and VF can have a value that is between 0 and 1. For the LTF, the smaller the value, the bigger the safety. Alternatively, the higher the value of VF, the higher the variability. All the buffers and zone levels can be calculated with the factors visible in Table 7. From the factors visible in Table 7, at least when considering the situation of the CPF, the least change in the values is with LTs, LTFs, and MOQs. Consequently, the variables behind the dynamism of the safety stock are ADU and VF. This is another part of the DDMRP environment which is affected by the level of material flow.
The cost effects addressed mainly the savings of inventory value. The analysis of the financial effects on the inventory values was done by inserting two additional rows to the calculations implied in Table 5, target inventory value, average inventory value during study period from 1.1.2023 to 30.6.2023, and savings. Inventory values were calculated by multiplying the inventory quantities previously calculated by the unit price of each SKU. Consequently, the savings were calculated by extracting the on-hand target quantity from the average stock value in the study period.
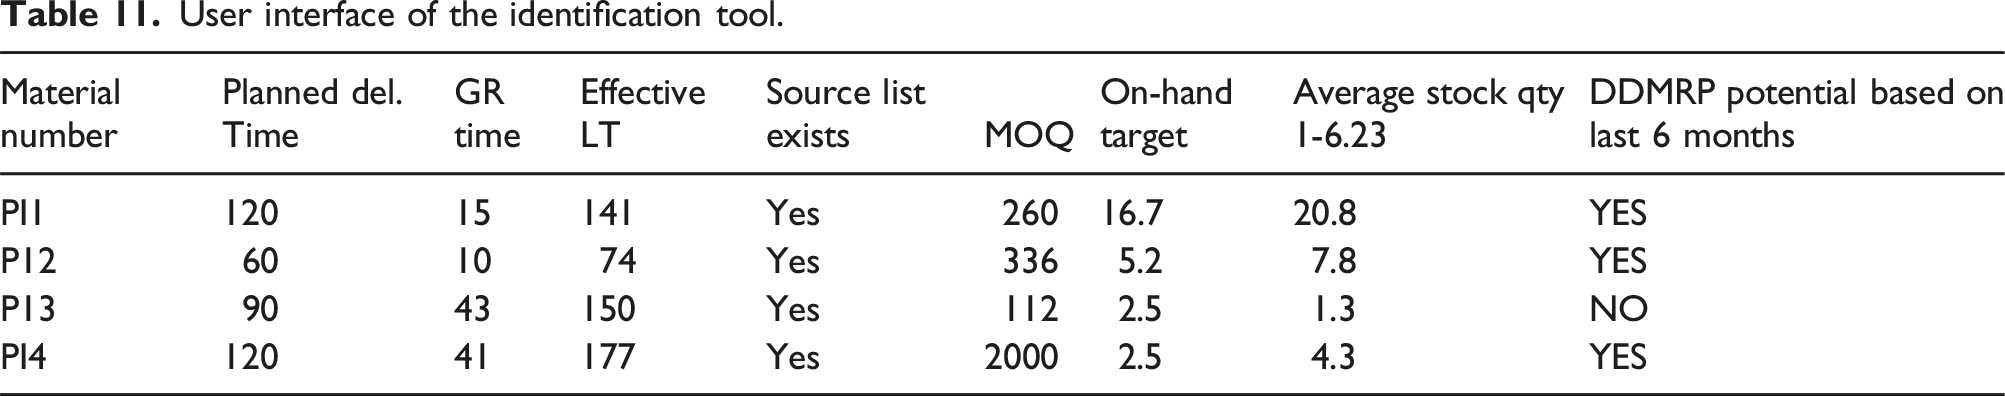
Figure 6 displays the basic data model that is used to do the necessary calculations behind to measure the user interface of the identification tool. The basic logic is based on the master data of a purchased item that the tool fetches from the case company’s ERP system. The algorithm then provides an answer on whether the materials master data implies potential benefits from demand-driven planning or not. The data model presented in Figure 6 can be used as the base of the study report. In Figure 6, the general logic and the relations of the data are described. Also, a sum icon can be found before every aspect that is calculated. Furthermore, all attributes that can be excluded from the visible table are placed between parentheses.
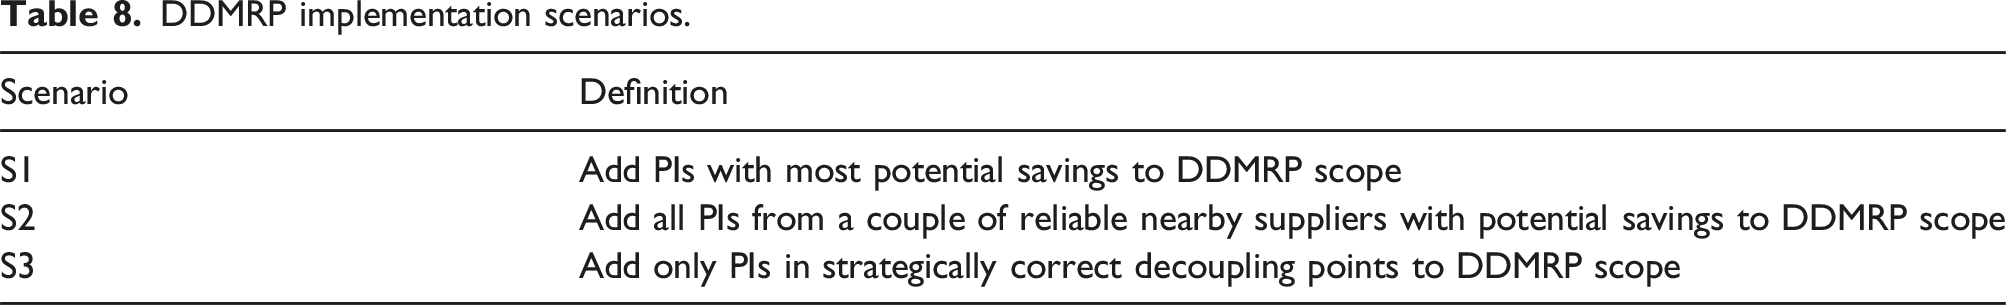
DDMRP implementation scenarios.
Buffer level calculations and dynamic adjustments
Buffers in DDMRP are certain points inside the overall flow of material in the supply chain that absorb variability in the form of a “dynamic safety stock”, that can be easily distinguished from a conventional safety stock, as it protects and promotes flow better (Ptak & Smith, 2019). According to Ptak and Smith (2019), buffer profiles are sets of parameters that can determine the behavioral characteristics of a buffer. In addition, at the top of each buffer zone is a certain level that is referred to as the top of green (TOG), the top of yellow (TOY), and the top of red (TOR). The top levels of each buffer are subject to required actions that are taken to ensure that the inventory level stays in the optimal range.
Buffer equations. 24

Data validity and reliability
Ensuring the correctness and credibility of the developed questionnaire is contingent upon the validity and reliability of a research technique. Appropriate sampling and the use of current data ensure these two aspects. Because this study uses a variety of approaches, its methodological validity and reliability also depend on those approaches. The validity of the interview questionnaire is not evaluated in the same way as the validity of statistical analysis. In this context, validity is evaluated first from the perspective of all research approaches, and reliability is then investigated in a similar manner. Although validity is an issue of quality in research, research ethics also make validity a priority.
The validity and reliability of both the qualitative and quantitative aspects of the study must be considered when conducting mixed methods research. The validity and reliability of the quantitative data as well as the credibility, transferability, dependability, and confirmability of the qualitative data must be guaranteed. Since the research’s data came straight from the case company’s systems, it can be assumed to be reliable. It is important to remember that there is a chance—albeit a small one in each instance—that the relevant data obtained from the case company’s systems was flawed in some way.
To sum up, the correctness and credibility of the study findings are contingent upon the validity and reliability of the research technique. These elements were guaranteed using current data, adequate sampling, which is covered in this questionnaire development process and meticulous design and implementation of the research techniques. The research study yields valid and reliable research findings that add to the body of knowledge in the field of inventory management by guaranteeing the validity and reliability of the research technique.
Study results
Materials suitable for demand-driven MRP
Introduction to RQ1 findings
The first objective of this study was to address the question of what purchased materials could be beneficially purchased by incorporating the DDMRP methodology. The benefit is referred to in this text as “DDMRP-suitability”, and materials of which inventory levels would decrease if planned with DDMRP as “DDMRP-suitable”. The identification of DDMRP-suitable materials, which are considered as the materials that meet the requirement of providing potential positive financial impact if brought into DDMRP scope by analyzing historical demand data, lead times, and inventory carrying costs was made with the help of quantitative data, observations, and a calculation sheet. Identification of these materials provides insights for supply chain professionals on how to identify materials that could have a positive effect from demand-driven planning. All purchased materials of the CPF were analyzed with the help of the calculation sheet that used basic DDMRP equations to evaluate if a purchased material would be beneficial to be purchased with the DDMRP method. Altogether, the data was collected from the case company’s ERP, after which it was analyzed to find characteristics for materials that would not have been potential for consideration of replenishing with DDMRP. To answer RQ1, the data collected from the CPF’s ERP system was analyzed. The data was analyzed by simulating the buffer levels and average inventory levels all CPF materials would have had at a specific point. The buffer levels were simulated as if they would have been on July 1st, 2023, with an average daily usage (ADU) calculated by data from the preceding 6 months. The DDMRP suitability of all purchased materials were assessed by determining conditions under which materials would outperform conventional MRP average inventories. During the assessment process of the purchased materials both minimum and maximum inventory levels were considered as well as the condition of stock-out condition too. The findings included that about 57 % of the sample materials could have been beneficial to be purchased with DDMRP in the review period. Figure 2 shows the distribution between materials with DDMRP potential and materials with no DDMRP potential. The potential materials are marked with the color black and account for 57.1% of all the sample materials, which was a total of 4001 SKUs. Rest of the materials, a total of 3008 SKUs (42.9%) were outlined as not potential. DDMRP potentiality of the sample materials.
List of conditions identified
After the values were calculated, the materials that were beneficial to be purchased with the DDMRP method were identified by assessing the ones with lower expected inventory than the actual average inventory from the first half of 2023. This observation led to the fact that there are no categorical groups that can be excluded from the DDMRP scope, but that the individual attributes of each material determine the suitability. If only the mass was analyzed the result that can be drawn is that as ADU increases, so does the potential savings, which are calculated using the equations presented in Table 5. This conclusion can be drawn from Figure 3, which shows a trendline that suggests just that when the sample materials are analyzed on a large scale. ADU related to percentual savings.
However, this finding cannot be generalized because of another discovery. For example, PI1 (see Figure 4) could only be beneficial to be purchased with DDMRP if the ADU was below 0.037. However, when it is above that level, there are no savings, but the increasing buffer levels make the stock value higher than when purchased with conventional MRP. This is due to the long LT of the example material, which increases the buffer when ADU increases. Percentual savings dependence on ADU of an example SKU.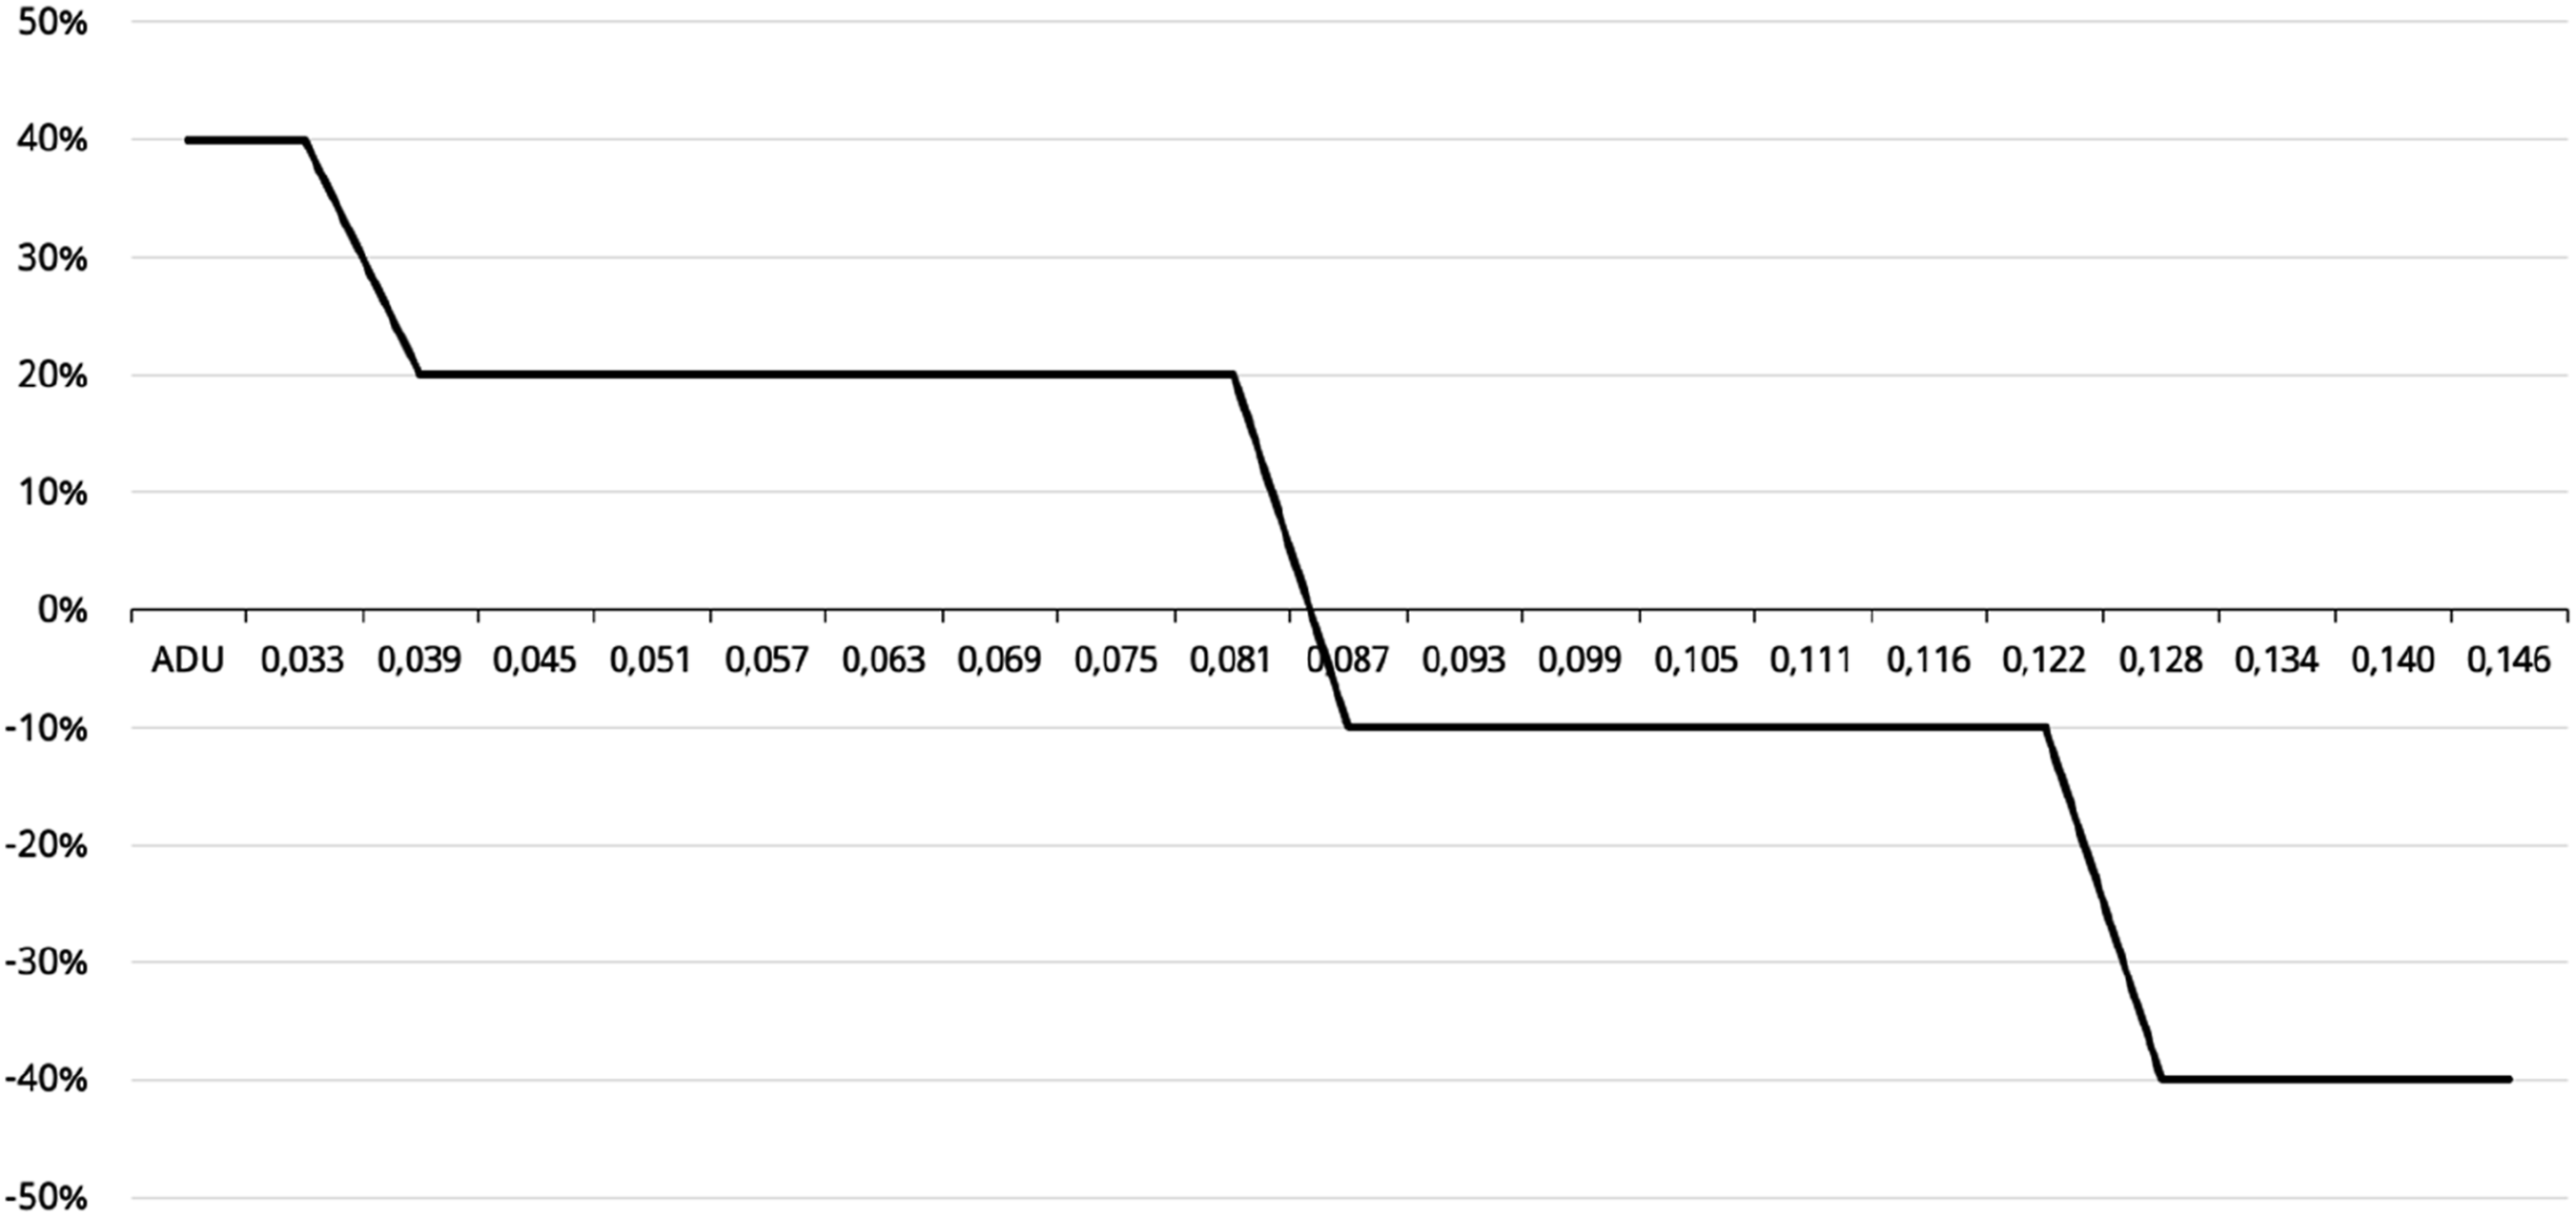
The savings act as implied in Figure 4 due to the equations presented in Table 5 are used in demand-driven planning to determine the buffer levels. To simplify, the math behind the analysis comes down to limited attributes that make up the buffers in DDMRP. These are mainly DLT, ADU, Lead time factor (LTF), and Variability factor (VF). Furthermore, the assessment of whether the expected average inventory is below the actual measured average is based on the buffer zone calculations. One result that arose from the quantitative data was the distribution of percentual savings on materials with different lead times. For example, the data suggests that items with short lead times have slightly less potential to be included in the DDMRP scope than materials with long lead times.
Figure 5 shows that with most LT segments, that are divided into 20-day ranges, the suitability is between around 70 and 90% of the materials. The remaining amount is either not suitable or the suitability is not able to be calculated. In addition, it was found that in the two LT segments that are under 40 days, the bigger portion of materials (over 50 %) would not have provided any savings to the average inventory value in the review period. Moreover, it must not be forgotten that although some of the materials are not declared as “DDMRP-suitable” in this study, there are no disincentives that would make the materials strictly unsuitable. The materials just would not have provided potential savings with demand-driven planning during the review period. Distribution of DDMRP-suitability on LT ranges.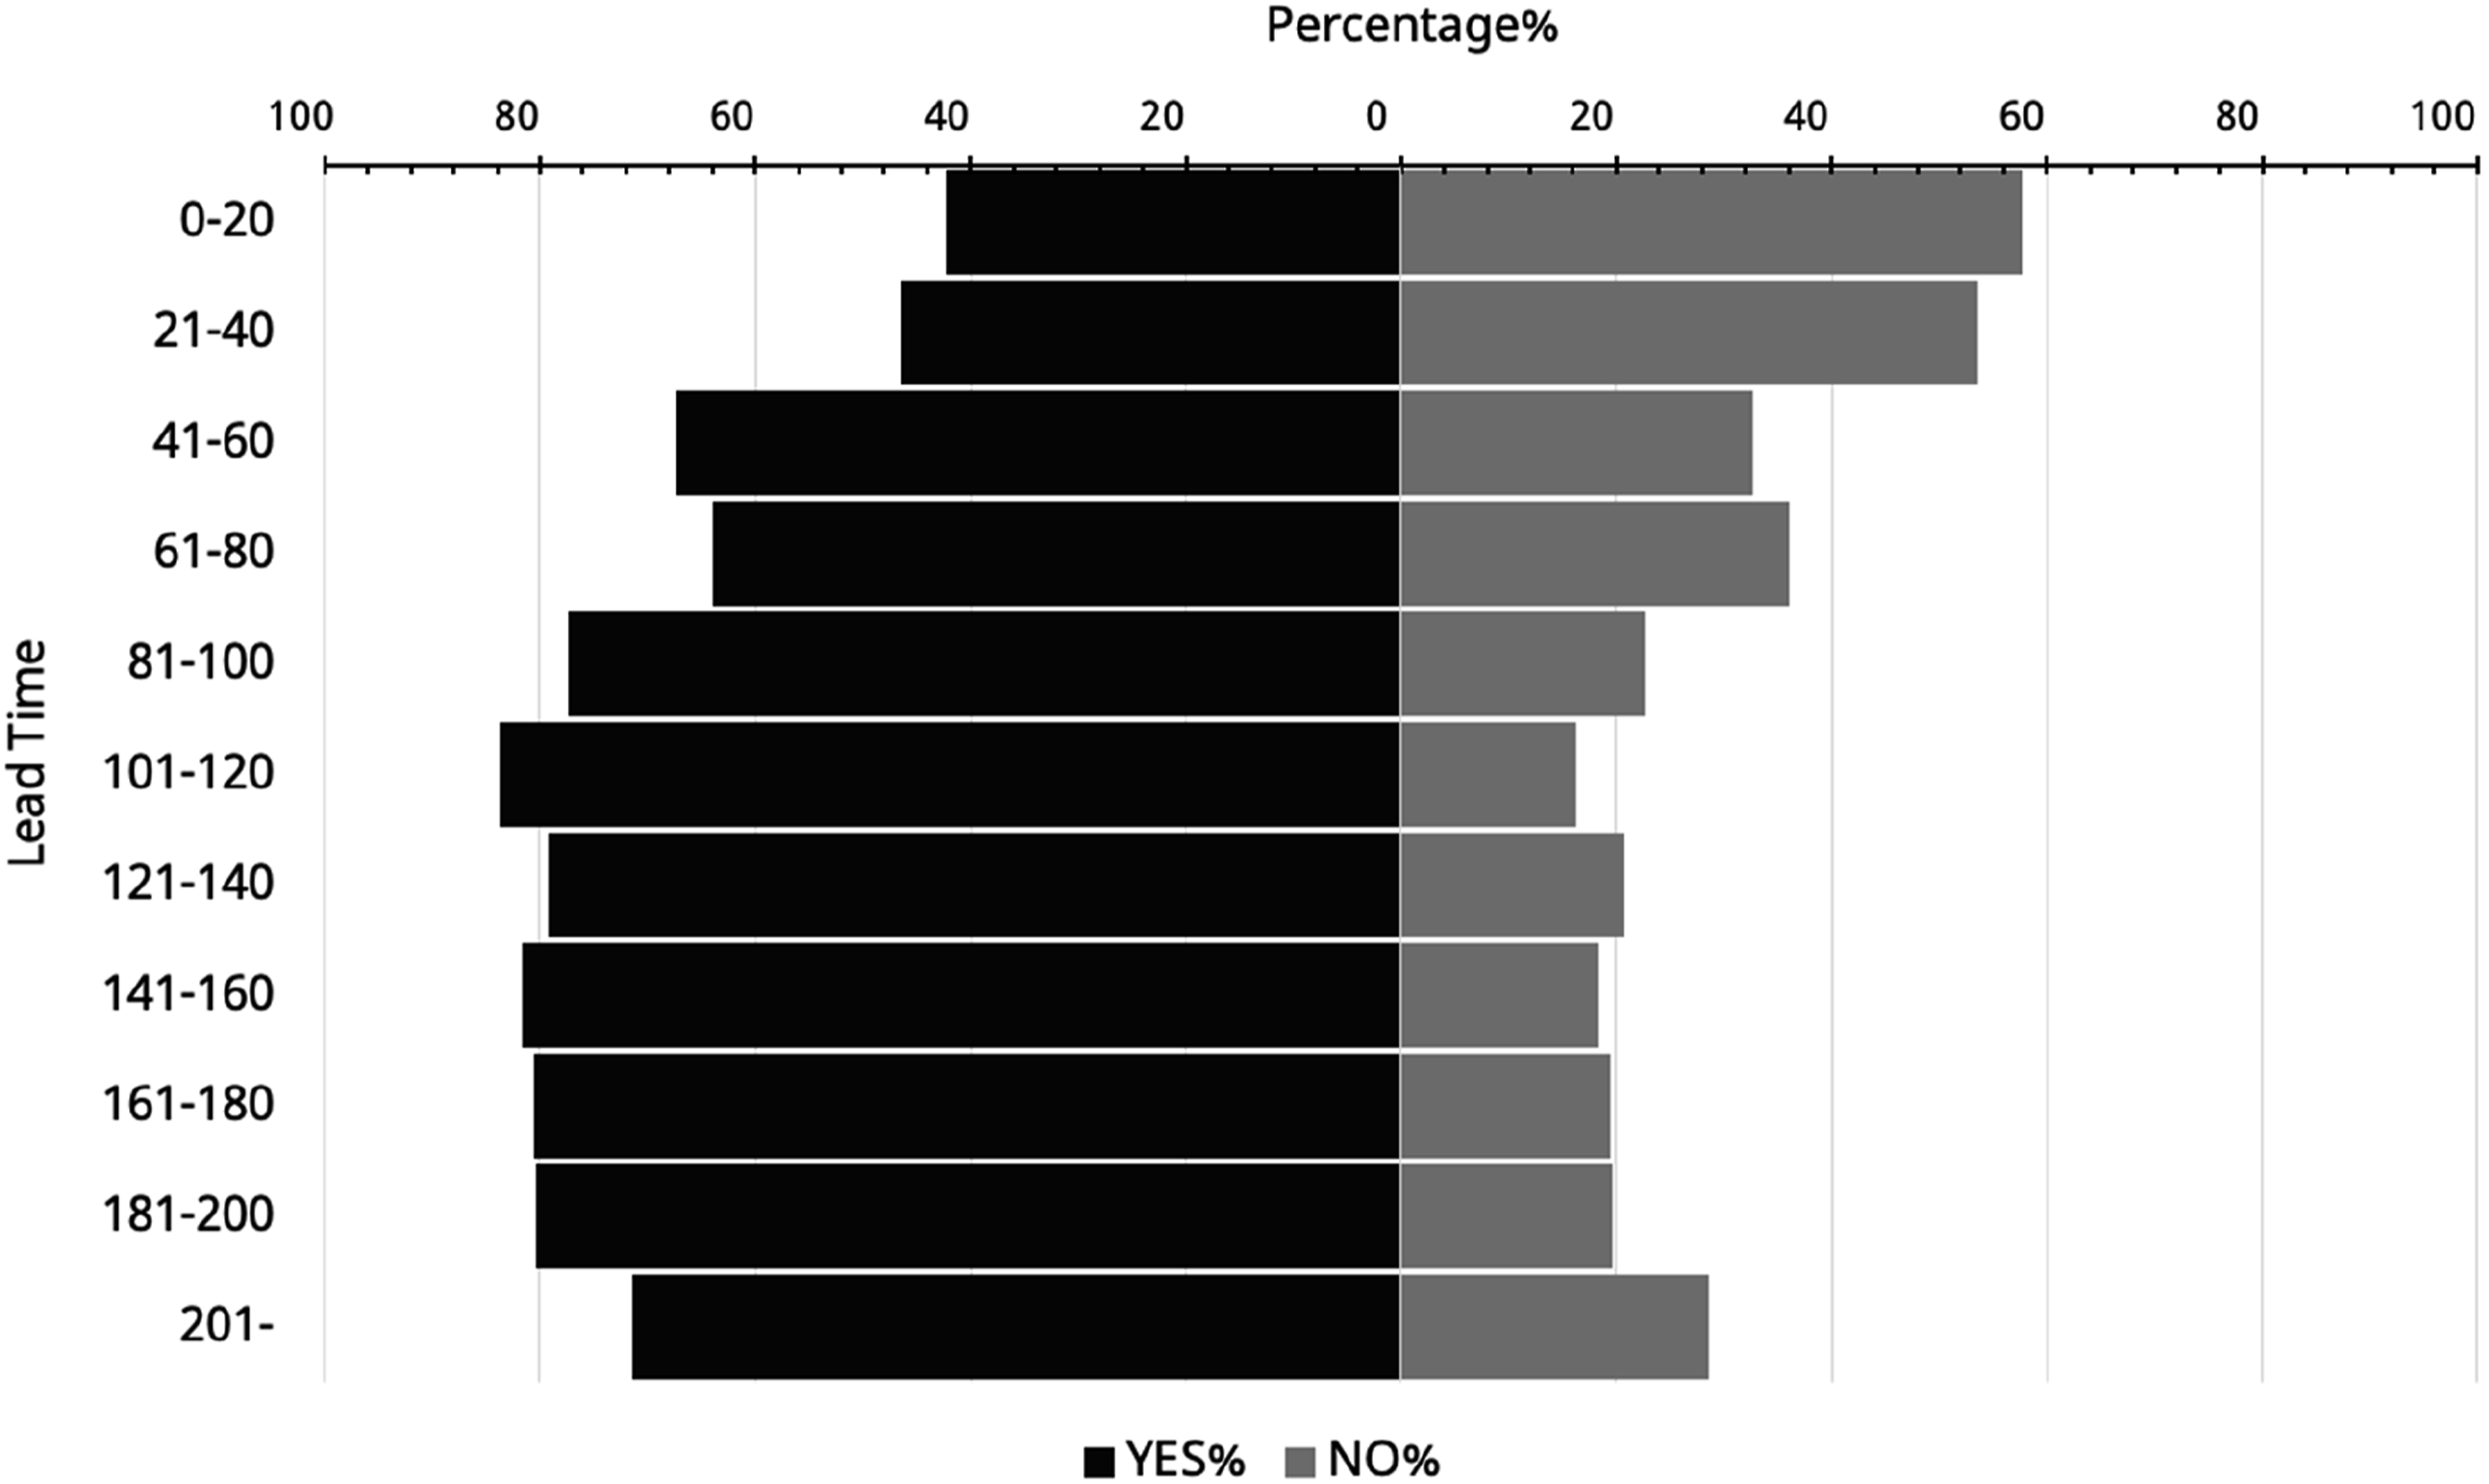
Analysis and summary of RQ1 findings
As the idea is to optimize the stock levels, the more the capital tied to inventory would be reduced with demand-driven planning the more beneficial it would be for the material to be purchased with the DDMRP method. On the other hand, optimization means that there should be no risk of the stock falling below zero since that scenario is harmful to the overall business. Thus, another condition that is evaluated is the average coverage of the average stock level that would be with the DDMRP method.
The evaluation of average coverage can be further justified by the fact that one of the fundamental features of DDMRP is to make forecasts irrelevant, preventing the information bullwhip effect. Consequently, this would mean that if the average coverage of the inventory is below the DLT, there would be no condition to use DDMRP in the purchasing process of the material. However, as the yellow zone in DDMRP buffer zones incorporates the lead time in the buffer, by multiplying LT with ADU, there should not be a situation where the inventory would go below zero during the purchasing LT of an item. A case in which this could happen would require a visible increase in ADU that would be easy to notice beforehand, by the demand spike evaluation for instance.
Due to the dynamic nature of DDMRP, there are no clear limits to generalizing whether the materials they limit should always be purchased with DDMRP or not. Rather, each material purchased should be viewed individually and set the appropriate values for them. It was found that about three out of four materials that are purchased by the CPF have the potential to lower inventory levels by planning replenishments with DDMRP-software.
Tool for identifying materials for demand-driven MRP
As stated in the preceding parts of this text, one objective of this research was to develop a tool that is used to identify DDMRP-suitable materials by the OP department of the CPF. The development was done by first adapting the calculation sheet used in the methodological phase of RQ1 and then by collecting qualitative data with semi-structured interviews. In this sub-section, the qualitative findings are first analyzed, after which the functionalities of the tool are described with the help of findings from quantitative analysis of RQ1 results and the development of a logic that outputs the recommendation to act as a support for decision-making.
Qualitative findings
The semi-structured interviews as defined in prior parts of this study were conducted with 13 respondents from the purchasing organization of the CPF. Altogether, the sample consisted of six operative purchasers, three managers, and four employees with roles in some development functionalities. Some of the respondents had an advanced level of knowledge about DDMRP, some a moderate level of knowledge, and the leavings a low level of knowledge. As the interviews included a question to determine the level of expertise of the respondent in the field of the subject area, the answers were stressed accordingly.
Answers from the semi-structured interviews by topic.

From Table 9 it is also seen from the last row that majority of the respondents support everyone as the target audience and integrating SAP to the tool. On the other hand, it is also seen that grouping under features, production under target audience, PowerBI under integrability, similar to SAP and report under user interface scores the lowest from the respodents. The results interpreted from the qualitative data collected with the interviews include different aspects that are considered when the tool for DDMRP suitability identification is developed. To begin with, the tool should be available for everyone in the case organization to use, even though the main target group that will be using it might consist of only individual planners and line managers. Consequently, the nature of the tool can be defined as strategic, as the purpose is to identify materials that would potentially benefit from demand-driven planning.
According to the responses, the integration of the tool into the case company’s existing ERP solution SAP is highly requested. However, based on timely constraints and observations made by the author, the tool would be better off integrated with Microsoft PowerBI, which is also incorporated into the operations of the CPF. The tool is integrated into a material planning report that lists all PIs that are defined in the CPF. PowerBI can best address the CPF’s needs when it comes to the identification tool of DDMRP-suitable materials. This is because e.g., it is simple and highly user-friendly, and regularly used by the target audience. Also, the report can provide one-dimensional answers with high accuracy, as identified as requirements for the tool.
Development of the tool
On top of the findings from the interviews, this sub-section addresses the logic behind the calculations that tell the user of the tool whether the material considered is beneficial to be replenished with the DDMRP method. The basic data model presented in Figure 6 is behind the calculations. The calculation of savings for each material during the last 6 months acts as a foundation for the tool that identifies materials that would be beneficial to purchase with the DDMRP method. In a nutshell, the tool is integrated into a PowerBI report of the CPF that is regularly used by the OP department. The report includes all materials of the CPF, and every planner can use the tool to analyze materials that are under their responsibility. In addition, the supervisors can use the report to assess different developmental challenges on a larger scale. As found with the semi-structured interviews, this is the arrangement most suitable for the needs of the CPF. The data model of the identification tool.
User interface of the identification tool.
Analysis and summary of RQ2 findings
To conclude, RQ2 delved into the accessibility and usability aspects of the studied tool, as interpreted from the insights gathered through semi-structured interviews. The findings prominently suggest that the tool in question has the potential to act as a support tool for decision-making in the OP department of the case company. A notable consensus among the interviewees is the unanimous agreement that accessibility is a central consideration for the tool. This aligns with the contemporary emphasis on democratizing data access within organizations, ensuring that tools are easily accessible to all relevant personnel. The implications of this finding underscore the importance of user-centric design and the need for intuitive interfaces that facilitate ease of use.
Moreover, the study’s exploration of the tool’s usability has revealed a relevant point of integration, which is the inclusion of the tool within a PowerBI report. This revelation carries valuable implications for streamlining the decision-making process, as PowerBI reports can serve as a hub for data-driven insights. By integrating the tool in this context, the case company can harness the synergy between data visualization and practical decision-making. This integration takes advantage of the strengths of both the tool and the PowerBI platform, leading to a collaborative and efficient solution.
It’s worth noting that the groundwork for the practical implementation of the tool has been laid out in the previous section through the implied data model. This serves as a foundation for the case company to effectively translate the conceptual framework into a working PowerBI tool. This shift from theoretical findings to practical development underscores the real-world applicability of the research findings. Finally, the study’s culmination in the development of the PowerBI tool by the case company substantiates the research’s objective of providing a comprehensive tool to address the research problems.
Change of purchasing costs when DDMRP is implemented
Introduction to RQ3 findings
The change in overall purchasing costs is dependent on various factors such as market volatility, the business environment of the CPF, and the output level of the production facility. Thus, no absolute number caused by the improvements can be stated in this study. However, the potential savings in average inventory levels caused by demand-driven planning on a specific time range in the past can be calculated. Consequently, the potential savings in average inventory levels is how the RQ3 is addressed in this research. Furthermore, other aspects of the financial impact originating from DDMRP implementation are assessed by estimations.
As stated in the methodology study, the inventory levels that were evaluated during the research were from the period between January 1 and June 31, 2023. All calculations and results regarding RQ3 have been calculated based on the data that was gathered from the review period. While it was discovered that if all materials that would have had lower stock levels during the review period had been purchased with DDMRP, the total decrease in total inventory value of the CPF would have been 63%, the process of moving all 4001 of these materials in the scope of the external DDMRP procurement system was considered unrealistic. Therefore, a scenario analysis of realistic implementation options was done to evaluate the financial impact of broadening the scope of DDMRP in the CPF. The results suggested that the comprehensively most rational option for scenario 2 (S2) with high (100%) manageability would result in some additional monthly costs, and 1.4% of one-off savings in the form of inventory level reductions. However, if the concept of decoupling points is examined throughout, the savings the CPF could face would presumably be higher.
Effects on purchasing costs
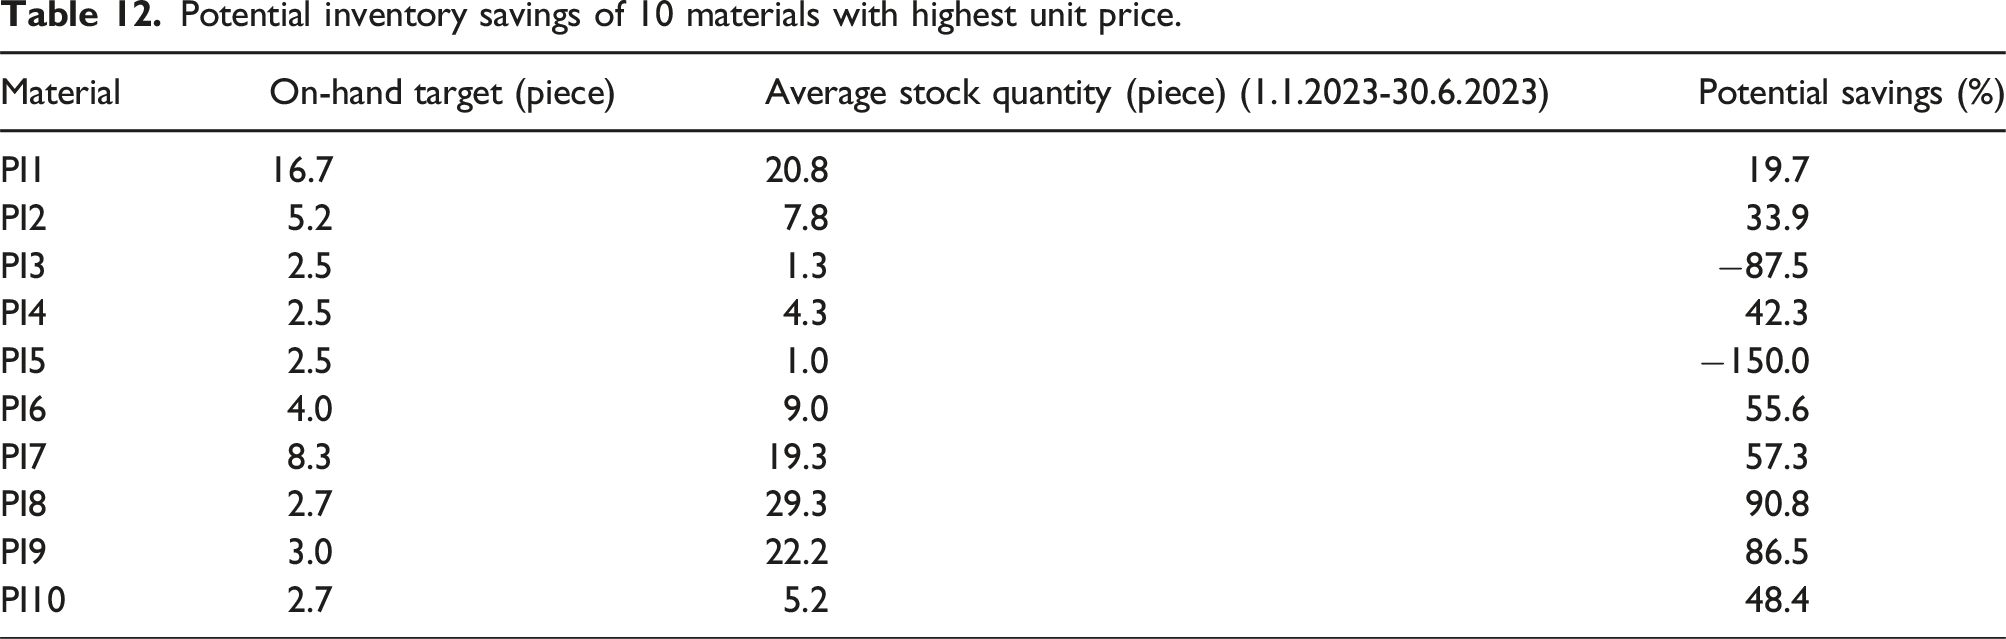
Potential inventory savings of 10 materials with highest unit price.
Furthermore, this analysis was done for all sample materials to form a thorough picture of the potential savings, and to form the final educated estimate of the total financial benefit of implementing DDMRP.
An educated guess and an estimate must be done to evaluate cost savings that could be achievable with DDMRP by the CPF. As stock-outs can be often prevented by using more costly express deliveries for the POs to arrive on time, the rare occasion of longer stock-outs originating by not having certain material available for production to use makes calculating the cost savings difficult. However, as DDMRP can prevent stock-outs with the dynamic buffers, using priority shipments should be reduced.
Breakdown of cost savings
The most savings inventory levels in euros were found to be possible to achieve with some key components that have unarguably the highest unit prices. However, since the unit price plays such a massive role in the average stock value, it can be declared that a huge impact in euros on the inventory value can be achieved when lowering the average stock levels just mildly when it comes to the materials with high unit costs. Nevertheless, the same components tend to generate big losses in profitability if not available for the production to use at the right moment. Top 10 potential inventorial savings in euros in the review period are implied in Figure 7. The horizontal row indicates the item that is listed, and on top of each bar in the chart, the savings are presented in percentage values. Top 10 potential inventory value savings.
While high unit prices account for the most savings in euros, it was found that the materials with relatively most savings (in percent) were not at all the same type of materials. In fact, the most savings in relation to the inventories managed by conventional MRP were found to be potentially achieved with materials that have a high ADU and consequently have relatively more pieces in stock, as more pieces are needed in the assembly of final products. In addition, the unit price is relatively low. Consequently, it seems that materials that have these characteristics ought to have high inventory levels since maintaining a safety stock for an individual purchased item with low unit cost appears as a cost-efficient insurance.
However, when many items are planned with the same method of keeping high safety proportions, the financial inefficiencies multiply. For example, the potential savings in average inventory value of PI1 was about 98.5% (see Figure 8). Figure 8 shows the materials that had the highest relative savings in the review period. On the horizontal axle, the materials are listed and on top of each bar the potential saved monetary value is listed. Top 10 materials with relatively highest savings.
The findings strengthen the observation that every material must be assessed individually to comprehensively define the potentiality of DDMRP in the purchasing process. For example, one material from the top 10 savings in euros (see Figure 7) has only 34% in relative savings, whereas another material on the same list is listed with 91% savings. The same logic is applicable to the top 10 relative savings (see Figure 8). Some materials with high savings when measured in relatively, have rather insignificant financial impact since the inventory level savings in euros are measured in less than a thousand euros.
Scenario evaluation.

Potential savings were adapted from the calculation sheet with the scope that S1 savings was composed of the potential savings of the top 10 materials, S2 savings of the ones defined, and S3 savings based on an estimation. According to Demand Driven Technologies (2020), inventory levels are usually lowered by 15% to 30% when implementing DDMRP. Based on the assumption that optimal implementation of DDMRP to correct decoupling points would lower the inventory levels by 15%, S3 was calculated to reduce the inventory level potentially by 15%.
Finally, the total risk was evaluated by multiplying a potentiality estimate of stock-out related issues with the value between 1 and 5 with a criticality estimate with a value likewise from the range 1 to 5. The indexed numbers that are presented in Table 13, were founded with dividing the value with the highest value of each category. For example, potential savings of S2 was divided by the highest potential saving, resulting to the indexed value of 0.06. The total impact of each scenario was calculated by summing up manageability and potential savings and extracting total risk from the equation.
The first scenario was achieved to potentially gather the most significant reductions in the total inventory value of the CPF, while simultaneously including the greatest risk of critical stock-outs. Furthermore, the low number of different PIs in S1 contributed to a relatively good level of manageability, lowered by the long LTs and shipping times. Consequently, total indexed impact of S1 was 0.75 + 1.00 - 1.00 = 0.75. Furthermore S2 had a total impact of 1.00 + 0.06 – 0.20 = 0.86, which was deemed as the highest impact. Finally, the total impact of S3 was found to be 0.50 + 0.64 – 0.45 = 0.44. Consequently, S2 was considered the best scenario.
The total financial impact of S2 was estimated by counting all relevant additional costs and savings to monthly cash flow and equity. Costs include the DDMRP software license fee that is paid annually. Positive monthly-based financial impacts include possible decreases in shipment costs and other costs related to insufficient inventory levels. Thus, monthly impacts were estimated to be around 7%.
For tied capital, the released capital from reduced inventory levels was estimated to be 1.4%. The reduced inventory was counted based on the savings indicated by the calculation sheet 25 SKUs that are supplied by three nearby suppliers for the CPF. These suppliers were observed to be reliable enough to be included in S2. The calculations regarding the inventory changes with respect to the financial side are visible in Abbreviation 2. Moreover, if the scope of PIs that are purchased with DDMRP is widened further the decrease of capital tied to excess inventory naturally increases.
Limitations and potential downsides
Due to restrictions in the calculation tool and data collection, no scale prices were considered in the estimation of the financial effects of DDMRP. Also, due to timely restrictions and limitations of the analysis tool, there is no proof that any of the materials would have held the inventory level above zero throughout the review period. Consequently, if some materials had been out of stock when needed in production, the savings raised from the lower inventory levels would have been reduced or completely overturned.
A potential financial downside for implementing DDMRP is also the fact that if the material master (MM) data or other relevant data or parameters are incorrect, the potential savings can turn into a potential increase in inventory levels. In the research, it was found that some purchased items would have potential negative savings on inventory values (i.e., higher inventories) during the review period, which implies that some materials that are not suitable for DDMRP would be better off by purchasing with conventional MRP. An example of this kind of material is presented in Figure 9, where the top ten (by EUR €) potential inventory level-increasing materials are listed. The inventory increase for some materials was measured even in tens of thousands of precents. While the additional inventory values are quite major, it must be noted that the values in euros are considerably lower than the values of the potential savings. Top 10 inventory value-increasing materials.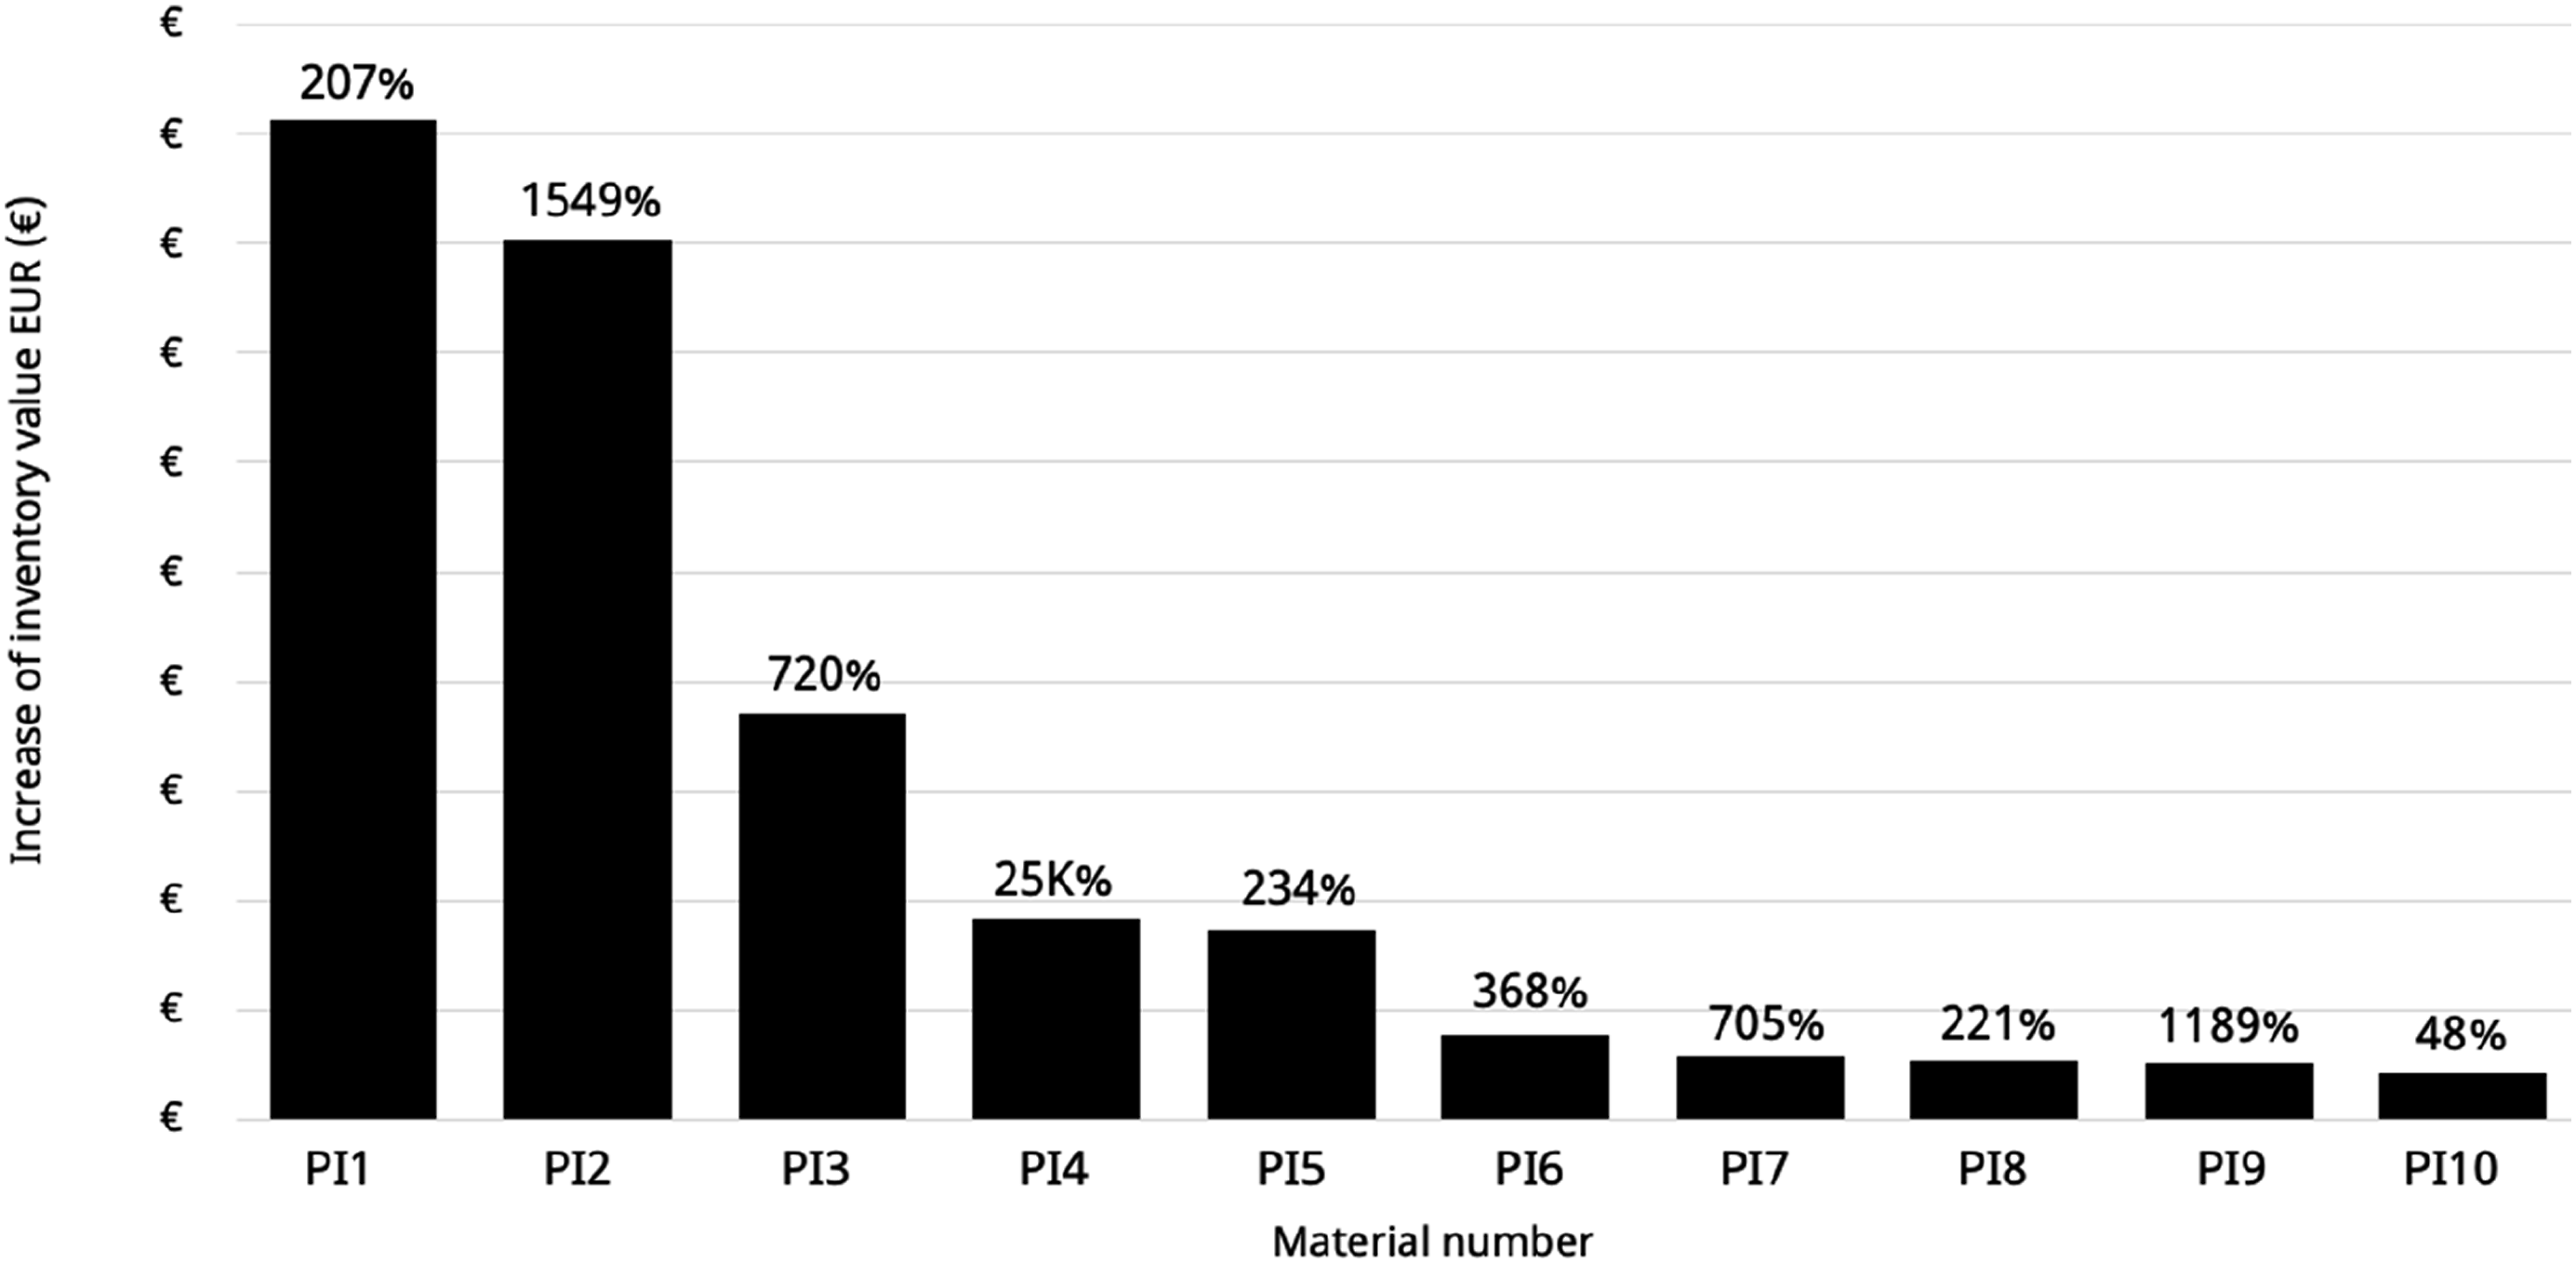
Analysis and summary of RQ3 findings
Around 40% of all analyzed materials were found to be unbeneficial to be purchased with DDMRP in the retrospective analysis. While it was discovered that if all materials that would have had lower stock levels during the review period had been purchased with DDMRP, the total decrease in total inventory value of the CPF would have been 63%, the process of moving all 4001 of these materials in the scope of the external DDMRP procurement system was considered unrealistic. Therefore, a scenario analysis of realistic implementation options was done to evaluate the financial impact of broadening the scope of DDMRP in the CPF. The results suggested that the comprehensively most rational option S2, would result in some additional monthly costs, and 1.4% of one-off savings in the form of inventory level reductions. However, if the concept of decoupling points is examined throughout, the savings the CPF could face would presumably be higher.
Discussions and conclusions
This research was done to assist in the process of piloting the demand-driven planning approach in a case company and in its operative purchasing. The case company desired to get insights into DDMRP as a planning method, with a focus on what purchased materials should be included in the scope of the method, and what would be the financial consequences of purchasing these materials with DDMRP. Consequently, three research questions arose that addressed all the objectives of the research, forming a comprehensive base for solving the research problems.
Results from literature search and main findings of the study
From past research it is noticed there are no identification tools available to choose purchasing materials to plan DDMRP.13,14,32,47 Additionally, it was found from literature search that although implementing DDMRP can bring clear advantages to a company’s operations, the process itself requires a great deal of effort to get the desired result. Moreover, no supporting evidence of the universal applicability of the method to all industrial contexts was found.49,50 Moreover, it is observed from literature search that traditional inventory planning systems are not designed to operate in volatile, uncertain, complex, and ambiguous business worlds.2,7,32–34 Furthermore, it is also noticed that there is a lack of clear boundaries between the demand-driven replenishment method and the purchased materials.11,12,25,33
Based on the identified literature gaps, this study proposed three research questions which were addressed individually with methodologies most suitable for each question. Regarding material suitability for DDMRP, no delimiting boundaries for material characteristics were found, since the analysis of the sample data suggested the materials that would have performed better with DDMRP during the review period represented almost all different material types. An exception was materials with current procurement modes that limit every requirement to be individual. These materials are not now possible to be integrated in the external procurement software incorporating the DDMRP method that the CPF uses.
However, the inventory levels and usage data, together with an additional buffer determined by the supply chain unreliability of an individual material during the review period defined whether the material would possess the potential to benefit financially from planning the purchasing with the demand-driven method. Based on the results, about two-thirds of the sample materials were found to have saving potential in inventory levels, which accounts for a total of 65.5 million euros in decreased inventory value.
The calculation sheet that was used to get the results to RQ1 and RQ3 formed the basis for the identification tool that was initially developed in the study. In addition, results from interviews that were conducted with supply chain professionals suggested the general user interface of the tool and simple, and to act as a supportive instrument in decision-making of the case company. Consequently, the identification tool was defined to be integrated into a current material planning tool of the CPF that is accessible through Microsoft PowerBI.
Managerial implications
Based on the findings, a thorough examination is necessary before implementing DDMRP purely based on the tool’s output. The first choice is to choose the materials with the highest estimated savings to test the procedure. The second choice is to increase the process step-by-step, working with one provider at a time and involving all pertinent parties. The third alternative is to increase the understanding of DDMRP inside the CPF organization by addressing the buffer positioning follow-up research topic before expanding the range of materials that are acquired using the DDMRP method. Regardless of the approach chosen on the subject, it is generally advised that the case firm make sure all relevant data are current before moving forward with the idea, including making sure the data is maintained that way going forward.
Option 1 proposes a prudent but doable approach to DDMRP implementation. Starting with the materials that offer the biggest savings based on the tool’s forecasts is what it suggests. Because its goal is to maximize profits while minimizing potential disruptions, this method is savings oriented. Before proceeding, though, a careful comparison of the anticipated savings with the actual results is necessary. If the technology regularly generates accurate predictions and there is confidence in its savings estimates, then this strategy might work well. However, there is a chance that materials with lesser projected savings will go unnoticed, even if they could have a significant impact on overall efficiency gains.
Option 2 focuses on implementing the DDMRP approach gradually and under supervision. The plan is to implement the strategy piecemeal, starting with one or a small number of suppliers and working your way up to larger organizations. Incorporating pertinent stakeholders guarantees a knowledgeable execution that tackles possible obstacles or opposition. This course is advantageous because it controls the possibility of disruptive changes and enables the organization to grow by learning from its mistakes and improving the procedure over time. To fully reap the benefits, though, can take more time and require careful supplier coordination.
Option 3 suggests a more thorough organizational change in the direction of DDMRP adoption. It recommends investigating buffer location as a future study topic to expand the organization’s understanding of DDMRP beyond the immediate tool usage. This calculated action may result in the optimization of overall inventory management. This strategy, however promising, necessitates an organizational commitment to information exchange and comprehensive training. This evaluation is based on the CPF’s willingness to adopt the DDMRP technique and its desire for change.
After a thorough evaluation that considered the danger of stock-outs, the second option was determined to be the most logical and is recommended for implementation by the case company. Irrespective of the approach selected, the widely accepted advice to start implementing DDMRP using current data is quite significant. Additionally beneficial to the ongoing daily operations is this exercise. If the data is not updated prior to installation, it may jeopardize the benefits that come with DDMRP.
Practical implications and study limitations
As the aim of this study was mainly to produce practicable results for the use of the case company, it must be acknowledged that the findings might not be directly applicable to other organizations. Furthermore, the implementation of DDMRP should always be done considering the operating environment of the organization. However, the identification tool and the CDAF parametrization model that takes supply environment unreliability into account contribute better to the field of industrial management, both academic and practical world. This is justified by the fact that the material data used to calculate the potentiality and the CDAF, including LT, ADU, supplier reliability, quality notifications, and consumption data, is presumably widely used across different organizations.
Limitations of the trustworthiness of the results that were brought up in this study regarding the results include potential data inaccuracy, specific procurement modes for specific materials that limit the applicability to DDMRP scope that was not visible from the material master data studied, and the fact that the inventory adequacy was not able to be incorporated in the identification tool. Despite the limitations, the findings can be described as precise, since all the calculations done in this study are rather simple, decreasing the risk of faulty outcomes.
Recommendations for future research
Subsequent investigations may focus on integrating DDMRP throughout a production facility’s whole workflow, encompassing the detection of decoupling points. A tool that assisted in locating the decoupling points in the finished goods’ BOM would also be in high demand. Determining the most beneficial and accurate DDMRP parameters in various market settings would be another useful research issue in the academic framework of industrial management. Examining the impact of transparent and cooperative execution on a larger scale, combining Industry 4.0 ideas with the DDMRP approach, is another fascinating subject. If the acquired things could be tracked through a transparent supply chain, the method’s efficiency might increase. Moreover, by combining DDMRP with the most effective technology now on the market, organizational responsiveness and adaptability may reach unprecedented levels. 53
Footnotes
Declaration of conflicting interests
The author(s) declared no potential conflicts of interest with respect to the research, authorship, and/or publication of this article.
Funding
The author(s) received no financial support for the research, authorship, and/or publication of this article.