
Abstract
Software industry has adopted automated testing widely. The most common method adopted is graphical user interface test automation for the functional scenarios to reduce manual testing and increase the repeatability. Reducing execution time and redundancy to achieve quality “go/no go decisions” provides rational for the executive management to allocate funds to adopt automation and invest in the setup including people, process, and tools to achieve faster time to market. There are a variety of practices engaged by testers, like frameworks, tools, methods, procedures, models, and technologies to achieve automation. Nonetheless, the actual effectiveness in terms of return on investment (ROI) is not known, though there are various formulas to calculate ROI of test automation. The factors that determine the ROI are maturity of test automation, purpose, or intent, picking right tests for automation, knowledge of the tester to derive test coverage, domain expertise, defining right metrics like defects found by automation runs, cost versus reduction of time, labor versus quality of scripts, repeatability, and results. These factors form the base of the questions designed for the survey. The paper presents a survey and analysis to understand the ROI of test automation from industry test professionals from both product and services organizations.
Introduction
Executives in the commercial IT industry strive to automate all test cases to save time, get repeatability, identify defects early, increase quality, and cut cost.1 The nature of software testing activity is a support function, and hence, it is treated as cost center. Therefore, the inclination to automate all test suites to minimize the cost is widely common.2 100% automation is rarely achieved in the organization 3 because of various impeding factors. In a survey of industry professionals, only a meager 6% think that 100% automation is possible. 2
Often the first step to automation by software companies is to embrace functional test automation, which involves the graphical user interface (GUI). This takes considerable investment, and the challenges are plenty. 4 There are a lot of research and case studies that describe various approaches to increase benefits and reduce cost. There is still some way to go. 5 The important factor where the management underestimates the cost is when it comes to maintenance of the suite. 6 The IT services industries provide automation services to the software product organizations. This is one of their mainstream businesses. While the product organizations do own automation teams, it is largely viewed as an activity that can be outsourced. The success depends on achieving repeatability, uncovering defects, and faster execution while keeping their maintenance cost low. This has been the nemesis in the SDLC cycle.
There are numerous research works in this area on automation tools, methodologies, comparison of frameworks, return on investment (ROI) computation on using certain tools over other tools, and low code—no code automation. But there is no real answer in terms of ROI on automation for the organization.
The method proposed here is to create a survey questionnaire and gather the answers from the industry professionals and analyze the results, with the current pay scale (from PayScale 7 data as of 2021) and derive the real scenario in the industry. Also, from the data collected, the expectations of the services and the product industry on ROI of automation are illustrated using correlation.
The paper elicits review of literature on automation, its activities, frameworks, tools, ROI, scope of IT industry, and so on. Problem description, research method, sampling distribution mechanism, survey design, survey validity, survey execution and data collection method, response quality, PayScale data for automation engineers, data analysis, response variation, observations, results, and conclusion are discussed.
Review of literature
The systematic review of literature discusses the various aspects, factors and benefits of test automation, and the works of researchers in terms of ROI yield. Efficiency, effectiveness, and precision are the three main factors that determine the success of automation in any organization. Efficiency means optimized test coverage, execution time, write once run anywhere 3 and maintenance, 6 effectiveness means the right tests that are beneficial to the customer’s usage, 8 and precision means able to repeat the correct results. 9 The review of literature is carried out to present the various researches that are already published. They are classified and referenced according to the various categories that are highlighted in italics. These served as a base for designing the survey questionnaire. There are a lot of generic automation framework for different applications and References 10–14 provide the, research that is published in this area. Web automation framework is an action-related framework and it is UI driven. References 15–18 provide the research that is published in this area. Device automation framework has been gaining popularity with device farms and device automation frameworks to enable mobile device automation frameworks.19–23 Choosing the right GUI tool with accessibility, federated, and industry case studies are discussed in References 2, 24–31. Automation frameworks based on GUI Models are expected to ease the automation activity.32–35 Dynamic test generation methodologies like codeless automation and auto generation of tests have been in research and being adopted by the industry professionals.36–39 Model-based automated test generation is used for high coverage, and keyword-driven GUI tests are user-friendly.40–42 UML-based test generation for textual and visual patterns for generating tests is used for functional test coverage. 43 With DevOps, the adoption of continuous integration and development became imperative for automated code deployments.44–47 The same is now extended as QAOps for continuous verification for executing automated regression test suites.48–50 Unit test cases provide the code coverage and they are even automated and autogenerated unit based on models.51–57 Behavior-driven test for graphical user interface tests using Cucumber and Gherkin is widely adopted for mobile GUI automation. 58 ML/AI test framework, the recent researches present ways to create machine language–based automation of tests.59–65 Low-code automation is the latest adoption by the industry for building blocks of code that can be easily assembled to quickly build workflows and functional scenarios and use cases. The main advantage is it saves time because the blocks are reusable. The same concept is adopted for testing for non-technical, citizen testers to write automation scripts.66–68 Reusable libraries framework and reusable test libraries reduce maintenance effort and maximize test coverage.69–73 The services organizations employ a test factory mechanism where it is persona-based automation. An experience report on industry practice is discussed. 74 The product code is refactored every now and then to ensure scale, technology adoption, and optimization. Similarly, there is research for identifying tech debt in test automation and applying software design principles for test automation development.75–77 The criteria for when and what to automate are decided by the factors eligibility, priority, cost, coverage, end user usage, quality, maintainability, and time.78–80 Certainly, there are various impediments for automation, and the factors contributing to hindrance of a robust test automation suite are discussed in Reference 81. Automation framework challenges typically are usability and metrics like test coverage, test effectiveness, usability, and defects found.4,82 It is interesting to note that automation practice is researched by region. Industry practice adopted by professionals from various regions is presented in References 83–85. Again automation practice by industry verticals and its study on different organizations are highlighted in References 86–88. Similarly, automation practice by infrastructure, for example, DevOps-related software test automation, is discussed in Reference 50. Benefits and limitations of automation are measured by cost, quality, time, effort, maintainability, and return on investment (ROI).8,89 With the microservices, serving different clients and applications running on different multitenant servers rises a need for distributed test agent framework to enable cross platform frameworks to function.90–92 Automation metrics define the usefulness of the automation and measure the quality of the product with cost and time. 93 Maintenance involves effort and the ease of maintaining the automated suite.6,11,94 Automation complexity like greedy-based test suite reduction methods95,96 is mostly still at the research level. Automation test coverage ascertains the quality of tests that yield maximum benefits.97–99 Automation is also used as decision support system to support go and no go decision for production code promotions.100,101 Automation effectiveness is measured by the number of defects found and quality of software under test.102,103 Automated suite optimization helps in reduction of tests to minimize effort and time and results in overall quality for the software under test.104,105 Automation ROI estimation helps to justify the time and material spent on the automation suite with respect to quality.106–110
Problem description
Every software company, with faster to market strategies in place, strives to adopt automation to provide quality by investing in resources like tools, frameworks, infrastructure, consultation, and people. The average testing spends in the last 5 years according to Statista are 28% of the overall IT spend. 111 Also, the estimated market size for test automation by the year 2026 is $60.4 billion. 112
One of the main focuses of automation is to achieve customer- and user-centric test coverage 103 with repeatability and reduced time, catch defects early, and save cost. Unfortunately, achieving ROI requires knowledge in test coverage, maintenance of suite, and setting automation goals. The current trends in automation are all about tools and number of tests automated.
Continuing with this prevents the focus on the test coverage, test optimization, test effectiveness, etc. Developing more informed KPIs for test automation could help the software organizations to measure the cost and saving to derive the ROI on automation spend. The proposed paper aspires to present the current understanding of industry professionals on test automation and what might be the present ROI for the software organizations from the sample. For collection of data, a specifically designed survey questionnaire is created to capture present usage and metrics and circulated via electronic medium targeted to the current industry professionals who practice/manage test automation. The Conclusion section presents the results with required charts and analysis.
Research method
The research method adopted is the survey research method because it requires to collect data from various software organizations on their current practice, observations, and results. This approach collects the qualitative and quantitative primary data by self-reported measures, on the understanding of test coverage and actual automation coverage from a sample of industry professionals from their respective organizations. The secondary data for cost of tools are referred from the top-used tools website.113–115 The secondary data for cost of test automation professional is collected from PayScale website. 7 The experimental data is derived from the primary data to correlate unit test coverage to functional coverage, automation ROI from the perspective of industry test professionals who work for product organizations versus services organizations. The analysis of data from industry practice professionals presents analysis for the questions—“is there an ROI for automation?”, “Is there a difference in expectations—product versus services” because it is a cost for product organizations and revenue for services organization.
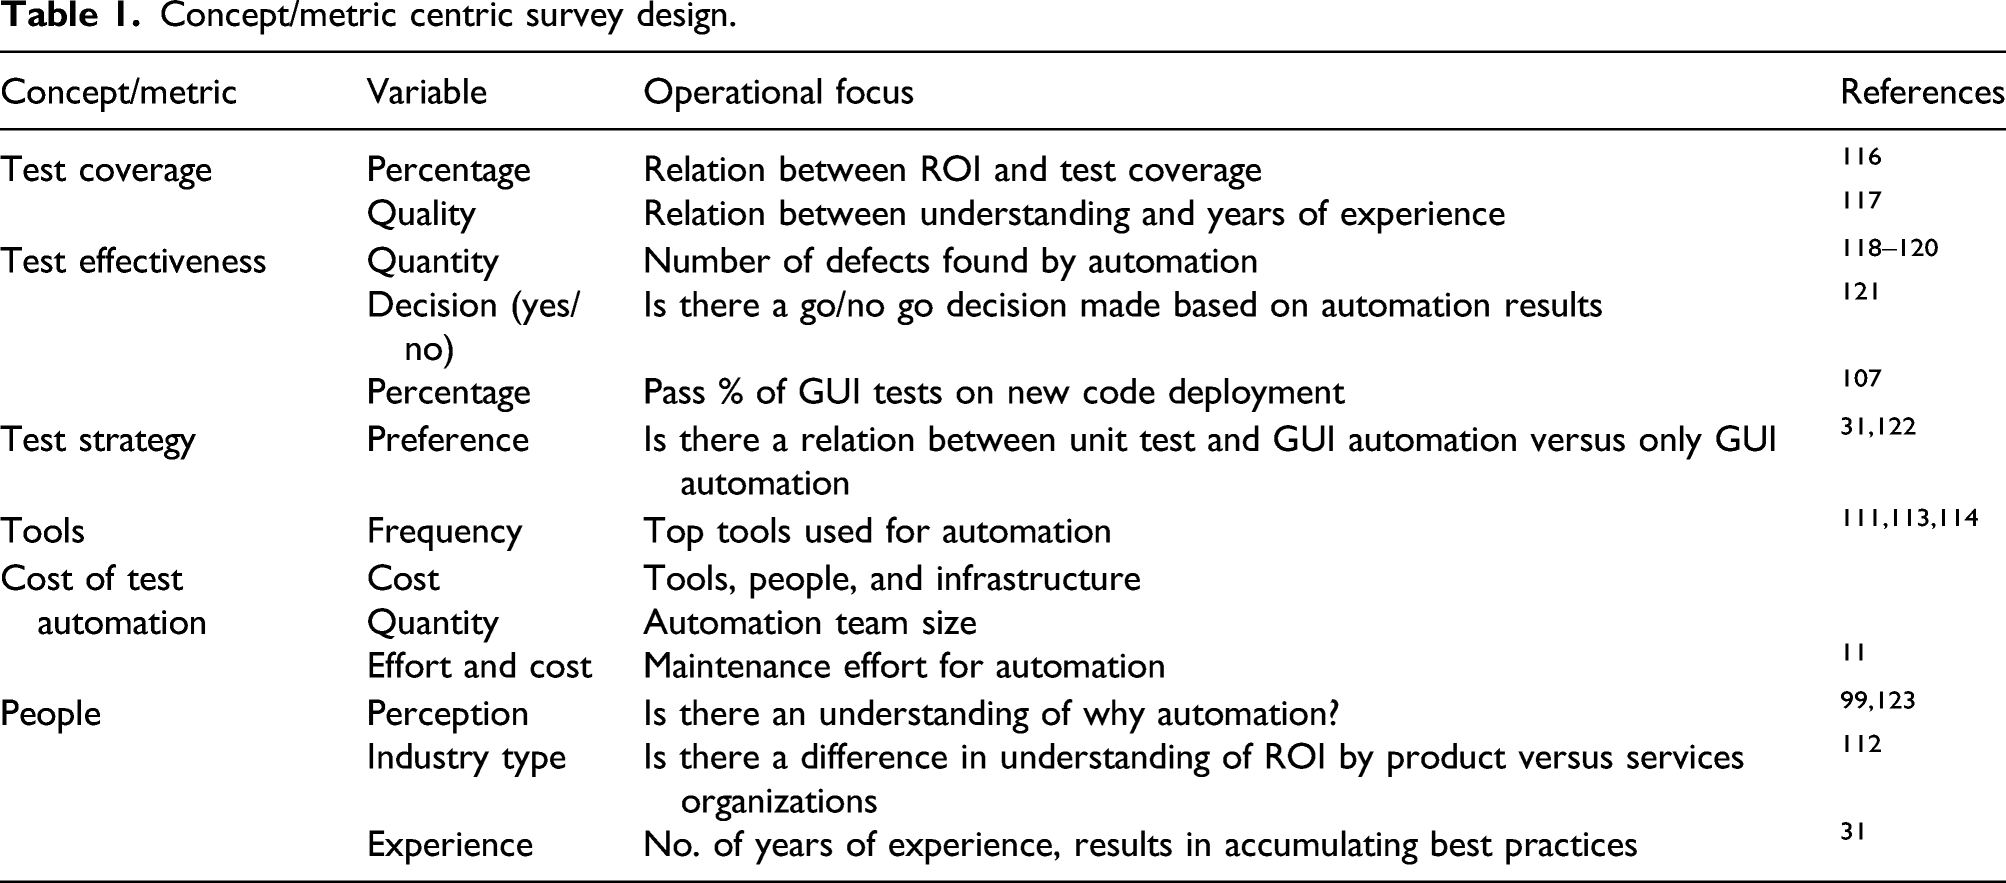
Survey design
Concept/metric centric survey design.
Sampling and distribution mechanism
Scope of IT industry
This section depicts the target organizations and the survey execution (Figure 1). The software companies registered with Ministry of Corporate Affairs (MCA.gov), India, and have presence in Bengaluru, including the international software organizations represent the target population of the survey. The survey was a paid survey and researcher self-funded the research. Survey execution and data collection methodology.
Survey execution and data collection methodology
The survey questions are added to a Google Form. The sample selected are the test professionals from the software industry from this region. The form was circulated to a. email list of industry professional, b. shared via WhatsApp to list of phone numbers of industry professionals belong to this region, and c. to Bengaluru-based testing groups on LinkedIn. The phone number was an optional field; if the respondent wanted to be paid, they chose to provide the phone number and was paid INR 50, for each successful response. The survey duration was from 23 March 2021 to 29 April 2021.
Survey validity
The survey was sent to 118 industry professionals, and 54 responses are received from the target commercial software organizations from the target region.
Quality of survey questions
The design of survey concentrates on concept versus practice-centric questions to draw the response toward the ROI, as explained in the Survey Design section. Some of the respondents conveyed their appreciation on quality of questions verbally, as well as in the comments section of appendix-2. Few respondents did require help in understanding the concepts to answer the survey. The tone of the questions is maintained neutral to eliminate any bias where most of the questions could be answered descriptive and if they are multiple choice, there was a choice for open-ended answer.
Quality of response
The responses when tabulated are found to be 95% good to do further data analysis. The 5% of data cleanup had to be done in the following areas like a. 15 responses for unit test % were left blank (here, an average is considered as 20%), b. 2 responses for organization name are left blank, c. 9 responses for test coverage are No (This factor is considered as limited knowledge for test coverage among industry test professionals), and d. 2 outlier responses for ROI, namely, 300% and 150%. Hence, out of 54 responses, 49 responses are considered with categorizing them into product organizations and services organization. However, this research also presents the outliers data in comparison with the cleaned-up data, wherever it is required.
Categorization of responses
The responses are primarily categorized into product and services organizations based on the organization name mentioned by the respondents. This helps to understand aspects of testing activities from different point of views from the industry professionals. If they are part of product organizations, then they are the owners of quality for the product. If they are part of services organization and provide engagement to support testing activities of a product organization, they act as support function. The other major contributor to the difference in point of view is it is an expenditure/investment for a product organization, whereas for services, it is this activity that brings revenue. Since the motivation and goals may vary depending on the engagement model they belong to, the responses are categorized into responses from industry professionals working in product organizations and services organizations. The one-way ANOVA results (Figure 2) notice that p-value is 0.93, p > 0.05, and hence, the means are equivalent between the groups. Also, F-value < F-crit value. Hence, accept the null hypothesis. Response variation with ANOVA table.
Data analysis, observations, and inferences
Response variation
31 numbers of responses are from respondents working in product organizations, 23 numbers of respondents are from services organizations, and 2–3 numbers of respondents are from the same organization often large but different divisions. The (Figure 3) charts show the organization type and the years of experience from the survey responses. For our research purposes, the IT education and IT banking are custom solutions and mostly employ people for their own back-office purposes—hence the classification as product. Interestingly, the product organization has more experienced professionals than the services industry. This may be due to the engagement model of the services sector to be profitable, where the professionals are trained and deployed in a client organization (typically a product organization).
112
Response variation with box plot and ANOVA table.
Average of factors from respondents
Average of factors from respondents.

It is observed that the test coverage, bugs found, and ROI yield are low. Besides, the maintenance (fix of script failures and change of scripts due to application changes) is high at 22%–30%. In the coming sections, each factor is analyzed separately, in combination with related factors to further examine them to deduce if the above factors have any impact on the ROI yield.
Number of defects versus automation team count
The following Figure 4 shows that irrespective of the team count, the number of defects found is mostly below 10 and concentrated near 5. Notice that few professionals from services have quoted beyond 10. Number of defects versus automation team count.
Return on investment yield from overall responses
The ROI yield, as quoted by the industry professionals, is plotted alongside the test coverage, and failures due to application changes and script failures. The maintenance is the overhead and contributes to the robustness of the suite. Failures are main factors that contribute to the stability of the automated suite. Test coverage contributes to the confidence of the suite. Hence, they are important in determining the ROI. The below charts compare the factors with and without outliers.
As observed in Figure 5, the data for outliers shows that where the test coverage is high and the failures are low, the ROI is more, especially the outliers Verizon with 300% and other with 150%. Their primary suite is API based and not GUI based and hence is treated as outliers. ROI yield from overall responses with outliers.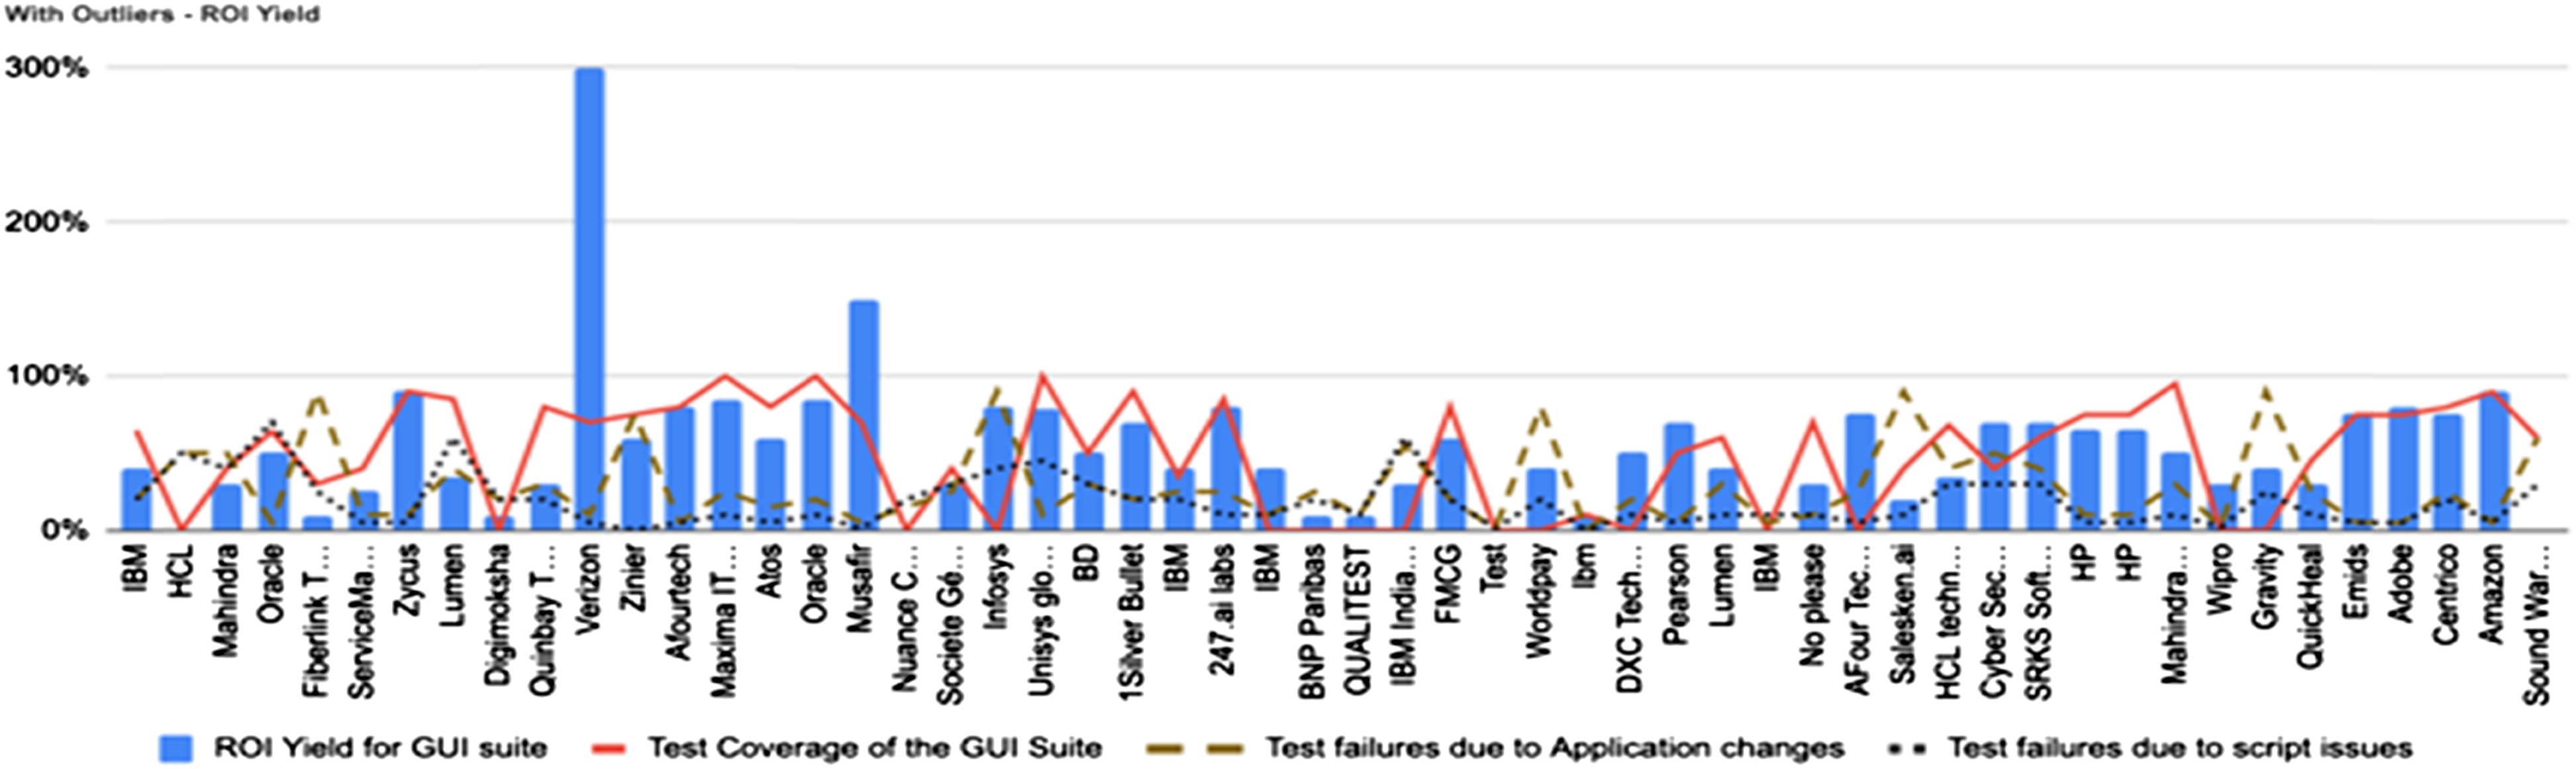
As observed in Figure 6, the data without outliers shows that the trend of ROI range is between 26% and 51%. There are a few interesting observations: a. Where the failures are low and test coverage is high, the ROI is also high and vice versa and b. few industry professionals have quoted otherwise. Let us further dissect the data in the next section to understand if the organization category or any other factor is a contributor to this. ROI yield from overall responses without outliers.
A mathematical computation on correlation is shown in Figure 7 to support the above observations. Note that there is an overall positive correlation between test coverage and ROI yield and negative correlation between ROI yield and failures due to app changes, script failures. Correlation between ROI and other factors (with and without outliers).
Clarity in understanding of “return on investment on test automation” by respondents
This section aims to see if the understanding of the industry professionals is in the right direction, especially with categories, namely, product and services. Figures 8 and 9 call out the difference in responses from product and services professionals. Figure 8 represents the responses from professionals from product organizations and Figure 9 represents the responses from the services organizations. Clarity in understanding of ROI on test automation—product organizations. Clarity in understanding of ROI on test automation—services organizations.

Results from various statistical analyses of the responses.

A mathematical computation on correlation is shown in Figure 11 to support the above observations. For product, there is a positive correlation of ROI with coverage, defects, unit tests, team count, years of exp, % of suite automated, and 95% pass achieved and a negative correlation of ROI with failures on both app changes and script issues. For services, there is a negative correlation of ROI with team count and failures and interestingly failures due to app changes are positively correlated.
From the response it is found that ∼82% mentioned GUI suite is not productive without unit tests (Figure 12) and ∼57% mentioned GUI suite is not productive without unit tests (Figure 12). These unit test cases help to generate technical wealth.
124
Failure of scripts versus number of defects found by categories. Correlation of ROI with failures and defects found by categories. GUI automated suite productivity without unit test cases by categories.


Finally, the responses are sorted to get the responses with high (>70%) ROI. The following Figure 13 highlights the gap in clarity on test automation. In the case of product, low failures, high coverage, more scripts automated, and high pass percentage contribute to high ROI. In the case of services, few responses with high failures, not known coverage, and average number of scripts automated cannot contribute to high ROI, but then the respondents have quoted high ROI. Comparison of high ROI responses (>70%)—product versus services.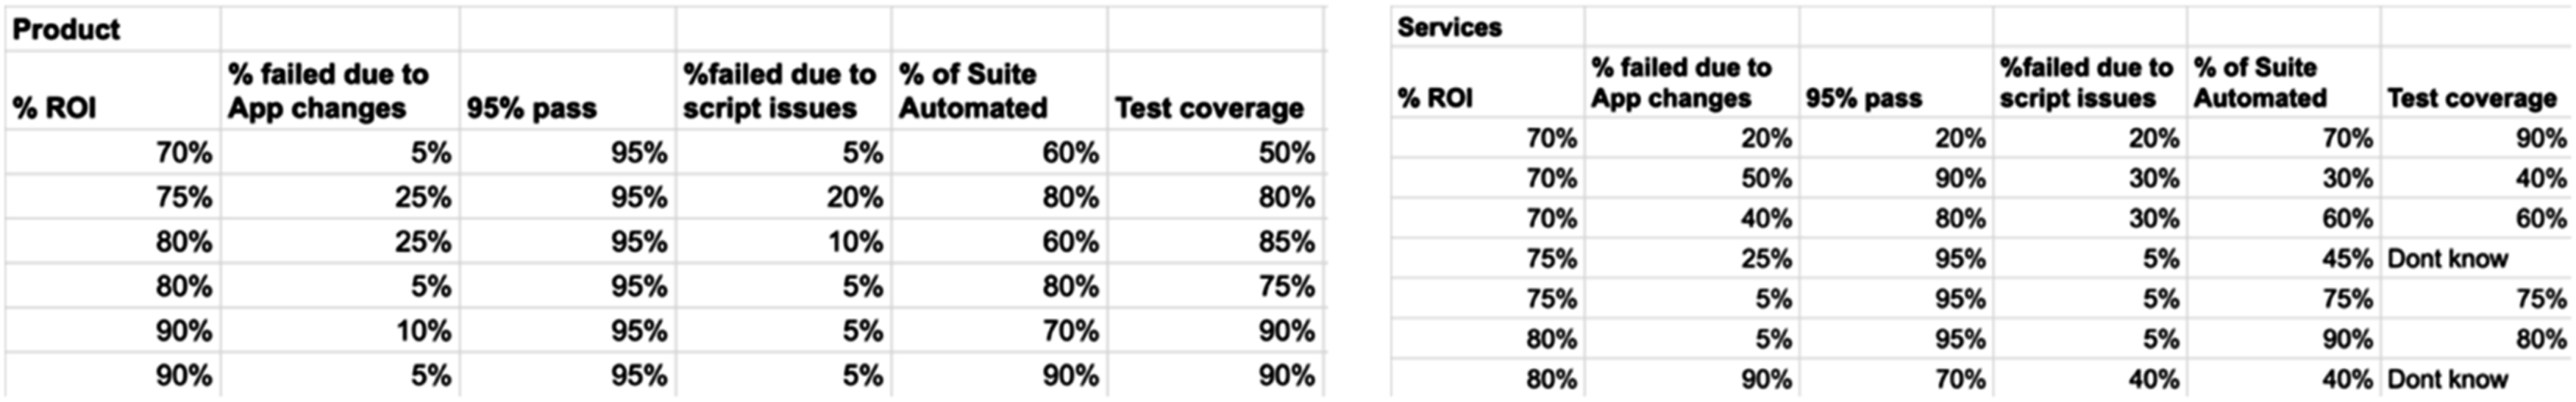
When the responses are sorted to get the responses with low (<30%) ROI, the following Figure 14 highlights the gap in clarity on test automation from both product and services respondents. Comparison of low ROI responses (<30%)—product versus services.
Tools and licensing cost data
The paid tools has more adoption in product organizations, though the usage percentage is about 5% and the cost ranges from $2000 125 to $20,000 126 per year based on the tools that are used. But predominantly, open source tools are preferred with in-house frameworks depending on code base and other operations based on release cycles, that vary from one team to another. 127
Figure 15 shows overall open source is predominantly adopted for automated testing by both product and services, although services professionals use commercial tools like UiPath
128
and QTP/UFT.
129
Various tools used—all respondents.
Figure 16 shows the overall tool dispersion against the tool dispersion between the product and services industry. Tools usage—product versus services.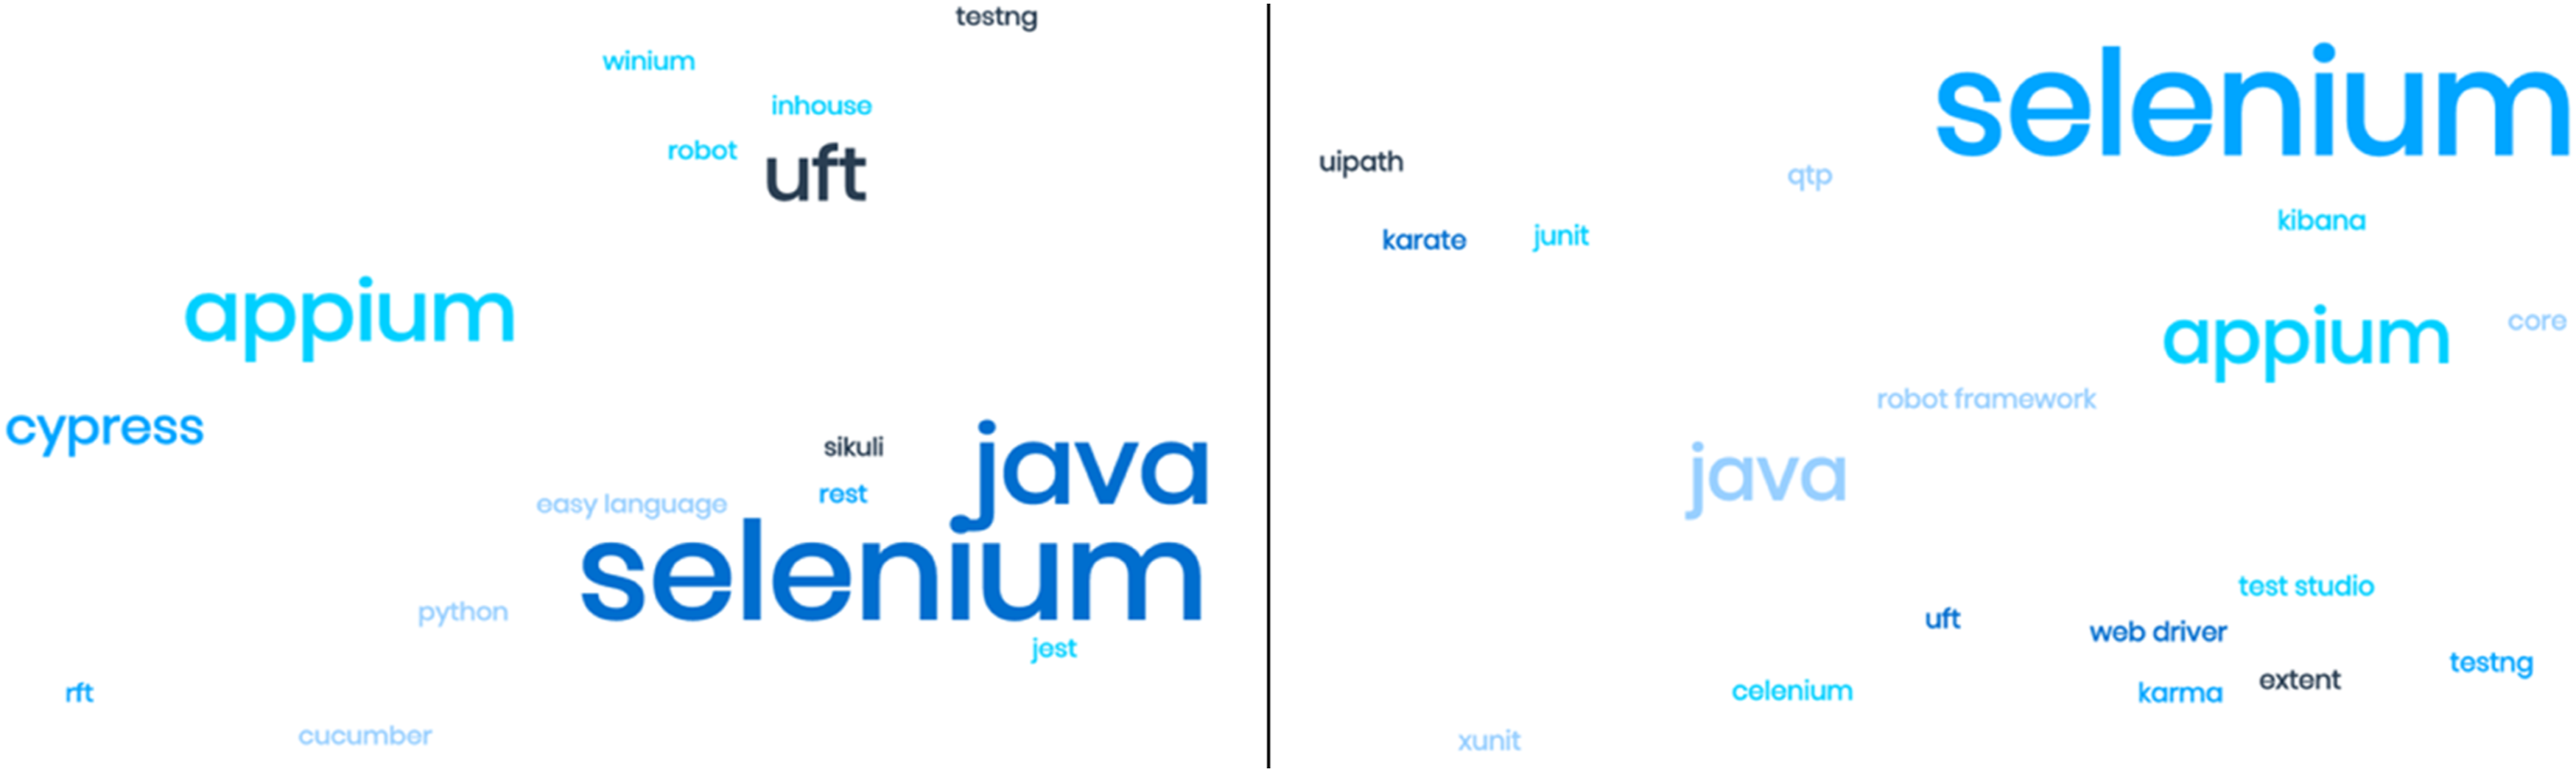
PayScale data
Test automation role: pay range in Bengaluru from PayScale.

Average investment based on sample versus ROI yield
Average team size from the sample = 10.
Assumption
7 members, one lead, one Manager, and one test architect; Average Lower Limit for SDET + Senior SDET: (□8,00,000+□13,00,000) = □ (21,00,000)/2 => □10,50,000; Average Upper Limit for SDET + Senior SDET: (□10,00,000 +□15,00,000) = □ (25,00,000)/2 => □12,50,000; No. of average team member (lower limit) = 7 => 7*□10,50,000 = □73,50,000, No. of average team member (upper limit) = 7 => 7*□12,50,000 = □87,50,000, Average Lower Limit for Lead + Test Architect + Manager: (□15,00,000+□23,00,000+□25,00,000) = □63,00,000, Average Upper Limit for Lead + Test Architect + Manager: (□18,00,000+□26,00,000+□30,00,000) = □74,00,000, Average Total Team cost with lower limit = □1,36,50,000, Average Total Team cost with upper limit = □1,61,50,000, Hence, average spend range for a 10-member team is anywhere between □1,36,50,000 to □1,61,50,000 => ($187,552 to $ 221,902).
The PayScale data mentioned in this paper are from industry professionals employed by organizations. Hence, the amount mentioned is based on salaries drawn by them. If a services organization is engaged for consulting, the costs vary, and typically, the consulting engagements are higher than the salaries provided to employees in a range of about 20%–40%. So, these costs would go up by 20%–40%. Typically, QA services are rarely tiered and listed on websites. But QA Mentor, a testing services organization, provides some view into a pricing structure. 130 Adding to this, the tools and licenses section of this paper highlights the cost of commercial tools.113,114 Hence, if these tools are used, then the cost may be incremented anywhere from $2000 to $20,000.
Conclusion
The data from the samples presented from the point of view of respondents are from product or services organizations. In the real-world scenario, the services industry mostly deploys their professionals in the product organizations for aiding the test automation in the product organizations as that is the business model on which they operate. From the analysis of this paper, the observations deduce that the product and services show a difference in their respective point of views, with respect to test automation.
In reference to Statista, the average spend on testing from overall IT budget is 28% for the last 5 years, but the analysis of the sample collected from different organizations for this paper highlights the areas (presented in Table 3) that contribute to low ROI on test automation. The common denomination is the difference in understanding the perspectives of automation (product and services organizations) and its goals (way to automate vs automating the right test). The results show us unit tests and the right automation helps to generate technical wealth that aids in faster, cleaner, and quality deliveries with low maintenance.
Dimensions of expertise, project automation, and quality goals are indirectly considered with the experience. Expanding this may provide more insights. For future work, dimensions of expertise, automation goals, metrics, etc. may be added to measure before and after experiments, on the actual testing experience from the organizations that have low ROI yield. Experiments could be to set the automation goals and metrics and align with the right understanding and then measure and optimize the ROI continuously.
Footnotes
Acknowledgments
We are grateful to all the respondents who have filled in the questionnaire for automation ROI.
Author Contributions
Survey and analysis.
Declaration of Conflicting Interests
The author(s) declared no potential conflicts of interest with respect to the research, authorship, and/or publication of this article.
Funding
The author(s) received no financial support for the research, authorship, and/or publication of this article.