
Abstract
This study analyses the relationships between service capabilities and financial statements indicators of 76 U.K. service providers belonging to the Standard Industry Classification (SIC) 49410 (‘Freight transport by road’). These firms were clustered in four different groups according to their service capabilities by employing content analysis on open secondary data. Then, statistical tests were employed to analyse whether groups with different service capabilities differ in key financial statements indicators. As the results show, economic-financial indicators (e.g., turnover) do not vary significantly between the groups, whereas differences arise in the number of employees and other asset-related indicators. It follows from these results that within the same SIC code, the various assortments of service capabilities do not have repercussions on the firms’ profitability; on the other hand, these assortments are correlated with firms’ size and infrastructure (e.g., magnitude of the Stock & W.I.P.). This research develops a heuristic approach using open secondary data to identify and classify service capabilities, and to investigate their relationship with financial statements indicators. This approach can be replicated in other business sectors thus supporting managers in identifying their firm’s capabilities and those of their competitors.
Keywords
Introduction
The acquisition of resources, their bundling in capabilities and the leveraging of such capabilities in markets are the steps by which firms’ strategies, aimed to gain a superior competitive advantage, unfold. 1,2 While the Resource Based View (RBV) theorizes how strategies are formed and their expected outcomes, the field would benefit from empirical research testing the linkage between resources, capabilities, asset-structure and value creation. 1,3 Particularly in the service sector, where room for competition is wider, the profit margins are potentially higher, and these kind of studies more scant, 4 the study of innovative and value-creating service strategies is a research priority. 5 –9 This study analyses how firms’ resources are bundled in logistics service capabilities (hereafter service capabilities or, more simply, capabilities), and how these service capabilities impact on a series of key financial statements indicators. In order to moderate the effects of exogenous factors on the analysis, potentially relevant when the RBV theory is adopted, 1 the study focuses on the homogeneous business sector (ceteris paribus analysis) of U.K. road transport logistics service providers (PLs). 10 –12
Throughout Europe, PLs have had a decade-long metamorphosis. ‘Freight transport by road’ industry (SIC code 49410) is moving from a highly fragmented to a more concentrated one. 13,14 In the U.K., according to a 2016 report of the National Bureau of Statistics, this has resulted in both the firm’s average fleet size and number of employees increasing by 35%, along with a 4% rise in the industry’s share of GDP. These statistics confirm the important role this sector plays in the UK economy. 10
Research has so far focused on PLs’ supply chain management and operations. 14 –19 In comparison, PLs’ service capabilities and their impact on performance indicators have received less attention. For example, Liu and Lyons 20 found through a cross-sectional analysis that 3PLs with different service capabilities did not have different financial performances. Hofmann and Lampe 21 used a cross-cluster longitudinal analysis of financial statements data and found that PLs with different service capabilities (2PLs, 3PLs, 4PLs) and different SIC codes have differences in profitability and tangible assets. Liu and Lai, 22 through a cross-sectional analysis, found that different levels of specific service capabilities (i.e., external capabilities) did not directly affect 3PL’s financial performance. In contrast, Liu and Lyons 20 and Liu and Lai 22 used survey data (Likert scales) to proxy financial performance, whereas Hofmann and Lampe 21 used financial statements data. To contribute to this line of research, this study uses a cross-sectional analysis to discuss the relationship between PLs’ service capabilities and their financial statements indicators. 11,20,23,24 Peculiar to this study is the analysis of financial statements data of different PLs (2-3-4 PLs) belonging to the same market, i.e. the U.K. SIC code 49410 (‘freight transport by road’).
The service capabilities offered by each PLs have been collected using content analysis on open secondary data (PL’s websites), while the relationship between capabilities and indicators has been analysed through non-parametric statistics. Financial statements indicators have been broken into economic-financial (EF) and non-economic/financial (NEF) indicators. The former are indicators that directly relate to a firm’s cash inflows and outflows (e.g., turnover), while the latter indicators are related to the firm’s infrastructure (e.g., the number of employees).
By analysing within a particular SIC code how the differences in the range and type of service capabilities offered affects the firm’s financial statements structure, this study will provide an empirical application of the Resource Based View (RBV). In fact, as the business is the same (i.e., the SIC code is the same), the variations in the indicators are due to the different ways in which the PLs organize and deploy their resources to offer specific service capabilities. 1 Furthermore, this study will analyse the stratification of the U.K. road transport market and thus will appeal to all U.K.-based stakeholders, including managers and policy makers.
The research framework is explained in the next sections. Subsequently, the road transport firms’ different combinations of service capabilities are derived and statistical analyses performed. A discussion of the results follows.
Research framework
Theoretical background
The Resource Based View (RBV) theorizes that firms compete by acquiring various resources through bundling these resources into capabilities and by leveraging such capability bundles into specific markets. 1,2,25,26 Thus, RBV has been widely applied as a theoretical foundation to explain the existence of different capability bundles among logistics firms, as well as studying the effects of different combinations of capabilities on performance and non-performance indicators. 11,20,24
RBV adopters argue that PLs use various tangible and intangible resources to develop capabilities addressing specific customer needs. 11,20,23 ‘Resources’, ‘capabilities’ and their combinations (i.e., strategies) are key RBV concepts. A resource is any ‘asset or input to production (tangible or intangible) that an organization owns, controls or has access to on a semi-permanent basis’. 27 Resources are idiosyncratic attributes controlled by firms whose combination are the basis for their capability development. 1,25 They can be classified into resources exploiting either tangible or intangible assets such as trucks or knowledge. 20,28,29 Capabilities refer to ‘the ability of an organization to perform a coordinated set of tasks, utilizing organizational resources, for the purpose of achieving a particular result’. 27 Capabilities are refined resources that cannot be traded. 29,30 An example is the number of post-graduate employees, which can somewhat be ‘traded’, and the corresponding capability, which cannot be directly acquired on the market, namely the expertise of these employees. For PLs, ‘capabilities’ often refers to service capabilities, i.e. services offered to customers. 24,31,32 This study uses this definition. Service capabilities can be further broken down into two other subgroups: basic service capabilities or ‘low-scope service capabilities’, and value-added service capabilities or ‘broad-scope service capabilities’. 21,33
Basic service capabilities refer to goods delivery that are part of the core activities of the logistics business such as product tracking, picking and packing, 24 temperature-sensitive truck-loads, 21 and contract distribution. 11 Value-added service capabilities refer to activities beyond those strictly related to goods delivery. These capabilities are based on tangible or intangible assets. 11,24 Value-added service capabilities based on tangible assets include diagnostic services and truck customization, whereas capabilities based on intangible assets are often knowledge-intensive solutions such as project management, consulting, and advanced telematics. 11,20,24,34 –36 Different combinations of service capabilities give rise to different service strategies for the PLs’. 21,32,37 In addition, groups of PLs with different service strategies give rise to different strategic groups. 38
Research hypotheses
PLs have different service capabilities, and this affects their performance in various ways. Previous studies have explored some of the open questions related to this matter. For example, several studies have focused on an analysis of the service capabilities adopted by PLs, 23,29,39 and the influence that these capabilities have on each another. 12,40,41 Conversely, other studies have analysed the relationship between the deployment of certain service capabilities and the variations in key financial and non-financial indicators. 22,28,38
In their study, Liu and Lyons 20 categorized a sample of 3PLs according to the extent of their service capabilities concluding that there was no direct relationship between groups of PLs and financial performance. Similarly, Kuo et al. 31 used a cluster analysis with PLs in the container shipping industry and found that clusters with different intensities of various service capabilities did not result in diverse financial performance. In these examples, service capabilities and financial performance have been measured using Likert scales. On the other hand, Hofmann and Lampe 21 grouped different PLs (2-3-4PLs) across various SIC codes (e.g., sea-freight, road transport, etc.) based on their type and range of service capabilities to analyse the variations in their financial statements data. They found that the PLs groups showed differences in indicators such as ROE, ROA, Current Ratio, yet they were similar in their capital structure (e.g., Equity Ratio, Financial Risk Assessment).
Based on this line of research, further studies have focused on PLs with specific knowledge-intensive service capabilities and their relationship to performance indicators. 11,28 Results confirmed several of the RBV’s hypotheses. That is, PLs with valuable capabilities that are difficult to imitate prosper in their specific market niches. 2 Shang 42 found that warehouse service capabilities, that are not difficult to copy, were not linked to better financial performance (Sales, Market Share, and Profit). In comparison, Karia et al. 28 and Karia and Wong 11 have shown that PLs exploiting service capabilities related to IT infrastructure and managerial expertise, that are difficult to copy, achieved better financial performance. Similar results were found for PLs exploiting knowledge-intensive service capabilities according to studies by Evangelista et al., 32 Liu et al., 29 Ellinger et al., 12 Huang et al., 43 and Ellinger et al. 44
Scholars have recently indicated that additional research is necessary to explore the relationship between PLs with specific service capabilities and their financial statements indicators.
21,23
This study has responded to the call for additional research by focusing on PLs belonging to the ‘freight transport by road’ sector (SIC 49410). By using financial statements data, this study argues that there is no difference in economic-financial (EF) indicators among different PLs with diverse service capabilities. The rationale for this is that efficiency in the market niches within the SIC code 49410 would discourage the use of suboptimal strategies.
1
However, according to RBV and earlier logistic research, this paper theorizes that PLs with distinctive knowledge-intensive service capabilities achieved better financial performance.
8,11,28,45,46
Thus, the following two hypotheses have been developed:
H1a
: PLs belonging to the SIC code 49410 offering different combinations of service capabilities do not have diverse values in specific EF indicators.
H1b
: PLs belonging to the SIC code 49410 offering knowledge-intensive service capabilities do not have different values in specific EF indicators.
The first hypothesis examines the EF indicators of PLs with different service capabilities. The second explores whether PLs with knowledge-intensive capabilities have superior EF indicators. Both hypotheses have been formulated as null-hypotheses, with both being tested as two-tailed to reduce Type I errors, according to the recommendations by Fleiss et al. 47
Different service capabilities depend upon specific tangible and intangible resources,
23,48
such as using qualified employees for consulting services, and software engineers and RFID sensors for routing services. PLs’ non-economic/financial (NEF) indicators have been rarely used in the logistic literature. Hofmann and Lampe
21
are among the few scholars that analysed the differences in NEF indicators among heterogeneous PLs. They found that PLs with different service capabilities, such as sea freight and railway trucking, have different NEF values. This further substantiated RBV theory, according to which firms will differ in their resources even if they are in the same industrial sector.
1,2,49,50
In fact, firms with different combinations of service capabilities use a variety of resources and subsequently have different NEF financial statements indicators.
11
This study argues that PLs with the same SIC code and different service capabilities have different NEF indicators. Hence, the following hypothesis is presented:
H2
: PLs with different combinations of service capabilities do not have different values in their NEF indicators.
Here again, as in the two hypotheses stated earlier, this hypothesis has been expressed in terms in the null form.
Research methodology
Service capabilities can be found and financial/non-financial indicators can be measured through primary or secondary sources. 40 Liu and Lyons 20 surveyed a sample of 3PLs regarding their service capabilities using a Likert Scale (Scale 1–7) based on the axes of capability ‘x’ and intensity ‘y’. In contrast, Wong and Karia 23 have taken resource bundles from the PLs’ profiles available on the web. Shang 42 used a survey to study the impact of integration and organizational learning capabilities based on the PLs’ performance. As recommended by several scholars, when available, secondary objective data should be used. 20,51,52
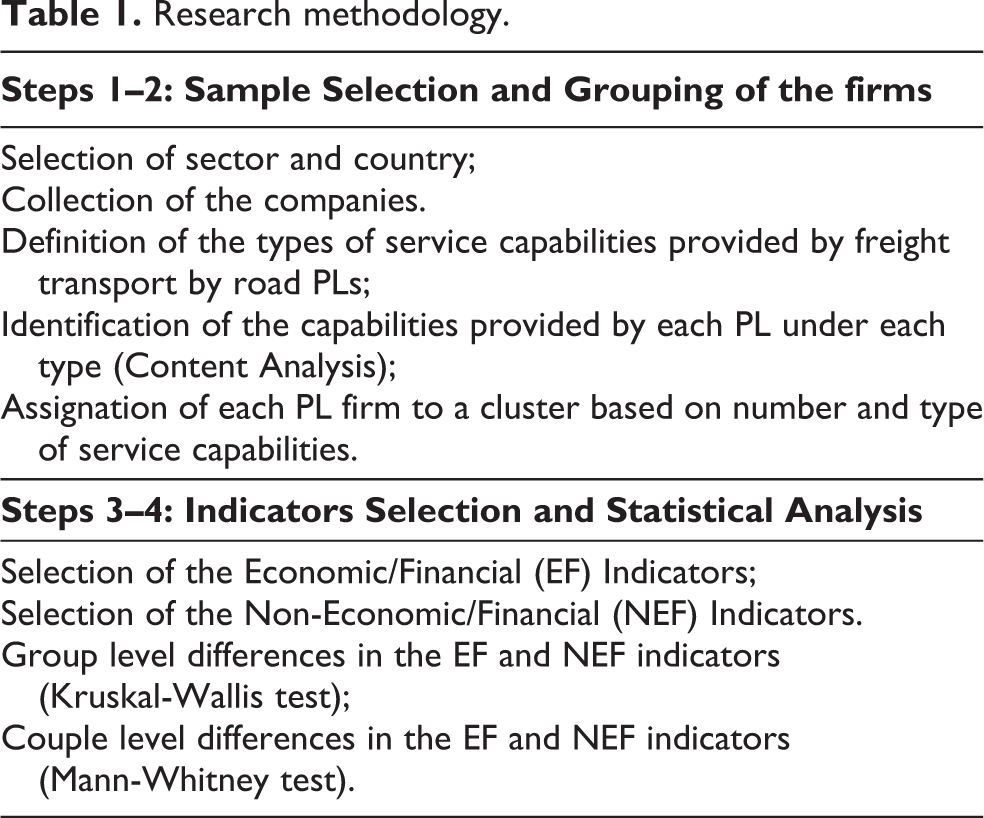
In this study, the different PLs in the 49410 sector have been identified by content analysis of open secondary data, namely PL’s websites. 53 Similar uses of content analysis have been already applied to logistics, 21,23 road transport, 44 and website analysis. 54,55 The evaluation of H1a, H1b and H2 was based on a series of non-parametric tests applied to the PLs’ financial statements indicators. 56,57 Kruskal-Wallis tests were used to investigate the variations between the groups, whereas Mann-Whitney tests were applied for the same purpose between combinations of PL groups. 20,24 In Table 1 a sketch of the analysis is reported. Details are provided in the following sections.
Research methodology.
Grouping of the firms
Sample selection
The same country and industry (ceteris paribus) have been used to remove contingent factors when analysing variations in the PL groups. 1,3,25 Freight transport by road has been chosen because it is a key sector in all developed economies. 10 The U.K. was chosen for analysis as it has an excellent infrastructure for freight transport. 58 –62 Furthermore, it is an island; therefore it is a good environment to further limit the effect of contingent factors. The PLs have been selected from the Financial Analysis Made Easy (FAME) database, a Bureau van Dijk product (Table 2).
Query and companies’ footprint.

Several PLs that were classified with the SIC code 49410 have been queried. Those with a limited road transport business, such as PLs offering mere relocation services, have been excluded from this study because they are outliers, in terms of their service strategy, with respect to the targeted sample. In the final sample, there were 76 PLs. Analogous studies have used the same database and analysed a similar number of PLs. 20
Identification of the service capabilities within each company
PLs (2-3-4 PLs) have been classified according to the service capabilities they offer. 21,33 Service capabilities were identified through content analysis of each PL’s website. This procedure is necessary because, contrary to the SIC code, which is assigned univocally based on the major source of value added (or, as is often the case, turnover), there is no similar procedure to assign an ‘nPL’ code to a company. Service capabilities have been measured by assigning the word ‘yes’ if they could be identified in the PL’s website; otherwise, ‘no’ was used. 32
According to the recommendations by Dubois and Gadde, 63 multiple rounds of websites’ analyses have been performed. The first screening of the websites was performed using a list of service capabilities extracted from a series of highly ranked research papers. 11,20,24,64 –74 Then, following the procedure adopted by Cassell and Symon, 75 multiple rounds of examinations of the PL websites were performed and a list of capabilities specific to the companies selected in the sample was developed. Service capabilities were then placed in one of the three category types: basic service capabilities, value-added capabilities based on tangible resources, and value-added capabilities based on intangible resources. Attention was also given to the most appropriate labels for each service capability. This is common practice in content analysis applications when refining and standardizing the coding tool for the analysis. 53,76 It is also useful in a later stage of the analysis when external coders are involved. After three rounds of website examination, the authors agreed on the classification, a point referred to in the literature of content analysis as theoretical saturation. 76 The process was finalized by revising the list of service capabilities with two external experts, as suggested by Ellinger et al. 44 and Creswell and Miller. 77
Table 3 indicates the identified service capabilities in the sample and their definitions by giving some examples that are useful for their identification. The service capability type (Ti) definition is cited on top of each of the groups.
Service capabilities in the UK freight transport by road (SIC 49410).

The reliability of the service capability assignation of each company (Appendix 1) was tested with an external coder (an experienced researcher with a background in transportation research). The coder had to decide on a sub-sample of PLs whether or not (‘yes/no’ scale), based on the content of their website, each PL provided any of the 12 service capabilities shown in Table 3. 78 For this analysis, the coder was provided with Table 3 as a coding tool. At the end of the process, the outcome was compared with Table 1A (Appendix 1) through a ‘percentage agreement’ criterion. That is a measure of the total number of pairwise agreements between author’s and coder’s identifications. 79 The outcome of the test (93%) was found to be above Kassarjian’s 79 recommended standard (85%), therefore the assignations in Table 1A were considered reliable.
Formation of the nPLs groups
After the identification of the service capabilities offered by each company, it was necessary to assign the company to an ‘nPL’ group (2PL, 3PL, 4PL). The assignation, as explained previously, was based on the service offering of each PL company. In particular, when analysing the 12 service capabilities, four out of seven groups emerged: (T1), (T1 + T2), (T1 + T3) and (T1 + T2 + T3). This meant that, for example, no firm had its service capabilities only in the T2, T3, or T2+T3 groups. The defined PL groups were found to have two main issues. First, they were fuzzy. Precise boundaries needed to be set to investigate the research hypotheses. In fact, by looking at the service capabilities provided by each firm in Appendix 1, one needs to ask whether firms offering one service in T1 and one in T2 and firms offering three services in T1 and three in T2 should be assigned to the same ‘nPL’ group or to different ones. In other words, the question arises about what should be the number of services per type to belong to a specific ‘nPL’ group. In this study, as suggested by Liu and Lyons, 20 it is established that to belong to one of the four groups (T1; T1 + T2; T1 + T3; and T1 + T2 + T3), a firm must provide at least two service capabilities for each Ti peculiar to that group. For example, a firm offering two T1 services and two T2 services belongs to a group (the T1 + T2 group), whereas a firm providing three T1 services and one T2 service does not.
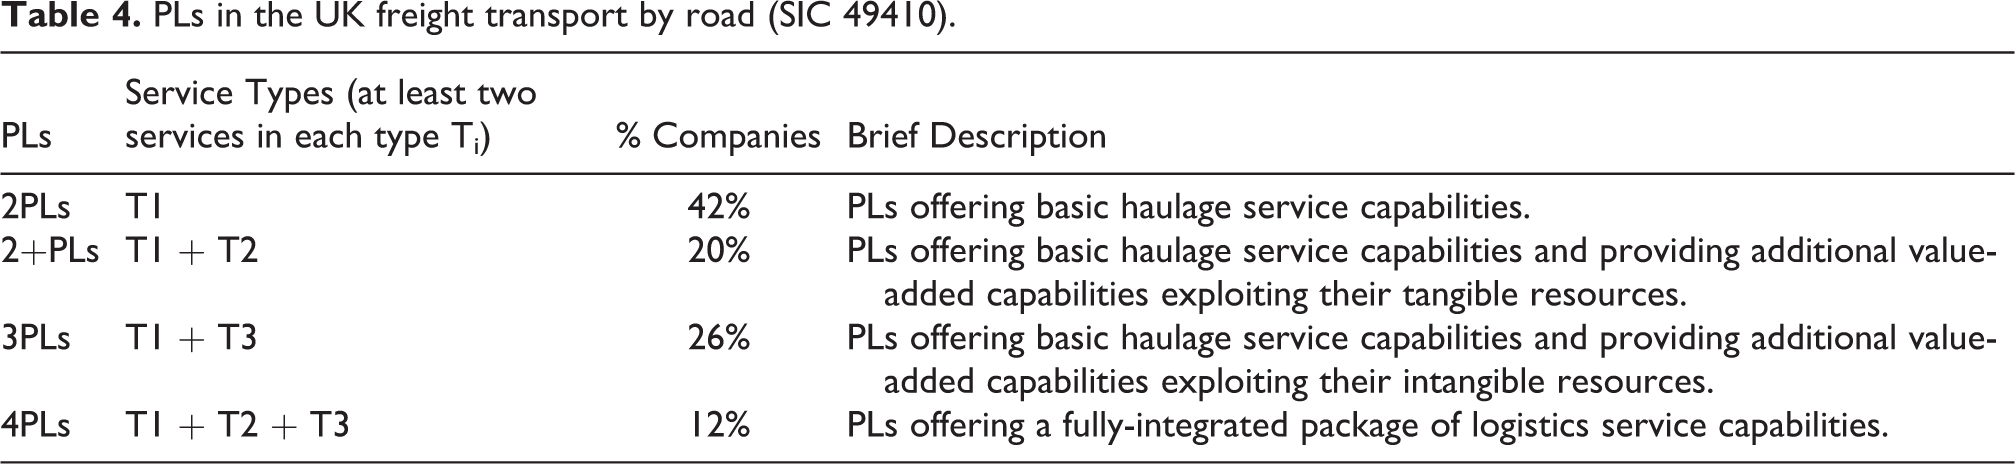
As for the combinations of the service capabilities, as noted, they are four rather than three (the ‘canonical’ 2-3-4PLs). T1 and T1 + T2 could be put together, as firms in both groups are evidently 2PLs. Yet, for the sake of extracting more information, the analysis was performed in two ways: 1) by placing PLs with T1 and T1 + T2 service capabilities in the same group; and 2) by keeping them separate. The first group of firms has been labelled 2PLs, while the second 2+PLs to indicate haulage companies with additional asset intensive services. Table 4 reports the grouping of the PLs in Appendix 1 according to the explained criteria.
PLs in the UK freight transport by road (SIC 49410).
Financial statements analysis
Choice of the indicators
The financial statements indicators in Table 5 are based on the rationale that service capabilities are derived from the process of delivering products in a way that creates added value to customers by means of tangible and intangible resources. 20,42,80,81
EF and NEF indicators.

NEF indicators such as Fixed Assets, Current Assets, etc. have already been used to analyse differences between firms engaging in different businesses. 82,83 They have also been used to investigate the financial statements structure of PLs. 21 On the other hand, the EF indicators have been used by Liu and Lyons 20 and Lai, 24 through primary rather than secondary data, to investigate the relationship between 3PLs with different service capabilities and financial performance. Overall, the indicators represent an agreement based upon choice to examine the financial and non-financial structure of ‘nPLs’.
Kruskal-Wallis and Mann-Whitney tests: Differences between the PLs groups
Appendix 2 reports the first four moments of each indicator’s distribution and the results of the Levene’s test for variance homogeneity. It can be seen that the data did not meet the assumption for parametric tests such as ANOVA and t-tests, a well-known fact for financial statements data. 84 For this reason, Kruskal-Wallis and Mann-Whitney tests have been used to analyse the differences between the financial statements indicators of the various PLs groups. 85 To control for size effects, each indicator has been divided by the firm’s number of employees, or their turnover. Normalization via turnover has been indicated with shaded areas in the table.
Table 6 reports the results of the tests. The first column reports the results of the comparison for each indicator across the four PL groups. The other columns report the results of all the relevant pairwise comparisons for the groups at hand.
Kruskal-Wallis and Mann-Whitney tests.

NB the value in the cell is the p value of the corresponding test. All the values less than or equal to 0.05 are underlined. For the Mann-Whitney tests, an * marks the entries for which the p value is less than the adjusted alpha after the Benjamini-Hochberg correction.
The Kruskal-Wallis tests show that the EF indicators did not change across the various PLs in the same sector (SIC code). Thus, both H1a and H1b failed to be rejected. Accordingly, no PLs group is more profitable (H1a ), not even the ones focusing on knowledge-intensive service capabilities (H1b ). As for the NEF indicators, the differences in Number of Employees, Fixed and Tangible Assets and Stock & W.I.P. did not reach statistical significance. PLs have different sizes in regards to Number of Employees and different amounts of Fixed and Tangible Assets (trucks, storage rooms, etc.) and Stock & W.I.P. For these indicators, it is correct to assume that the different bundles of service capabilities offered by PLs gave rise to a different asset structure.
The pairwise Mann-Whitney tests complemented the Kruskal-Wallis results. Specifically, it is interesting to note that the 2+PLs group, i.e. the 2PLs offering a wide range of asset-intensive services, did not set themselves apart from the 2PLs. On the contrary, they were significantly different from the 3-4PLs. In light of these results, one might question whether the organizational risk and complexity needed to offer additional service capabilities was worth bearing in this case.
Discussion
An analysis of service capabilities in the freight transport by road industry (SIC 49410) was used to gain deeper insights into the study of PL’s strategic behaviour. 14,21,23,38,86 The empirical evidence demonstrates that PLs in the road transport are of four main types, namely 2PLs, 2+PLs, 3PLs, and 4PLs. 2+PLs offer basic haulage services (2PLs) along with additional value-added services that exploit tangible resources. 87 These PLs insource activities that extend the business scope of haulage companies such as truck repair and maintenance. 20,24,88,89 These firms respond to an industry-wide need, e.g. truck maintenance, by developing the capabilities to carry out such activities. These PLs have reacted to the industry concentration process by horizontally integrating their resource-intensive services, rather than vertically integrating as 3-4PLs have done. In this way, 2+PLs are different from both 2PLs and 3-4PLs.
Regarding the relationship between PL groups and economic-financial (EF) indicators, the test of H1a-b demonstrated that firms with different combinations of service capabilities in the same business sector (SIC code 49410) do not show statistically significant differences in the Turnover, Operating Profits, Cash in from Operating Activities, ROCE, and the Credit Score. As for the hypothesis H2 , namely the relationship between PL groups and non-economic/financial (NEF) indicators, it was rejected for the majority of the indicators and failed to be rejected for Number of Employees, Fixed and Tangible Assets, and Stock and W.I.P. The same pattern was observed when the 2PLs and 2+PLs were placed in the same group and contrasted with 3-4PLs.
The results supported other scholar’s claims for specific groups of PLs, such as 3PLs. According to these results, there may not be a direct relationship between the offering of service capabilities and performance. 39 These service capabilities may only have an indirect effect on certain performance indicators. 31
The absence of a direct relationship between service capabilities and financial indicators may seem in contrast with some of the consequences of RBV theory. The market segment within the same industrial sector is the main reason for this outcome 1 . As discussed by Lai 24 for 3PLs and by Chao et al. 90 for airline cargo transport, PLs in the road transport sector target their particular market niche and achieve the same levels of performance irrespective of the particular niche exploited within the same business (same SIC code). Thus, RBV applies to the market niche, not to the whole sector.
The results found by Hofmann and Lampe 21 were also useful when discussing the present findings. Hofmann and Lampe 21 have shown that PLs with different SIC codes (e.g., sea-freight and parcel delivery) have equal profitability and different asset structure (namely different values in the indicators labelled in this study as NEF). The present study has demonstrated that the same relationship is valid for different PLs with the same SIC code (49410). This means that the asset structure among different PLs varies, although their ‘business’ in statistical terms – the SIC code – is the same. Therefore, in this case it is possible to conclude that the asset structure is a good predictor of PL’s service scope. Furthermore, the results have extended studies on the strategic group analysis of PLs’ that were undertaken by Lirn, Shang, and Lu 38 and by Liu and Lyons. 20 Differently from the latter studies, the focus of this research is on PLs with the same SIC code, and the use of financial statements data to draw inferences. The results have shown that PLs with the same SIC code are homogeneous in terms of performance. Because the SIC code is the same, the differences between the PLs’ service capabilities can be attributed to different service strategies in the same business. Thus, the results have shown that key performance indicators in the same SIC code did not vary across various strategic groups. In other words, the market niches within the same SIC code have the same profitability.
Implications and limitations
An analysis of the relationship between service capability bundles and financial statements indicators is essential for management. 28 This research has provided deeper insights into the ‘black box’ of resource and capability configuration through an empirical appraisal of capability bundling in road transport firms. 1,28,49 This study confirms the existence of various strategic groups within a circumscribed industrial sector, as pointed out by RBV theory 1,91 and as empirically derived by various scholars. 23,38
This analysis is appealing because the SIC classification, as well as other similar ones (e.g., NACE rev. 2), are used by governments, institutions, and trade associations to collect statistics on industries. Knowing the stratification within a particular SIC code adds a layer to those statistics and can be a useful approach to get more insights on specific sectors. In addition, the results have shown that economic-financial indicators are constant for this particular SIC code. Turnover, Operating Profits, Cash-in from Operating Activities, and ROCE did not show statistically significant variations for a sample of companies in the 49410 SIC code. Thus, managers can use these indicators as a benchmark to their firm’s performance. This is useful because financial data grouped by the SIC code are easily available, enabling managers to use this data as lagging indicators for their strategic decisions. Further research might investigate whether this pattern is common for other SIC codes that are relevant to PLs.
Finally, this research has developed a heuristic approach to identify and classify service capabilities starting from open secondary data, which can be replicated in other business sectors. 11 This heuristic study supports managers in identifying capabilities both in their firms and in their competitors. 23,38,92,93 This ability is fundamental for managers who must set strategies in a rapidly changing environment. 22,94 –97
This study has limitations too, which can also be regarded as opportunities for future research. Firstly, the study is based on a single country. On the one hand, this is an advantage for a ceteris paribus analysis. On the other hand, it may fail to account for idiosyncratic factors of the chosen country. Future research can be devoted to investigating whether the results in this paper apply elsewhere. Secondly, the study is cross-sectional. The effects, which were found to be statistically non-significant in a 1-year period, might become significant over a longer time span. That is, companies that have specific capabilities might show a competitive advantage over a longer time span. Thirdly, the study infers the presence of certain service capabilities by analysing the firms’ websites; it does not verify their possession and exploitation. Other methodologies, such as case studies, are required to investigate issues related to the possession and exploitation of service capabilities, thus extending the results of the present analysis. Using a different scale (e.g., a 0–5 scale) would serve the same purpose and represents another route for future research. 98
Footnotes
Data availability statement
The firms’ capabilities have been derived from public domain resources (firms’ websites). The financial statements data are available in anonymized form from the corresponding author, L.T., upon reasonable request.
Declaration of conflicting interests
The author(s) declared no potential conflicts of interest with respect to the research, authorship, and/or publication of this article.
Funding
The author(s) received no financial support for the research, authorship, and/or publication of this article.