
Abstract
The impact of Lean Manufacturing (LM) implementation on organizational performance is an ongoing discussion. The effect of implementing LM tools on operational performance across various industries in Zimbabwe, a country with an unstable real gross domestic product is evaluated. A structural model of LM that is aligned with the Toyota Production System (TPS) house was proposed. A structured survey questionnaire was used for the collection of data in identified companies. Of the 600 companies contacted, 214 useful responses were obtained implying a response rate of 35.6%. The structural and operational models were tested using the Statistical Package for Social Sciences and SmartPLS 3. The result indicated that operational performance was improved by implementing the selected LM tools.
Keywords
Introduction
Lean Manufacturing (LM) is a philosophy that has been used by companies to increase competitiveness and organizational performance. It was initially embraced by the manufacturing sector, however, it has been adopted by the service industries such as education Delago, Machado, 1 healthcare, 2 –4 hotel and tourism 5,6 as well as transport. 7
The manufacturing sector in Zimbabwe has been struggling in their operations since the introduction of the multicurrency system in February 2009. 8 This is because the sector is characterized by inadequate funding to improve on its machinery and technology, 9 and as a result, the growth in real Gross Domestic Product (GDP) has not been stable. For instance, the real GDP increased from 5.4% in 2009 to 16.3% in 2011, fell to 0.6% in 2016 and then increased to 3.7% in 2017. 10 In this environment, companies that successfully implement LM may survive such turbulence better than others. However, the real GDP at constant factor prices for the industry sector improved from negative 0.1% in 2015 to positive 3.7% in 2018 11 because companies have been taking advantage of the import management program that controls the importation of products to increase capacity utilization. 10 Despite the growth of the real GDP at constant factor prices, the industrial sector has also been threatened by imports from South Africa and China which accounted for 2.21 billion USD and 380 million USD, respectively. 12 This has led companies in Zimbabwe to implement LM so as to eliminate waste and improve the quality of their products. 13
LM philosophy has emerged as a powerful approach that has been used by companies in developing countries to improve their operations. Developing countries such as India, 14 –16 Kuwait, 17 Malaysia, 18 Turkey, 19 Brazil, 20,21 Thailand, 22 Sri Lanka 23 and Indonesia 24,25 have adopted the philosophy to reduce manufacturing costs so that their products remain highly competitive. In Southern Africa, the effect of LM on operational performance is still under-researched. Studies on the application of LM in these countries include South Africa, 26 –28 Botswana, 29 Namibia 30 –32 and Zambia 33 –35 In Zimbabwe, cases of implementation of LM tools and the impact on individual company performance have been reported. Such companies are found in margarine production, 36 bakery, 13 tile company, 37 furniture company, 38 plastic manufacturing, 39 foundry, 40 pharmaceutical company, 41 service industry, 42 battery manufacturing 43 and clothing. 44 This shows that research has been done on implementing LM in Zimbabwe, but the reports have been incoherent, making it difficult to understand how the concept has made an impact on industry-wide operational performance.
Some studies focused on the synergistic results obtained from implementing Lean tools on operational performance. For instance, value stream mapping was used by Goriwondo et al., 13 Muvunzi et al. 37 and Dzanya and Mukada. 39 However, Furlan et al. 45 and Schroeder and Flynn 46 state that greater operational efficiency can be obtained when the Lean bundles are implemented simultaneously due to the synergistic effect of various Lean tools. To the best of the author’s knowledge, no research has been conducted to show the impact of LM on operational performance across diverse industries in Zimbabwe. This research, therefore, seeks to evaluate the impact of LM on operational performance across Zimbabwean companies.
This article is organized into six sections: the first section is the introduction and a discussion of the problem of interest; the second section gives a literature review of the studies of companies that have implemented LM; the third section is the methodology and describes how the structural model was built. In the fourth section, the results are given; the fifth section gives the discussion of the results, and the article concludes with areas of possible extensions in the sixth section.
Literature review
Historical development of Lean production
The term LM was initially introduced by Krafcik in 1988 and was further made popular by Womack in the book, The Machine That Changed the World, 47 The term was used to compare the Japanese Toyota Production System (TPS) with mass production that was being implemented in the Western economies. After World War II, there was tremendous pressure on material resources and Toyota was not spared. 48 The company was faced with many labour strikes, recorded a pre-tax loss and was on the verge of bankruptcy in 1950. 49 This led Taiichi Ohno to introduce the concept of TPS to eliminate waste within the engine machining shop. 50 As a result, the TPS house has become a well-referenced icon in most industries in the world. 51
LM fundamental principles
LM is built around five basic principles which are value creation, value stream identification, uninterrupted flow, pull production and perfection. Table 1 gives a detailed description of the five lean principles.
LM principles.
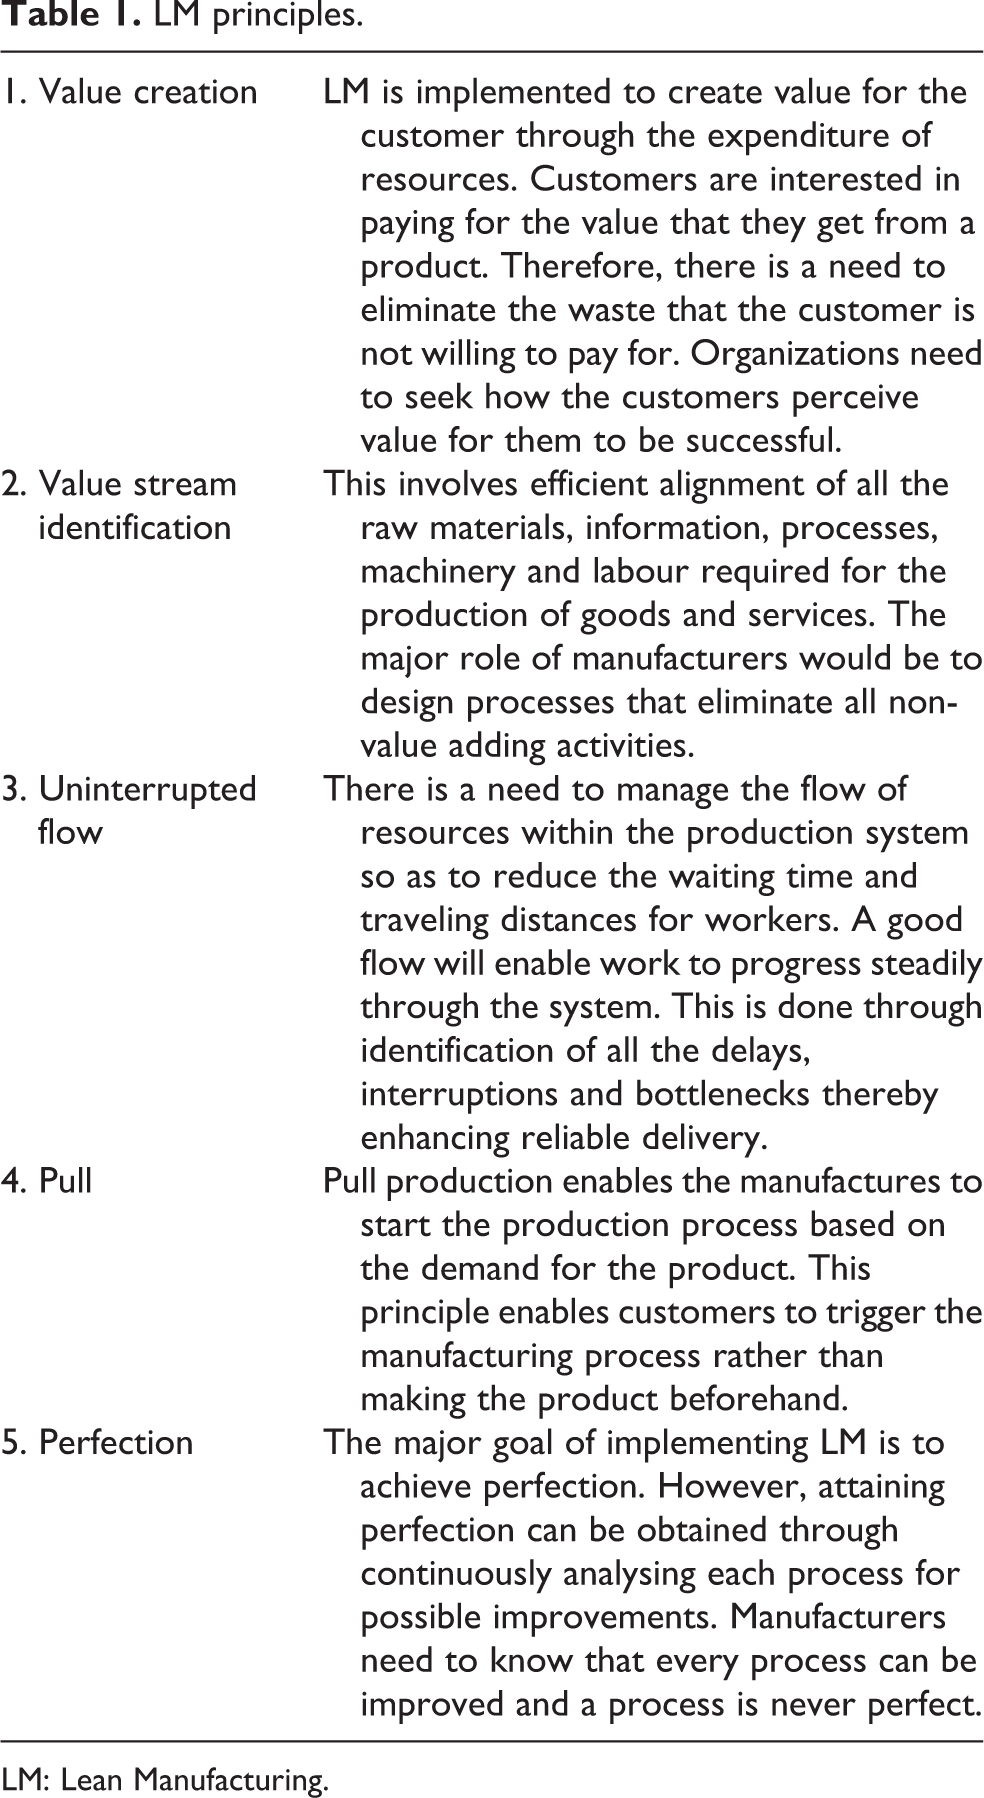
LM: Lean Manufacturing.
Studies of companies that have implemented LM around the world
Kojima and Kaplinsky 27 assessed the performance of auto companies in South Africa using Lean Production Index (LPI). The LPI is composed of three elements which are quality, flexibility and continuous improvement. The results indicated that the value of LPI depended on factors such as ownership, access to foreign technology and human resources development. However, buyers and the size of the firm had no impact on LPI. Mapfaira et al. 29 studied the level of LM adoption in manufacturing companies in Botswana. Coping with change and the lower level of skilled personnel emerged as the major drawbacks in successful LM implementation.
Dal Pont et al. 52 evaluated the impact of total quality management (TQM), just in time (JIT) and human resource management (HRM) practice bundles on operational performance in the high-performance manufacturing international project in 266 companies from countries such as the United States, Spain, Japan, Germany, Sweden, Korea, Italy, Austria and Finland. The results indicated that TQM and JIT had a direct and positive influence on organizational performance and HRM affected performance through the mediating effect of TQM and JIT.
Marodin et al. 53 analysed the impact TPM, TQM and JIT have on organizational performances in 64 Brazilian firms. The study concluded that the TQM construct had no influence on operational performance measures. The JIT construct showed a high impact on inventory turnover, while TPM had a positive impact on lead time. Fullerton et al. 54 studied the correlation between financial performance and the degree of JIT practices adoption in 253 manufacturing firms in the United States. The results suggested that companies that implemented JIT practices extensively realized more profits than those that implemented it less extensively.
Numerous researchers, to name a few, Furlan et al., 45 Al-Tahat and Jalham, 55 Agus et al., 56 Hofer et al., 57 Rahman et al. 58 and Vinodh and Joy, 59 also studied the impact of implementing LM on operational performance.
Lean practices used for implementing LM in Zimbabwe
To the best of the author’s knowledge, there is no measurement instrument that has been developed for assessing LM in Zimbabwe. A literature study conducted by Maware and Adetunji 60 showed that three constructs – JIT, TQM and HRM – were mainly used by researchers to develop qualitative measurement models. They found that these constructs correlated with bundles in the TPS house which are Flow, Jidoka and People integration. While it is generally difficult to select a popular structural model for Lean as a consensus from academic publications, the structural model by Dennis, 61 reproduced in Figure 1, has been adopted for implementing LM by many companies in Zimbabwe. It indicates the five key constructs around which all the Lean activities and tools are built: customer focus/value creation, JIT/flow kaizen, Jidoka/process kaizen, people involvement/integration (internal and external), and standardization and stability foundations.
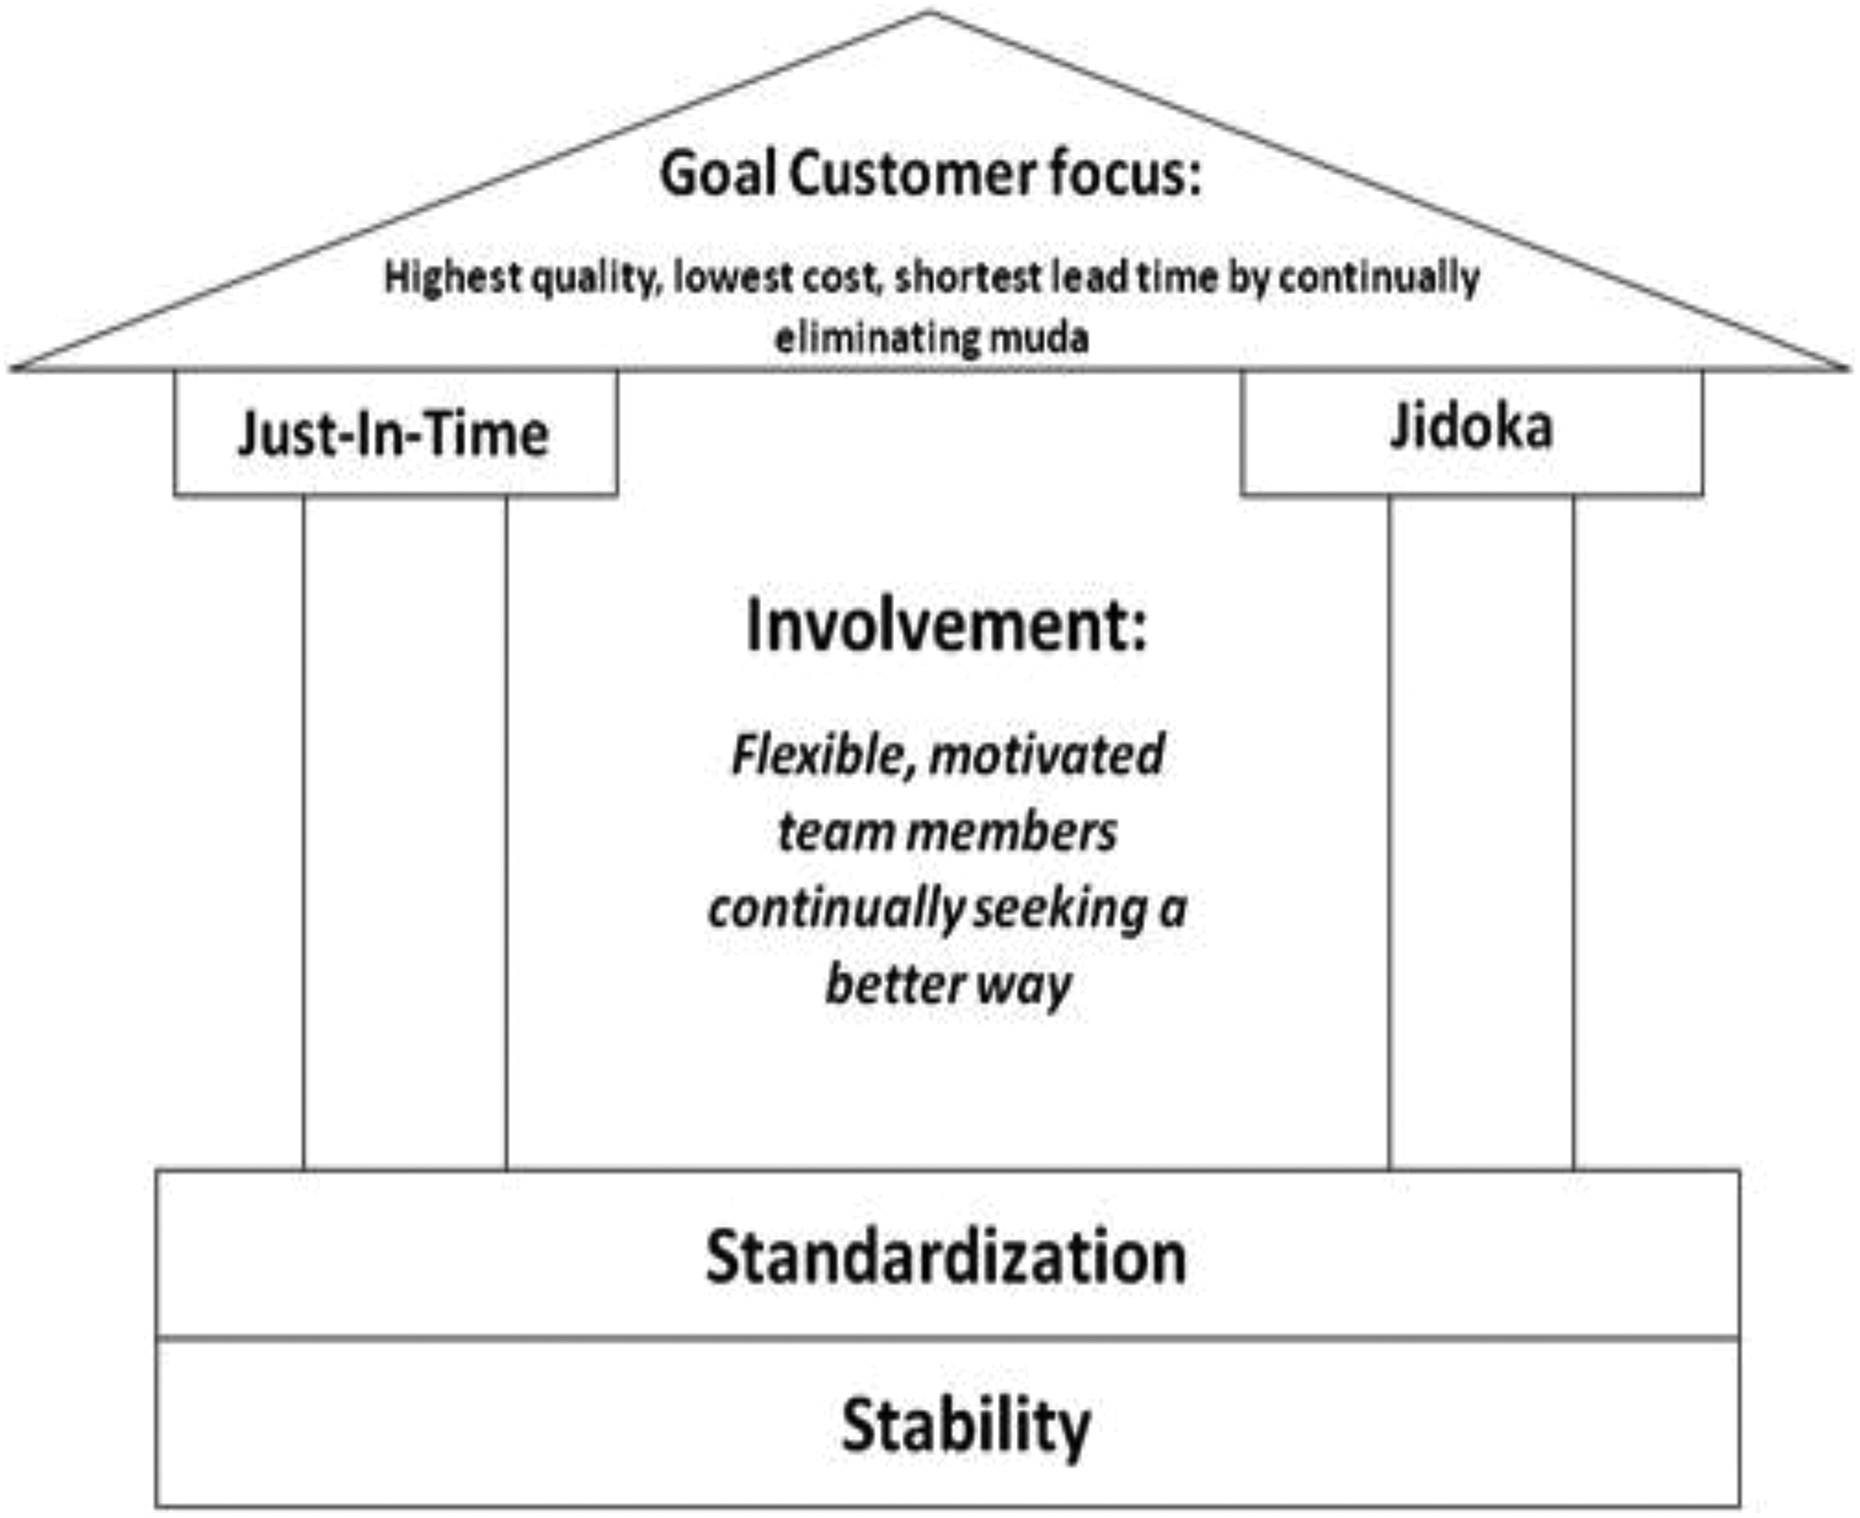
TPS house adopted from Dennis. 61 TPS: Toyota Production System.
The TPS house seeks to improve the stability of the manufacturing systems and the company’s competitive advantage through satisfying customers. The foundation consists of stability and standardization. Stability allows the pillars (JIT and Jidoka) to be built, 51 while standardization enables predictable and stable results. Veech 62 refers to the Jidoka and JIT pillars as the stop and go columns, respectively. This is because JIT allows the system to flow with minimum inventory, and Jidoka enables the system to stop when any abnormality has been discovered. Jidoka also reduces quality defects thus enabling a complete working system. 63 People integration forms the heart of the house and the workforce must be flexible and continually seek for improvement. The roof of the house gives the ultimate goal of LM which is achieving the shortest lead time, lowest cost and best quality.
Measurement models found in literature and practice
The Lean models have focused on either lumping a number of Lean techniques into the same aggregate constructs or applying them individually. When lumped together, they are referred to as bundles, constructs, factors, latent structures and dimensions. 52,55,64,65 When used individually, they are referred to as tools, practices, techniques, strategies, methods and elements. 63,66 –68 The massive proliferation of Lean models has made the navigation of this domain quite difficult. Many authors have attempted to create models out of this massive pandemonium, but their structures are principally different from one another. It is, therefore, difficult to simply adopt a model from the literature as the acceptable Lean structural model since diverse models have been built by authors. This research will consider the use of Lean bundles in developing a structural equation model.
Overview of structural equation modelling (SEM)
SEM can be defined as a technique that allows models of linear relationships to be specified and estimated. 69 The two parts for SEM models are the measurement component and structural component. The structural model shows the casual connection between latent variables. 70 The measurement model is composed of latent variable and their indicator variables. SEM allows researchers to use latent variables to perform path analytic modelling 71 and can validate relationships between measured variables and latent variables.
SEM has been named the second generation of multivariate analysis tools. 72 It allows confirmatory and exploratory modelling to be performed. SEM gives a set of relationships that are reliable and valid providing a comprehensive explanation of the real scenario 59 ; hence, it is well suited for both theory confirmation and theory development. The hypothesis of the model constructed can be assessed against empirical data to show how well it fits the data. To perform SEM analysis, the researcher starts by formulating a theoretical model followed by model specification, parameter specification and fit evaluation. 73
The proposed structural model of LM implementation
SEM has been found to be well suited for addressing numerous problems in LM research. It is one of the most preferred methods used for data analysis by operations researchers. 74 Chin and Newsted 75 cited that the major benefit of using SEM is its flexibility that allows researchers to test relationships among multiple independent and dependent variables. SEM also allows correlation among measurement errors and test theoretical and measurement assumption against empirical data. It has also been shown that SEM allows a single analysis to estimate multiple and interrelated depended variables. 59 A complex system can also be studied allowing casual relationships among latent variables to be explored. This study generally seeks a recursive model.
This section presents the latent variables and hypothesize relationships between them. The TPS house contains constructs, namely stability and standardization, JIT, People integration and Jidoka. Generally, the study seeks to solve a recursive model. The success of LM relies on worker involvement, empowerment and team effort, which are all HRM practices. People integration incorporates a system created to empower employees to continuously improve organizational tasks so as to enhance the efficiency and effectiveness of the company. Employees are responsible for performing the work and implementing changes caused by LM.
76
They also manage their own processes and solve problems as they arise in the system. Studies by Fullerton et al.
54
and Dal Pont et al.
52
showed that the workforce that is flexible and works in teams make a great commitment to JIT and thus, People integration affects JIT. HRM practices such as employee retention, staffing, compensation, training and development also enhance a defect-free process. Researchers such as Dal Pont et al.,
52
Chandler and McEvoy
77
and Yang
78
found a direct and positive impact of HRM on TQM. It is therefore hypothesized that:
Stability and standardization can be defined as the state of the system being able to consistently provide items uniformly with little variations such as demand fluctuation, machine breakdown, human failure and balancing product varieties. Stability and standardization help to reduce interrupted flows because orders are received on time, machines are operated as planned and work standards are followed. The major aim of standardization is to create standards in work methods and processes.
79
It is also easier to assess the source of the problem when the processes are standardized. The level of LM success will be reduced when stability is not implemented.
80
Stability and standardization also allow processes to be done in the correct way each time thus ensuring quality products and services are produced. Therefore, the following hypotheses are proposed:
A study by Flynn et al.
81
asserted that JIT performance increased using quality management practices. Similarly, Kannan and Tan
82
showed that TQM practices had a strong relationship with JIT. Other research studies have also explored the effect of JIT and TQM on firm performance. Shah and Ward,
83
Chenhall,
84
Talib et al.,
85
Mann and Kehoe,
86
Sadikoglu and Olcay
87
and Fullerton et al.
54
showed that higher financial returns were obtained when a company invests in quality practices. Rahman et al.
58
showed that JIT and flow had a positive relationship with operational performance in small and medium enterprises and large enterprise companies in Thai. Callen et al.
88
studied Canadian companies and found that implementation of JIT led to lower variable costs, higher contribution margins and profit. Fullerton et al.
54
also state that Kanban and JIT purchasing results in increased marginal returns. Therefore, it is hypothesized that:
Figure 2 shows the LM structural model developed for evaluating the impact of Lean tools on operational performance.

Lean measurement structural model.
Research methodology
Instrument development
A questionnaire was developed for the model to measure the impact of LM constructs on operational performance. The questionnaire was divided into three sections: Section A contained information about the company. Section B was dedicated to questions on the level of adoption of LM constructs in companies. Section C was comprised of questions about the operational performance of the company. The questions were adopted from authors such as Abdallah and Phan, 89 Cua et al., 90 Khanchanapong et al. 22 and Shah and Ward, 91 Dal Pont et al., 52 Wickramasinghe and Wickramasinghe, 92 Dora et al. 93 and Garza-Reyes et al. 19 These were measured on a 7-point quantitative scale, with 1 = strongly disagree; 2 = disagree; 3 = disagree somewhat; 4 = undecided; 5 = agree somewhat; 6 = agree and 7 = strongly agree. Operational performance was evaluated using items from Belekoukias et al. 63 and Shah and Ward 83 which were speed, flexibility and dependability. A 5-point scale was used for measuring operational performance, with 1 representing declined more than 20%; 2, declined 1–20%; 3, stayed the same; 4, increased 1–20% and 5, increased more than 20%. A pilot study was done to receive ideas from industry practitioners and academics about the questionnaire. Some items were discarded, modified or added to ensure reliability and construct validity. The items questionnaire developed is shown in Appendix 1.
Data collection procedure
Six hundred manufacturing organizations registered with the Confederation of Zimbabwean Industries 9 were contacted to respond to the questionnaire. These companies fell under the plastics, agrochemicals, pharmaceutical, motor, food, steel, beverage, timber, garment, battery, electrical and electronics manufacturing companies. Three hundred questionnaires were distributed by hand, while other companies were reached by sending a Google form link via email. A total of 214 useful and complete responses were received resulting in a response rate of 35.6%. Table 2 lists the distributions of the responses across different industries obtained by the researchers.
Industry distributions.

Data analysis
Data analysis was done using Statistical Package for Social Sciences (SPSS) version 25 and SmartPLS 3. SPSS was used for exploratory factor analysis. SmartPLS 3 was used for assessing the measurement and structural model. Assessing the measurement model involves evaluating the relationship between LM constructs and their measurement items, while assessing the structural model determines the correlation between the constructs. 94
Assessing the measurement model
Adopting the measurement items from previously published articles ensured high reliability of the questionnaire (Godinho Filho et al., 20 Dora et al. 95 and Shah and Ward 91 ). A total of 49 items were initially selected for measuring the five LM constructs. Exploratory factor analysis was used to minimize the number of items for individual constructs and to assess construct validity, thus ensuring a parsimonious representation for the five latent factors: JIT, Jidoka, People integration, stability and standardization and operational performance. Nineteen items were finally selected for the constructs after the preliminary analysis. A Kaiser–Meyer–Olkin value of 0.866 was obtained indicating that the sample size of 214 was adequate. The Bartlett’s test of sphericity was significant with a p value <0.001. Using the factors with the eigenvalue >1 and the shape of the Scree plot to determine the underlying constructs, the analysis confirmed the five-factor structure with a variance of 61.770% explainable by the model.
Cronbach’s α was used for assessing internal reliability and consistency of the constructs. The results for each construct were in the range of 0.651–0.877 and were regarded as acceptable to high (Bevilacqua et al., 96 Götz et al. 97 and Malhotra. 98 The average variance extracted (AVE) should be >0.5 to ensure construct validity (Silva et al. 99 and Avkiran 100 ). The AVE values were >0.5, denoting that the factors constituted more than half of the variance explained by the model. The values for composite reliability shown in Table 3 were all >0.7, indicating that the constructs had high internal consistency.
Construct reliability and validity.

JIT: just in time.
The results of the Fornell–Larcker criterion shown in Table 4 indicated that measurement items were highly loaded to their respective constructs thus supporting discriminant validity. Moori et al. 101 state that discriminant validity is ensured when the AVE values are greater than the correlation among the factors.
Fornell–Larcker criterion.

JIT: just in time.
Assessing the structural model
The R 2 values for the endogenous variables ranged from 0.317 to 0.680. 102 state that when the R 2 values are equal to 0.26 they are considered substantial, 0.13 moderate and weak if the values are 0.02. Moori et al. 101 also cite Cohen 102 who states that for behavioural studies, 0.26 is considered a large effect. The coefficient of determination (R 2) for Jidoka, JIT, operational performance and stability and standardization were 64.3%, 68.0%, 31.7% and 42.8%, respectively. This showed that JIT, Jidoka and People integration had a good influence on operational performance. Figure 3 illustrates the SEM model showing the structural linkage between People integration, stability and standardization, JIT, Jidoka and operational performance.
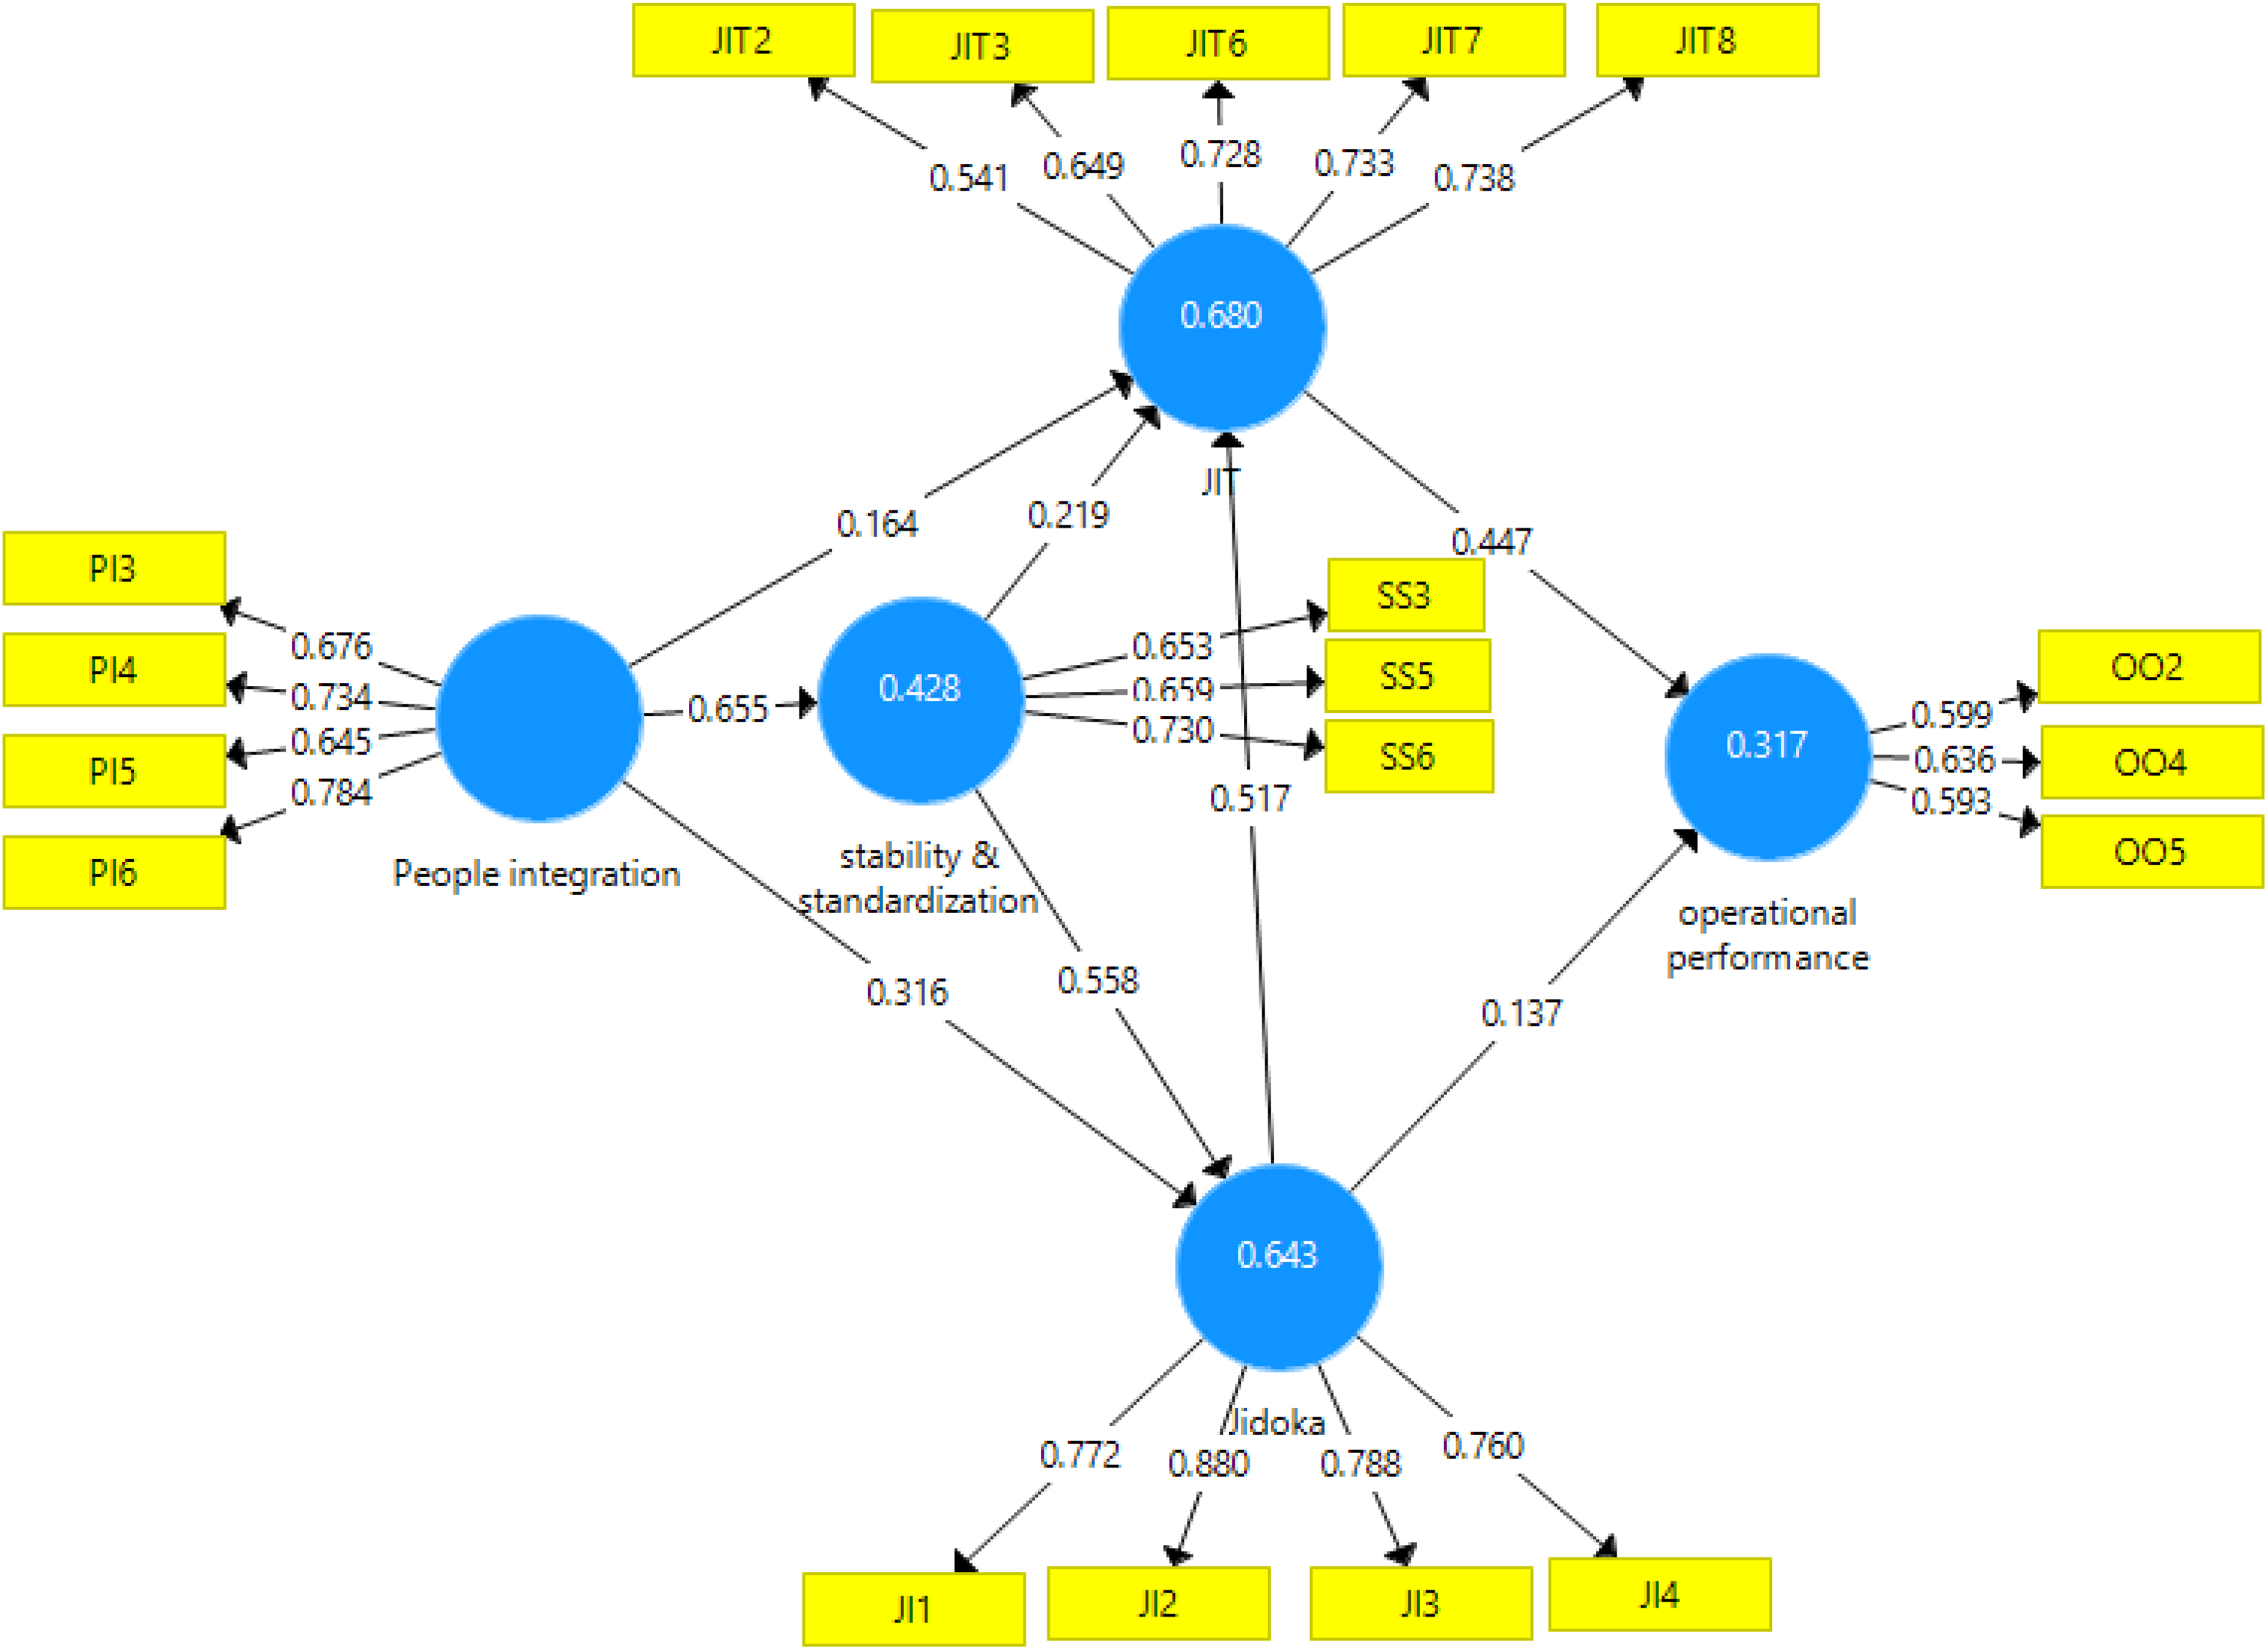
SEM model. SEM: structural equation modelling.
People integration had a strong relationship with stability and standardization than with JIT and Jidoka as shown by their structural coefficients which were 0.655, 0.249 and 0.301, respectively. Stability and standardization had a strong relationship with Jidoka than with JIT. The Jidoka construct had a strong relationship with JIT, and this is shown by a high path coefficient of 0.517. The results for total effects showed that people integration has a strong total effect on operational performance (0.374), followed by JIT (0.358), stability and standardization (0.333) and Jidoka (0.223). The results also support other findings from authors. 45,52,53,56 –58,63,68,92,103 –105
The t-statistic and the p values in Table 5 fail to reject any of the hypotheses. This indicates that all the hypotheses were supported, and the model could be used for evaluating the impact of implementing LM on operational performance.
T-values, P-values, standard deviation and decision for the hypotheses.

JIT: just in time.
Discussion
The main objective of the study was to evaluate the impact of implementing LM tools such as People integration, stability and standardization, JIT and Jidoka on operational performance in companies across Zimbabwe. The results supported all the hypotheses that were developed showing that the LM tools can enhance operational performance. Several studies conducted in developing countries have shown that LM tools adoption results in the improvement of operational performance. Researchers such as Eswaramoorthi et al., 15 Khanchanapong et al., 22 Nawanir et al. 24 and Marodin et al. 53 have shown that the adoption of LM has given manufacturing companies a competitive edge through yielding positive results. Shrafat and Ismail 106 concluded that limited research has been conducted on LM in developing countries. Marodin et al. 53 stated that developed countries often face difficulties to become Lean due to the changes in the market orientation. This study therefore, adds to the current discussion of the impact of LM in developing economies.
It has been said that people are the backbone for successful implementation of LM. 61 The results indicated that there was a need to educate employees on the importance of implementing LM since every system is managed and driven by people. This suggests that managers should invest in training employees so that they can drive the LM implementation program. People integration had a positive relationship with JIT and Jidoka indicating that workers strived to enhance the flow of materials and quality of items produced. Stability and standardization also had a huge impact on JIT than Jidoka. A stable and standardized system increases the speed of manufacturing because the flow of materials is less interrupted across the production floor. Standardization also helps to set quality criteria for different operations along the value chain. Jidoka and JIT had positive relationships with operational performance. This is because when high quality materials and products flow through the system, operational performance is enhanced. The performance improvement variables that were greatly influenced were speed, flexibility and dependability. The path coefficients on operational performance showed that flexibility had the greatest contribution to LM, followed by speed and dependability.
The major strength of LM implementation in Zimbabwe is that the employees got motivated about the program which made them to be dedicated and hardworking. This management practice has also helped many companies to move forward in continuous improvement of their systems. It was observed that the weakness of LM was that the project was competing for resources with other management programs that were initiated by organizations. The opportunities were that organizations were made to be more competitive since they were able to set and follow standards for their processes once they applied the stability and standardization practice. There was improvement in the quality of products, designs, flow and communication. The implementation of LM also created fear among the workers for job losses through retrenchment, however, the management reassured them that some would be redeployed to other areas.
Conclusion
The study demonstrated that implementing LM tools results in increase in operational performance variables such as speed, flexibility and dependability. Empirical validation of the structural model was done among 214 companies in Zimbabwe. The study showed that the operational performance construct was influenced by the four constructs in the TPS house.
People integration acted as a prerequisite upon which other constructs were built. People have been described by Dennis 107 as the wind that drives the Lean sail. People management is important for ensuring the pillars (flow and Jidoka) and foundation (stability and standardization) of LM are achievable. The purpose of stability and standardization is to create an environment in which LM can be applied. 107 When variability is too high in the Lean system, getting results from implementing Lean becomes difficult. Hence, the extent to which the various functional areas, as well as products of the system are standardized leads to successful implementation of LM.
JIT enables the continuous flow of items and materials through the system with a minimum in process inventory. The level and extent of uninterrupted flow of materials through a system is a key characteristic of a Lean system. Jidoka will help to eliminate defects within a production system. It ensures that quality is maintained in all stages of product design, development and production. This in turn, increases the operational performance of organizations. The results also showed that LM can also be successful in an unstable economic environment such as in Zimbabwe. The major limitations of the study were that more companies could have been used for evaluating the model and the model could also be tested in other developing countries in Southern Africa.
Footnotes
Declaration of Conflicting Interests
The author(s) declared no potential conflicts of interest with respect to the research, authorship, and/or publication of this article.
Funding
The author(s) disclosed receipt of the following financial support for the research, authorship and/or publication of this article: This study is part of the research being conducted towards achieving a PhD. The authors would like acknowledge the support received from Organization for Women in Science for the Developing World (OWSD) and Swedish International Development Cooperation Agency (SIDA).