
Abstract
The purpose of this research work is to illustrate that using the logic of theory of constraints (TOC) concerning the Throughput is adequate in management decisions to improve performance in the context of small and medium enterprises. The TOC approach assumes the use of Throughput as an indicator of performance, and in this paper the method of chain substitution and successive approximation is proposed to analyze this indicator. After the implementation of the Throughput per hour analysis, the owner-manager changed her perspective about what her priorities should be in the exercise of the administrative process. The identification of the restriction of what prevented him from obtaining more money allowed him to make the decisions or courses of action that maximized the Throughput per hour, thus improving his performance as owner-manager, the performance of his enterprise and the economic situation of his employees. The originality of this article consists in the application of TOC approach through the design of the indicator Throughput per hour to analyse the performance of an entrepreneur and the application of the chain substitution and successive approximation method for the study of the restrictions that inhibit it.
Keywords
Introduction
The most important decisions concerning innovation, facing competence and reach customer expectations force owner-managers to use indicators to know where to act to have the desired effect while managing their enterprises. 1 –4 Owner-managers who intent to use indicators as management tools have to look to the most depressed components of them to frame their management strategy and improve the performance of their enterprises. 4,5
To be effective, indicators should allow monitoring the performance, identify poor performance and must reflect strategic priorities of the enterprise and the improvement potential. 3 –5 Future actions of owner-manager ought to be evident based on the indicator they use and the components that affect it strongly. Indicators should guide owner-manager’s behaviour in order to make the necessary changes that will allow the organization survival.
Recent literature highlights the important contribution that medium and small enterprises can make to strengthen the overall performance of an economy. The contribution of the sector of small and medium enterprises (SME) to the economy of a country could, in principle, improve by increasing its internal efficiency. In Latin America, SMEs represent 99% of all non-financial companies and generate jobs for approximately 70% of the total workforce. 6 This type of companies are a source of innovation, important contributors to production and an alternative for generating income for the population. 6 –8 For this reason, economic relevance is not the only parameter to measure the importance of SMEs, it is also necessary to consider the social role they play as they serve as shock absorbers for unemployment in the region. 9 The foregoing indicates that the SMEs should sustain the contribution they make to the economies of their countries with superior performance. For all the above, it is becoming increasingly necessary to generate mechanisms that allow measuring the performance of this type of economic entities since, as has been demonstrated, they have a great economic and social importance constituting a predominant sector in Latin American economies.
There is a wide variety of indicators to analyse the performance of an enterprise and guide the behaviour of the administration for improvement 2,5,10 but in general SMEs lack sufficient personnel and knowledge to manage many of them. In order to reduce owner-manager diversity concerning quantity of indicator, in this article the authors will assume a theory of constraints (TOC) approach because this theory enhances business performance in terms of reduced inventory, improved lead time and cycle time, which consequently increases financial performance 11 –13 and because the vast majority of the published applications of TOC have not occurred in underdeveloped countries, particularly in Latin America.
TOC holds that the economic objective of a company can be measured through three variables: Throughput, investment and operating expenses. 14 –17 In this article, the object of attention will be focused on the Throughput that, following the aforementioned author, is related to the speed of generation of resources of the company through sales. 18 –20 Throughput is a simple measurement that allows owner-managers to determine if their actions and decisions are getting it closer to the goal of their enterprises in financial terms. 12,13,16,17,21 –24
The purpose of this research work is to illustrate that using the logic of TOC concerning the Throughput is adequate in management decisions to improve performance in the context of SMEs. Most of the time, many owner-managers of SMEs do not know how (1) their decisions are essential contributions to their enterprises, (2) subordinates contribute to the enterprises and (3) their way to manage results in conflicting policies or conflicts in resource allocation. 18 The aforementioned makes necessary the existence of an indicator that guides the behaviour of owner-managers. In the opinion of the authors, the Throughput can be this indicator that, analysing its components, allows to make accurate decisions in order to improve it and as a consequence, achieve the improvement of the organization.
TOC postulates that improving the Throughput by identifying its constraint(s) and implementing actions to eradicate or eliminate them lead to improved performance. 15,17,22 Owner-managers should focus on increasing performance, for which it is necessary to design performance measurement systems that allow decision-making and maximization of performance through the administration of constrains that limit their growth. 12 The purpose of this research work is to illustrate that using the logic of TOC concerning the Throughput is adequate in management decisions to improve performance in the context of SME. This article presents the basis for designing Throughput and a method to its analysis in order to effectively measure performance. Throughput is applied in the case of an artisanal production process with the purpose of improving it by identifying constraints to systematically achieve a better performance.
The main contribution of this article is presenting the theoretical and methodological basis for using a Throughput indicator, in a particular context, and a method to its analysis in order to effectively measure performance. The suggested method offers the possibility to disaggregate and reassemble indicator-designed components, creating enormous opportunities for owner-managers to manage their entrepreneurship. 4 The power to mix, combine, analyse and prioritize the components of the indicators can be particularly valuable to be able to act and influence the totality from which they come. 4 The method of chain substitution and successive approximation 25 –27 allows owner-managers to manage more effectively because they can see the positive or negative impact of the components on the Throughput indicator that integrate them and identify the constraints that prevent its improvement to systematically achieve a better performance of their enterprises.
This article is structured as follows: In the second section, we review the theoretical postulates of TOC, Throughput and method of chain substitution and successive approximation. A description of method of research follows in the third section. The operational functioning of the method of substitution and successive approximation is described, the operationalization of the Throughput in the practical object where the investigation is carried out. After this, the fourth and fifth sections show the results of the investigation and discuss over it. Conclusions and additional possibilities for further research are being suggested in the sixth section.
Literature review
Developing indicators represents an important tool for ensuring that desired performance is met. For this purpose, the design of indicators is required, not only to analyse how well it is fulfilling the planned objective, but also to identify the cause that limits it in order to make decisions for its improvement. 1 –3,28 These decisions in search of improvement require that the owner-managers understand the interdependencies between the components of an indicator and the final result that is expected. These interdependencies will allow to identify constraints and make realistic estimations of their impacts over the indicator as a whole. 3,10
The interactions established and the limitations identified are the bases for decision-making in order to improve the indicators as useful tools that help to study and, therefore, increase the performance of a company above the desired level. Using indicators facilitates the possibility to discover and understand the existing constraints and the opportunity to take exact steps towards elimination of them. 2,3
For SME, there is a persistent need of continuity of growth, organizational regeneration, adaptation and risk-taking activities that in many cases go beyond the owner-manager’s capabilities. 29 SMEs management is generally a task of owner-managers and, in the best of cases, few people involve in the decision-making process. 29,30 That is why it is very important to create a mechanism that provides them flexibility and quick reaction time, eliminating those constraints that restrict their performance. Owner-managers are dealing with different indicators that could help to focus on the improvement of their enterprise’s performance and management processes. 2,4 There are a variety of indicators, little is the time to analyse them all and low are the methodological and educational capacities to do so. Level of education is inextricably linked to the growth of entrepreneurship as it influences owner-managers’ way of managing if they have the skills and knowledge to run a business. However, low levels of education of owner-managers are considered the weakest entrepreneurial condition in the Latin American region, and therefore of concern. 7,31
In order to facilitate owner-managers a methodological approach to measure and analyse the performance of their enterprises, this article sustains that TOC can be a useful solution to measure and analyse the performance of SMEs. From its origins, TOC set out to provide philosophy and method to the administrators that not only facilitate their behaviour, but will guide them to progressively superior performance in an uninterrupted way for what is considered a philosophy of continuous improvement. 13 TOC has been conceived basically to favour the development of for-profit organizations, for that reason the criteria that are handled below are aimed at characterizing the objectives and processes of the companies. This theory assumes that the fundamental objective of a company is the generation of wealth within the conditions imposed by those who have any influence on it, so that an action is improvement only to the extent that it contributes to this objective and achieve compliance with the imposed conditions. 14 –17
For TOC, what really matters is having indicators under which the impact of a local decision can be evaluated in the overall economy of an enterprise. This theory has been approached from the theoretical point of view 13,15,17,24,32 –34 and applied to diverse contexts. 21,23,35 –43
According to its creator, the economic objective of a company can be measured through three variables: Throughput, investment and operating expenses. 14 –17 Of these three indicators, TOC maintains that it is the Throughput that represents the indicator that offers the opportunity to improve the performance of the company. Both the investment and operating expenses have a theoretical limit that is zero and a practical limit that is greater than zero. The generation of resources does not behave in the same way as the company can look for constant sources of Throughput generation through increased sales, reduction of the unit variable cost and the appropriate mix of products having as a basis the Throughput per hour that is the expression of product Throughput and the delay in restriction. 16,18,30
In the case of Throughput, there are certainly elements that restrict its generation in the enterprise. If there is no limit to the Throughput that an enterprise can generate, this would be theoretically infinite, which is impossible in practice. These elements that restrict the generation of Throughput in the enterprise are known as constraints.
13,17,21,23
The basic premise of TOC is that the performance of an enterprise is limited by one (or, at most few) critical areas, resources or management policies. From the above, it is understood that a system consists of a series of dependent variables that must work together to achieve the goal and whose ability to do so is limited by some system constraint. The unavoidable conclusion is that global improvement is the direct result of improvement at the constraint.
18
(p. 123)
The theoretical basis to design and indicator to measure Throughput sustains that because throughput is a rate, it is always expressed as goal units per unit of time (e.g., hour, day, month or year) or unit of product. If the goal units are money, throughput will be an amount of money per time period or per unit of product. In the case of throughput per time period, throughput is calculated as (revenues received for the period minus totally variable costs) divided by the chosen time period. In the case of throughput per unit of product, throughput is calculated as the selling price of the product minus totally variable costs per unit.
18
(p. 121)
In this research, we try to make a contribution to address what other investigators pointed out as needs to deepen studies regarding the Throughput. Those needs are related to advances in research on calculation of optimal production mix preserving the system’s capacity and development of a structured method supporting long-term decisions. 11,13,45,46
Method
When establishing the Throughput as the right indicator for the owner-managers of SME, it is necessary to provide them with a method for the analysis of their components and identify, among them, the restriction that prevents its growth. For the level of completeness offered in the analysis that is desired, the authors favour the application of the method of chain substitution and successive approximation. In this method, the indicator to be studied is shown as a function of a series of simpler elements or factors, which are replaced one by one, determining the state of the indicator. Most of the approximate resolution methods are based on successive approximations. 26,27 This iterative method tries to solve an equation by successive approximations to its solution, starting from an initial estimate that can be a planned value or an ideal state previously achieved until reaching the current situation.
The essence of this method consists in the following, 27 an equation to be solved, f(x) = 0, where f(x) is a function from which one wishes to determine its states in time. Replace f(x) with the equivalent equation and is written in the form x = ϕ(x). Then the initial approximation x1 is chosen and replaced in the second member of the equation. The value obtained from x2 is taken by the second approximation. In general, if the approximation xn is known, the approximation. Subsequent xn + 1 is found according to the formula xn + 1 = ϕ(xn).
Chain substitution is a useful method for the quantitative analysis of the causes of differences in measurement. 25 –27 According to this method, it is necessary to activate an alternative standard value to the real values to determine the impact of various factors on the final indicators. Together they form the method of chain substitution and successive approximation. It is the opinion of the authors that for the analysis of the Throughput the method of chain substitution and successive approximation is an interesting, simple and useful method for owner-managers, but in practice there are not many examples of its application. Its purpose is to determine the influence of indicators that function as independent variables in the general indicator that functions as a dependent variable. 28 This is the reason why the application of the method is only valid if the dependence between the analysed variables is demonstrated. 25,47
From the literature reviewed, it is possible to say that most of the applications of the Throughput per hour are oriented to the administration of production, 5,19,22 others use subjective methods for their measurement and analysis. 5,12 Sometimes the researches carried out, due to their level of complexity, are not viable to be introduced into the daily practice of an entrepreneur. 11 The advantage of using this method is that it becomes a managerial tool that seeks to facilitate the administrative behaviour of entrepreneurs who, on occasion, are not experts in administration, accounting or finance, and what they really need is clear information that lets them understand the current conditions of their business to make the right decisions in pursuit of better performance.
The method of chain substitution and successive approximation approach will allow, step by step, to determine the influence that has had on the Throughput per hour each analysed variable. The steps of the method are simple, they are: Design the Throughput per hour indicator according to the nature of the system analysed. Its purpose is to determine the influence of indicators that function as independent variables in the general indicator that functions as a dependent variable.
28
This is the reason why the application of the method is only valid if the dependency between the variables analysed is proven.
25,47
Calculate the designed Throughput per hour indicator according to the reference pattern (can be an established plan, results of the previous period or the best historical results obtained). Calculate the Throughput per hour by gradually replacing the data from the reference pattern with the data of actual period of analysis, one by one in different calculations. Comparing one period with another allows us to observe the changes obtained in the Throughput per hour of the enterprise in terms of money. From the comparison between this and the reference pattern, the level of effectiveness obtained will be known and all the calculations that will be made will explain the reasons for this difference, if any, between the real data and the reference standard. This procedure consists of the successive substitution of the planned values or of a comparison period in the variables analysed by their real magnitude both in the case of the plan and the other period with which it is compared, while all the remaining variables are considered constant. In this case, each substitution implies an independent calculation: as long as there are more components in the formula, more calculations will be developed Subtract each result obtained from the previous one to know the influence that the factor that was substituted had on the variation of the Throughput per hour. The influence of one variable or another is determined by successive subtractions, the second result is subtracted from the first and continues in the same way, the third is subtracted from the second and so on. In this way, progress is made from the planned values to the real values or from the initial year of the comparison to the final year with which you want to compare. The absolute variation of the Throughput per hour is determined by
The general variation of the Throughput per hour is calculated taking into account the variation of the variables that comprise it
and so on. All the results obtained from the previous subtractions will be added algebraically and these must be equal to the difference between the actual Throughput per hour and those of the reference pattern. The analysis of the indicator results from establishing a comparison between the levels of Throughput per hour reached and those that have been used as a reference standard by unfolding the formula of the Throughput per hour in their factors. The objective is to determine the system’s constraint that prevents it from obtaining more Throughput per hour, then they are classified as efficiency or efficacy. The method of chain substitution is carried out by means of the integral determination of the influence of the different factors. The method guarantees the uniqueness of the valuation of the action of the factors regardless of the order of their substitutions. With the realization of calculations by the chain substitution method, the magnitude of the deviations (greater or lower) coincides with their mathematical meaning (±). These changes are important because they provide guidance to the owner-managers of the enterprise about what is happening or how the different concepts that make up the economic entity are being transformed as a result of the Throughput per hour gained or lost during the periods compared. These data will be classified as factors of efficiency and effectiveness according to the criteria expressed below: – Efficiency. There is efficiency when the process has managed to reduce the unit variable cost or when operating expenses have been reduced compared to any reference standard. That is, efficiency is associated with the reduction of costs and unit costs. – Efficacy. There is efficiency when the installed capacities have been better utilized, prices have been increased or the market has been better utilized. That is, efficacy occurs when there is an increase in the activity that is being evaluated. – Effectiveness There is effectiveness when it is reached, in terms of Throughput per hour, what is programmed or planned or exceeded. The use of the format in Table 1 is suggested. – This information will be classified properly in the following table for easy understanding.


Analysis of the impact of independent variables on the deviation of the Throughput per hour.
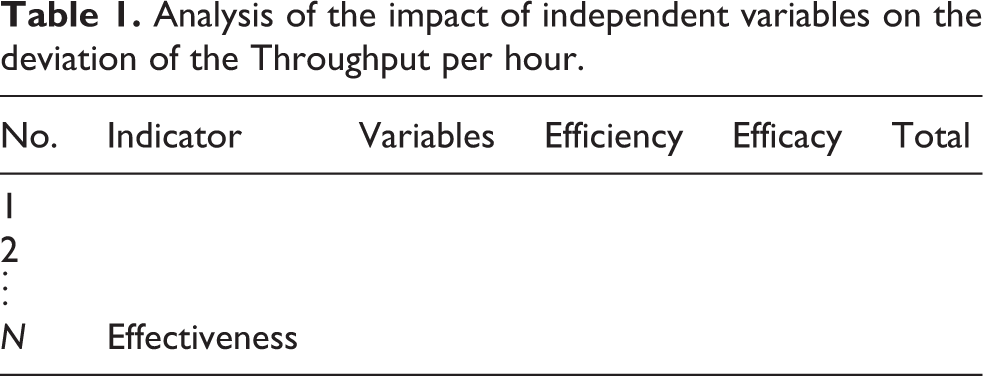
Once the variable that restricts the Throughput per hour is discovered, the first step of the Five Focusing Steps in the Process of On-Going Improvement is completed: (1) identify the constraint of the system, then it is possible to continue the process; (2) deciding how to exploit the constraint; (3) subordinating all the other parts of the system to the previous decision; (4) elevating the constraint of the Throughput per hour; and (5) returning to step 1, striving to prevent inertia when a constraint has been broken. 17,18,21,23
The study was conducted at a micro entrepreneurship which is dedicated only to the production of shirts. The entrepreneurship is located in Santo Domingo de los Tsáchilas, Ecuador and is providing work to four women. The chain substitution and successive approximation method was tested to evaluate the Throughput per hour as a performance indicator of the entrepreneurship and to detect what is constraining its growth. The main data sources used for this research work include structured interviews of the owner-managers and workers of the entrepreneurship, internal documents, direct observation work and participant observation.
Results
Based on the interviews carried out with the owner-manager and his employees, entrepreneurship has been presenting problems in their performance and they require improvement. The owner-manager has sought solutions to improve the business, but the situation has not improved. Increases and decreases in sales volumes seemed to have the same result. It was possible to appreciate lack of awareness of the scope of the problem and almost no performance assessment indicators.
All of the above allowed to identify the main indicators and variables involved in the production of the main product of the enterprise (see Table 2).
Data collection and research variables.
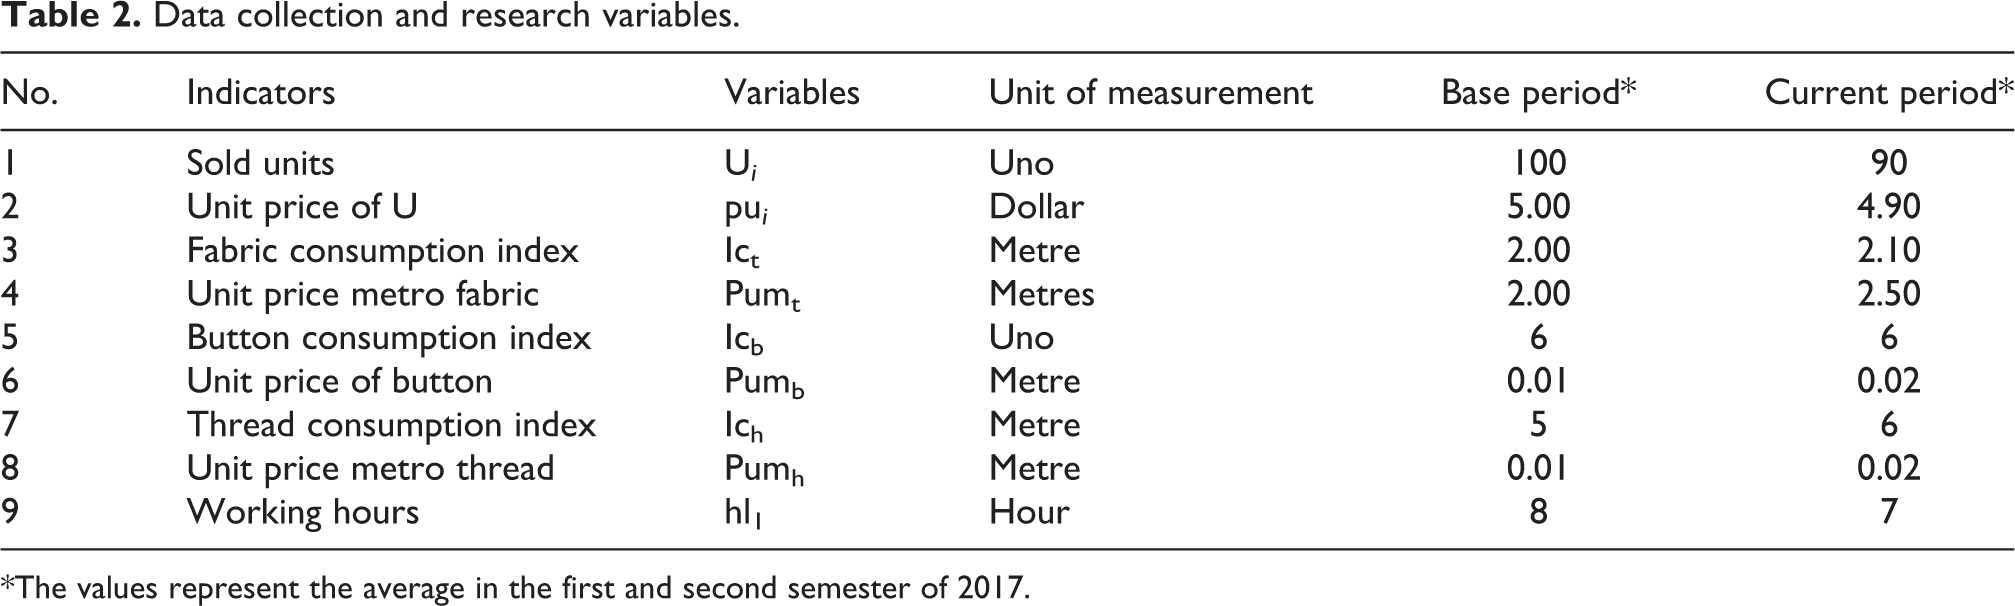
*The values represent the average in the first and second semester of 2017.
To understand the challenges and opportunities associated with the use of indicators to manage and lead the entrepreneurship, Throughput per hour indicator was designed. This is one of the most complex indicators due to the number of variables involved. The operationalization of the indicator is as follows

where T/h is Throughput per hour; U i is Units sold daily in the analysed period; pu i is average or weighted price of each unit sold in the period; Ic i is index of material consumption of the daily units sold during the period, expressed in physical units; pum i is unit price of the raw materials consumed in the units sold; hl1 is daily working hours of the period; n is type of product.
Based on the method described above, the Throughput per hour was calculated using the indicator designed and the data of the indicators that comprise it. The constraint is identified from the previous results (see Table 3).
Data collection and research variables.
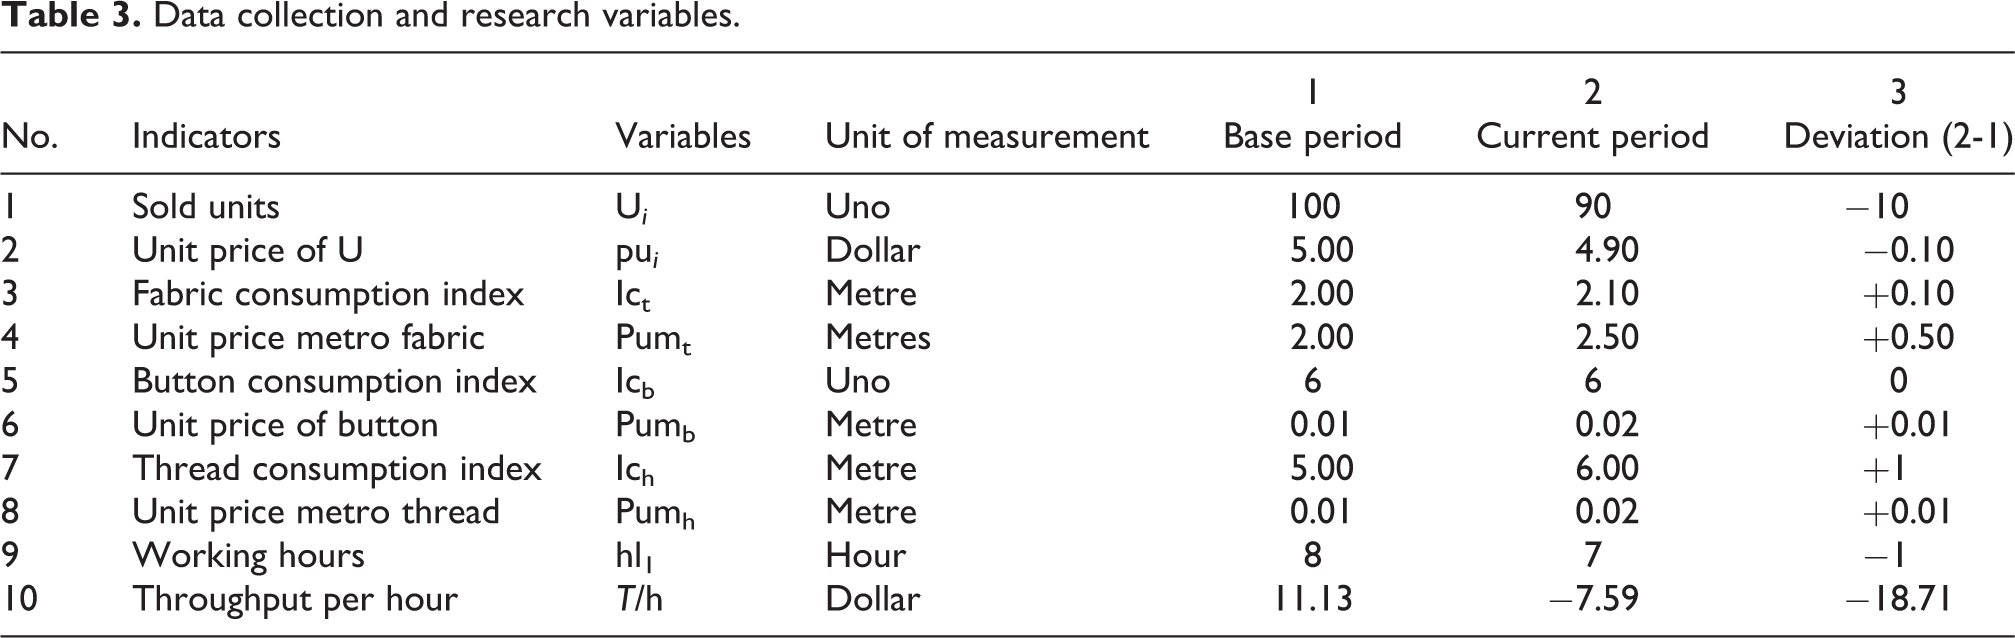
As it is possible to appreciate the Throughput per hour has shown a significant decrease from the base period to current period. This confirms that the enterprise has a problem to solve. Then the chain substitution and successive approximation method is applied. This would be the first step to identify a constraint. The presupposition behind this analysis is that there are few causes that explain the negative effects of Throughput per hour. Once the constraint is identified, the owner-manager could stop attacking symptoms and confront what affects the Throughput per hour. The process of chain substitution is carried out starting from the base period until the current results. This allows a Throughput per hour to be calculated taking into account these substitutions (see Table 4).
Chain substitutions.
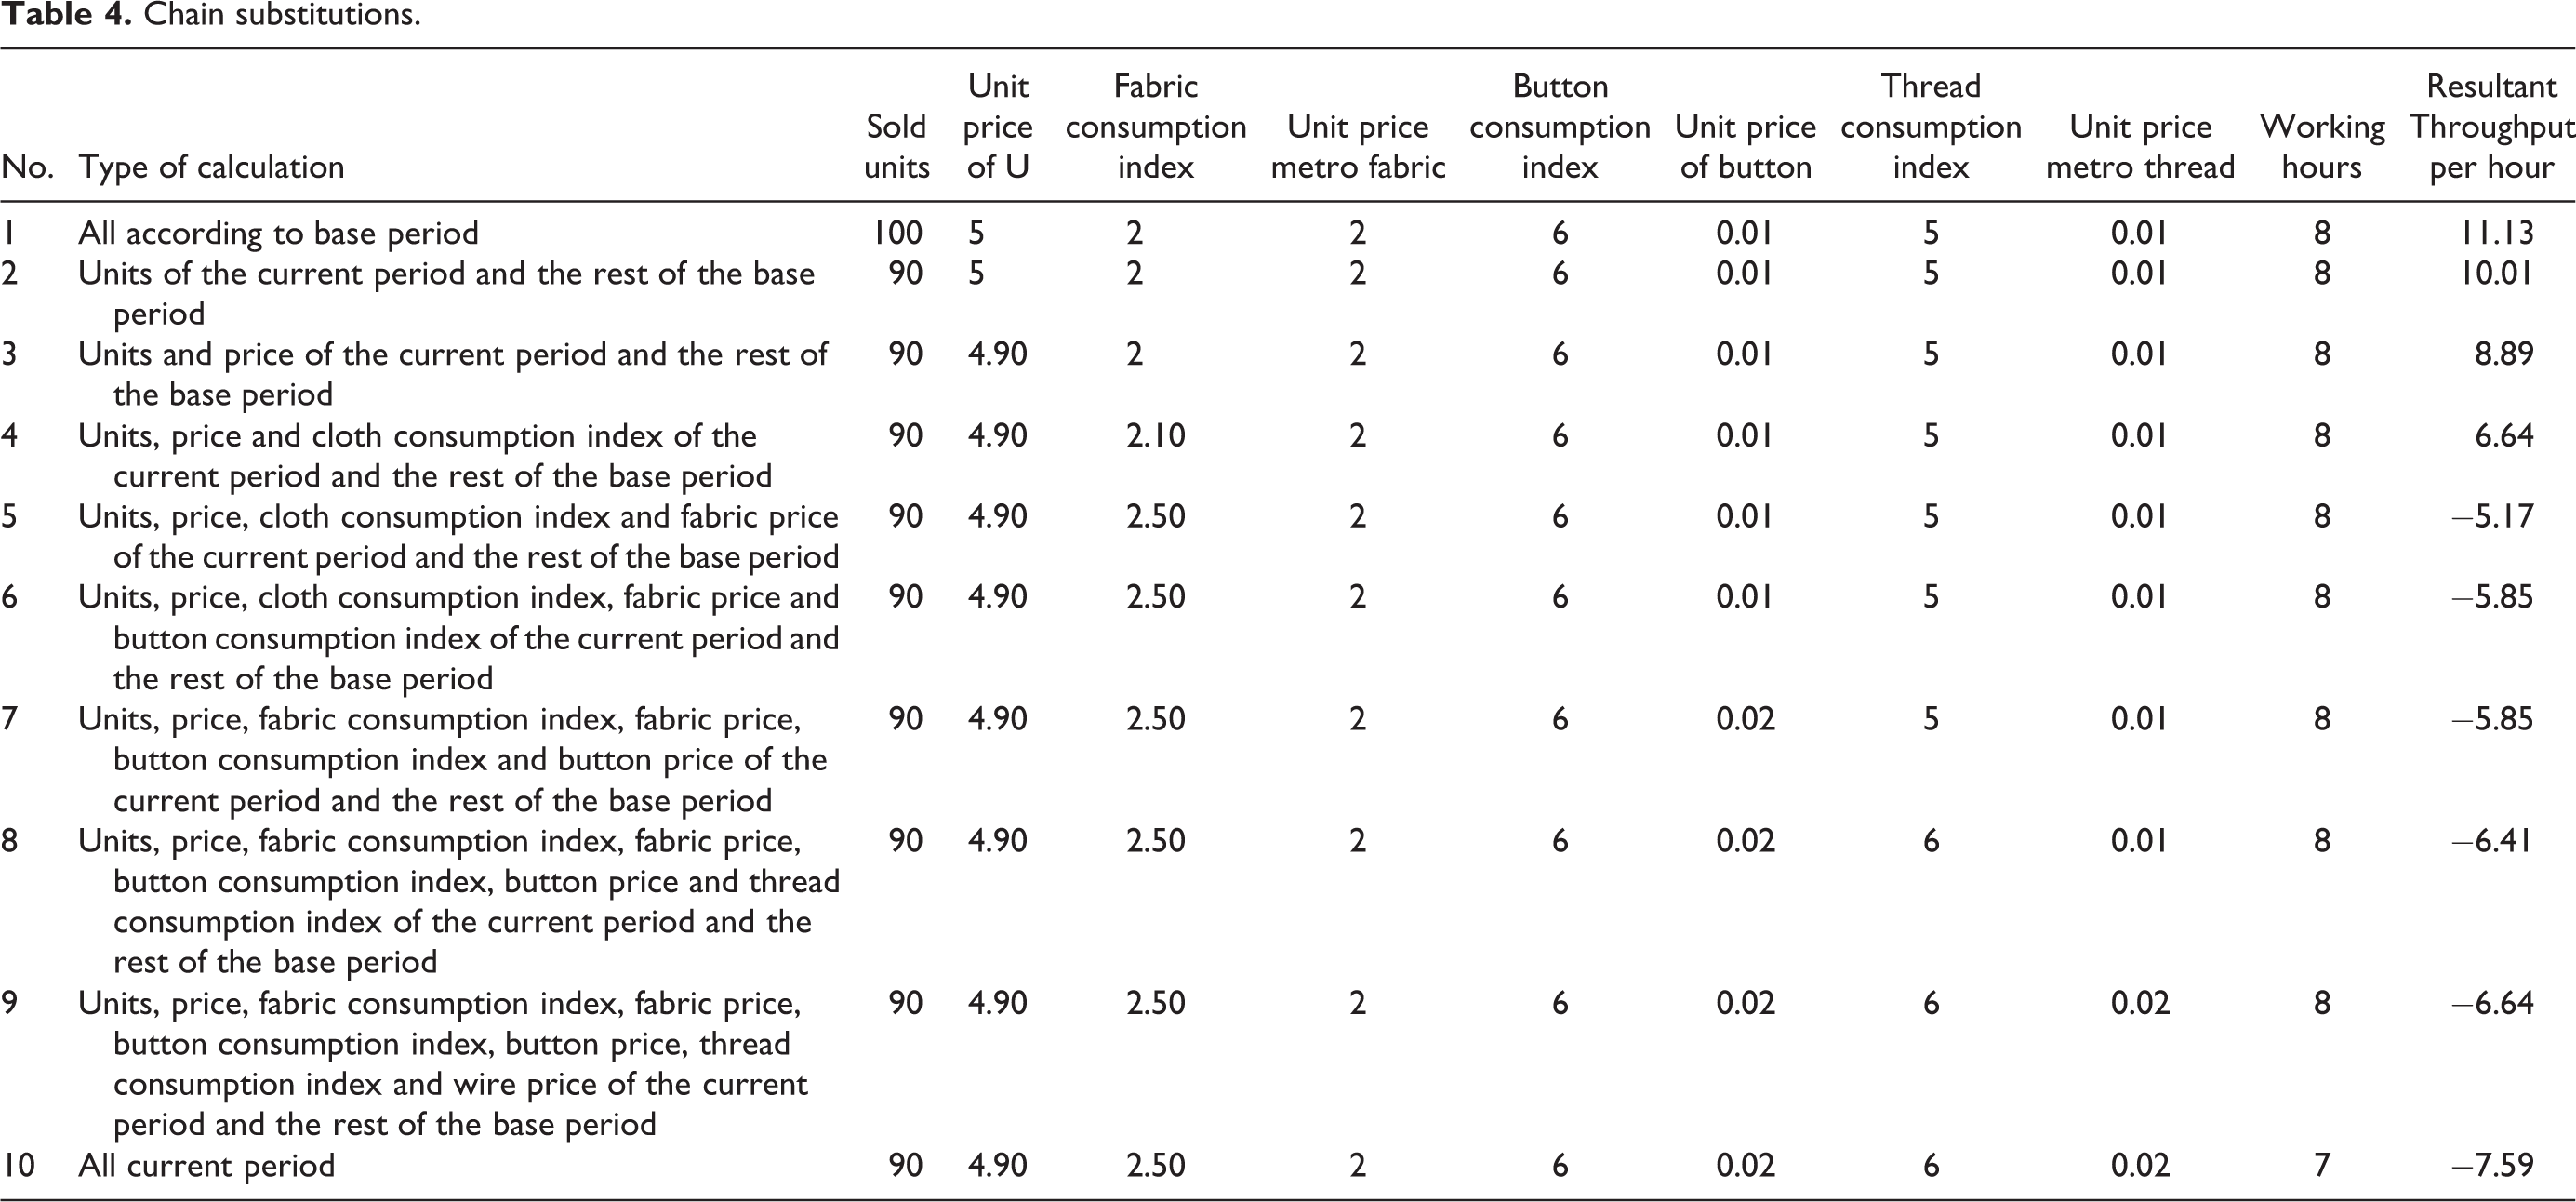
The process of successive approximation allows the calculation of the impact of the variations existing in the Throughput per hour due to the variations of the indicators that compose it between the base period and the current one (see Table 5).
Successive approximation.

Finally, the efficiency, efficacy and effectiveness analysis is performed to find the restriction that affects the Throughput per hour and its impact (see Table 6).
Analysis of the impact of independent variables on the deviation of the Throughput per hour.

*Most restrictive elements.
**Sum of (3 + 6 + 9 + 12 + 13).
The obtained results show that fabric is the component with the greatest negative impact on the Throughput per hour in general. In this case, the greatest negative value is the influence of the unit price of the fabric, which is why it is considered the constraint.
Now that we have already found the constraining policies of the company, it is necessary to define the new policies that will substitute these constraining behaviour. This would allow exploiting the constraint. Taking into account the information provided by the owner-manager and its employees, it seems that the constraint emerged from the inefficient process of identification and selection of suppliers, fundamentally due to the fact that this process is carried out empirically, it is bought by tradition to the same provider, which makes the negotiation process difficult, and there are no tools to do studies to identify better offers in the supplier market.
Findings indicate an urgent action with the suppliers, negotiation processes or change of suppliers in such a way that the price is reduced and the characteristics of quality, variety and quantity that the company needs are maintained. Now that the strategy is defined, it should be implemented. A suppliers study was carried out and it was possible, through negotiation processes, to find two of them that could facilitate fabric at more interesting prices for the understanding. During this process, production was limited to specific orders so as not to affect the most important customers of the enterprise. This allowed to subordinate the system to the existing constraint and to gain time in the development of supplier studies, negotiation processes and purchase processes that were derived from them. The actions taken allowed obtaining prices of $2.00, thus raising the constraint. It is necessary to highlight that the lower price did not affect the quality of the fabric in any way, so customers should show levels of satisfaction similar to those they maintained before the actions described. By implementing the actions mentioned above, it became clear the new constraint, but Throughput per hour had already improved and with it, the performance of the enterprise (see Table 7).
Throughput per hour after actions implemented.

Despite the improvement in Throughput per hour, it still did not reach the base period level, so the process was repeated two more times. In each cycle, the restriction was moved from one element to another, and the pertinent actions were taken for its exploitation and elevation. All of the above was done in close collaboration with the owner-manager of the enterprise and its employees. After two more cycles, an obtained Throughput per hour is shown in Table 8.
Throughput per hour after actions implemented.

Discussion
The main purpose of this article was to illustrate that using the logic of TOC concerning the Throughput is adequate in management decisions to improve performance in the context of SME. The indicator Throughput per hour was designed and the relations between its components were studied in order to identify main constraint. The analysis of these relationships was used to estimate the effect on the Throughput per hour once it is acted upon its fundamental limitation and, in this way, to be able to make decisions for its improvement.
The indicator designed, as well as the few rules described for its analysis, facilitates the improvement of the performance of the endeavour studied, improving the capacity to make decisions that contribute to this objective. Any owner-manager can reason from them, selecting the most appropriate course of action for the enterprise as a whole. The data with which the Throughput per hour was calculated could be identified by the owner-manager and his employees, but they were not analysed in an integrated manner, and the analysis of their behaviour served as a basis for making decisions to improve the performance of the entrepreneurship. This prevented the owner-manager from taking charge of what is happening in his business and managing correctly to achieve a better performance. This symptom was found in other studies that conceived TOC as a viable solution for its attenuation. 21,23,40
Prior to the implementation of TOC, there was no clarity on how to improve entrepreneurship because the objective was to produce to meet customer orders, but contradictorily this laudable objective prevented the improvement of entrepreneurship. As is possible to see in Table 8, the initial analysis provided evidence that the Throughput per hour decreased with respect to the base period in a 168.19%. The amount of lost Throughput per hour caused by metre unit price of fabric (see Table 6) showed significant change after acting on its improvement. This improvement represents the 24.24% with respect to the previous period but only represents the 48.34% of increase taking into account the base period. After applying the relevant actions to mitigate the restriction that limited it, the Throughput per hour improved and continued this trend two cycles later showing, at the end, an increase of 143.58% with respect to the base period. The above shows that the logic of the Throughput per hour using the chain substitution and successive approximation method works correctly in the identification of the restriction and the decision-making of the entrepreneur for its improvement.
After the implementation of the Throughput per hour analysis, the owner-manager changed her perspective about what her priorities should be in the exercise of the administrative process. The identification of the restriction of what prevented him from obtaining more money allowed him to make the decisions or courses of action that maximized the Throughput per hour, thus improving his performance as owner-manager, the performance of his enterprise and the economic situation of his employees.
The results obtained with the chain substitution and successive approximation method are similar to other studies that apply this logic in different contexts and with different purposes achieving an increment of the Throughput per hour. 3,10,23,35,39–43 This article introduced a relatively lesser-known method to analyse Throughput per hour, but easier tool to entrepreneurs in order to reach the desired improvement at their enterprises. Using an illustrative case study, the article has shown how this method facilitates decision-making and the continuous improvement of the business analysed.
Conclusions
The article has illustrated the use of TOC approach in SME. In Ecuadorian entrepreneurship conditions, this approach could be convenient to implement with the purpose of performance improvement. Ecuadorian entrepreneurs could profit from TOC application to quickly identify and attenuate or remove the constraints that inhibit their performance and ensure that they can continue to meet customer satisfaction with their product and services. TOC in general and Throughput logic in particular brings a new approach to SME management and provides to the owner-manager of the studied entrepreneurship an interesting point of view in opposition to the traditional way of looking at its organization’s goal and the way of managing it.
As already mentioned, the low level of instruction of owner-managers of SME could be a limitation to the generalization of the method. This approach requires knowing its methods and tools and should be adopted with care. Another important limitation is the absence, in a general way in the Ecuadorian context, of systems that allow the gathering of necessary data in a reliable way to calculate the performance indicators of the enterprises. This absence makes the method useless and, in the worst case, leads, with the incorrect data, to wrong decisions.
As further research in this area, we would be interested in continuing to enlarge the application of this method in other SME. An interesting avenue would use the method not only to act a posteriori, but could also be used to simulate possible scenarios of the company and thus be used as a planning method foreseeing variations in the performance indicators when there are deviations from the variables that they compose it according to a certain plan. Furthermore, it is conceivable the creation of software that facilitates the calculations which can be more or less difficult depending on the indicator that you want to calculate and its components.
Footnotes
Declaration of conflicting interests
The author(s) declared no potential conflicts of interest with respect to the research, authorship, and/or publication of this article.
Funding
The author(s) received no financial support for the research, authorship, and/or publication of this article.