
Abstract
Continuous business process improvement is a well-known strategy referred to as the “Japanese approach” to industrial production. Nowadays, it presents one of the basic requirements set by the ISO 9004:2000 standard. A new fuzzy model based on the Ishikawa diagram is proposed, whereby the rank of business losses of the main process at the manufacturing company level is determined, respecting the values of identified causes that lead to the formation of business losses, as well as their relative importance. In this article, it is assumed that the relative importance and values of causes are determined by descriptive linguistic expressions. The linguistic expressions are obtained by the fuzzy rating of a management team. The proposed algorithm determines the business losses with the highest possibility of occurrence and calculates the degrees of beliefs that some business losses are more likely to happen than the others. Real-life industrial data on small and medium companies operating in central Serbia and numerical examples are given to illustrate the method.
Introduction
Business conditions that have changed recently and put forward the global economic crisis induced changes in management processes that should enable continuous business processes’ improvement as a means of increasing the processes’ effectiveness and efficiency. In this way, the company becomes more competitive. This requirement is defined in quality standard ISO 9000:2000 and ISO 9004:2000 (section 8.5). 1 The company management determines the possibilities and defines the manners of achieving continuous business process improvement in compliance with recommendations as defined by the ISO 9004:2000 standard.
One of the ways of promoting the process quality is to monitor and improve the process performance. In the literature, there are many articles describing various methods for increasing the quality of the considered processes’ performances. For instance, Mauri et al. 2 developed a special parameter that is effective in measuring the performance of a manufacturing system and in detecting the causes of low productivity. The authors suggest that implementation of the proposed parameter is effectively guiding the improvement of processes. Numerical measures of the process capability, as one of the process performances, can be determined by applying the process capability indices (PCIs). In processes with a high extent of vagueness and uncertainties, it is necessary to modify conventional PCIs. Parchami et al. 3 expanded the traditional PCIs using uncertain quality modeled by the fuzzy set theory. The organizational performance of small businesses can be monitored by using a model developed by Wu and Olson. 4 In practice, statistical tools and techniques are often used to reduce process variability, which leads to increasing the business process effectiveness.
The process improvement can be accomplished by applying corrective measures (ISO 9004:2000 (section 8.5)). 1 The term corrective measures can be defined as “the organization must take measures to eliminate the causes of business losses, so as to prevent their recurrence.” In other words, it is necessary to identify all current and potential business losses, determine the causes of business loss formation, and apply appropriate measures, so that business losses do not recur.
In the literature, there are many articles considering the problem of identifying business process losses and the causes leading to their formation. For example, Radovilsky and William Gotcher 5 analyze the relation between productivity and business losses, trying to define productivity via business losses that occur during the production process. The authors define productivity as a relation between output and input, while the productive one represents the input along with the productive expenses of material, labor, energy, and financial resources involved in the production process. According to research results of Radovilsky and William Gotcher, it can be concluded that “The main difference between these two groups of input is that losses add only cost to input but not the value to product output. Decreasing the value of losses in input will contribute significantly to productivity growth.” According to this approach, production losses are divided into three classes: technological, organizational, and behavioral. Technological business losses are as follows: ineffective technological design, equipment in poor conditions, wrong materials, poor automation policy, poor tool supply, and low level of technical instruction. Organizational business losses are as follows: ineffective facility layout, unbalanced process line, ineffective work processing, poor working conditions, wrong work standards, ineffective pay systems, inventory shortages, overstocked level of inventory, poor material requirement planning, poor scheduling, low level of product quality, and poor quality control inspection. Behavioral business losses are as follows: poor job satisfaction, difficulties in motivating employees, low education and skill requirement, low level of responsibilities, and ineffective incentives.
Bell 6 gives an example of Toyota Motors Co. as the best example of how improvement of production program can be achieved based on the analysis of business losses. The analysis of “overproduction, idle time of workers and equipment, transportation delays, poor quality, etc. can be used by the company to evaluate and improve the combination of equipment and processes to make the company more productive.” 6
Todinov 7 suggested a model and an algorithm for reliability value analysis with complex systems connecting reliability and losses from failures. The author emphasized the present value (PV) of losses and indicated that the value of production losses varies over time, and in the NPV model for tracking the losses from failures, three causes dominate: (1) cost of lost production; (2) cost of intervention to initiate repair, which also includes the cost of mobilization of resources for repair; and (3) cost of replaced components and cost of repair. The sum of stated costs represents the losses from failures. According to Six Big Losses approach developed in the 1970s at Japan Institute of Plant Maintenance, where it is induced that there are six most frequent causes of production stoppages, manufacturers are needed to examine their efficiency. 8 Modified view of Six Big Business Losses and their causes is given in Table 1.
Modified view of Six Big Business Losses and their causes.
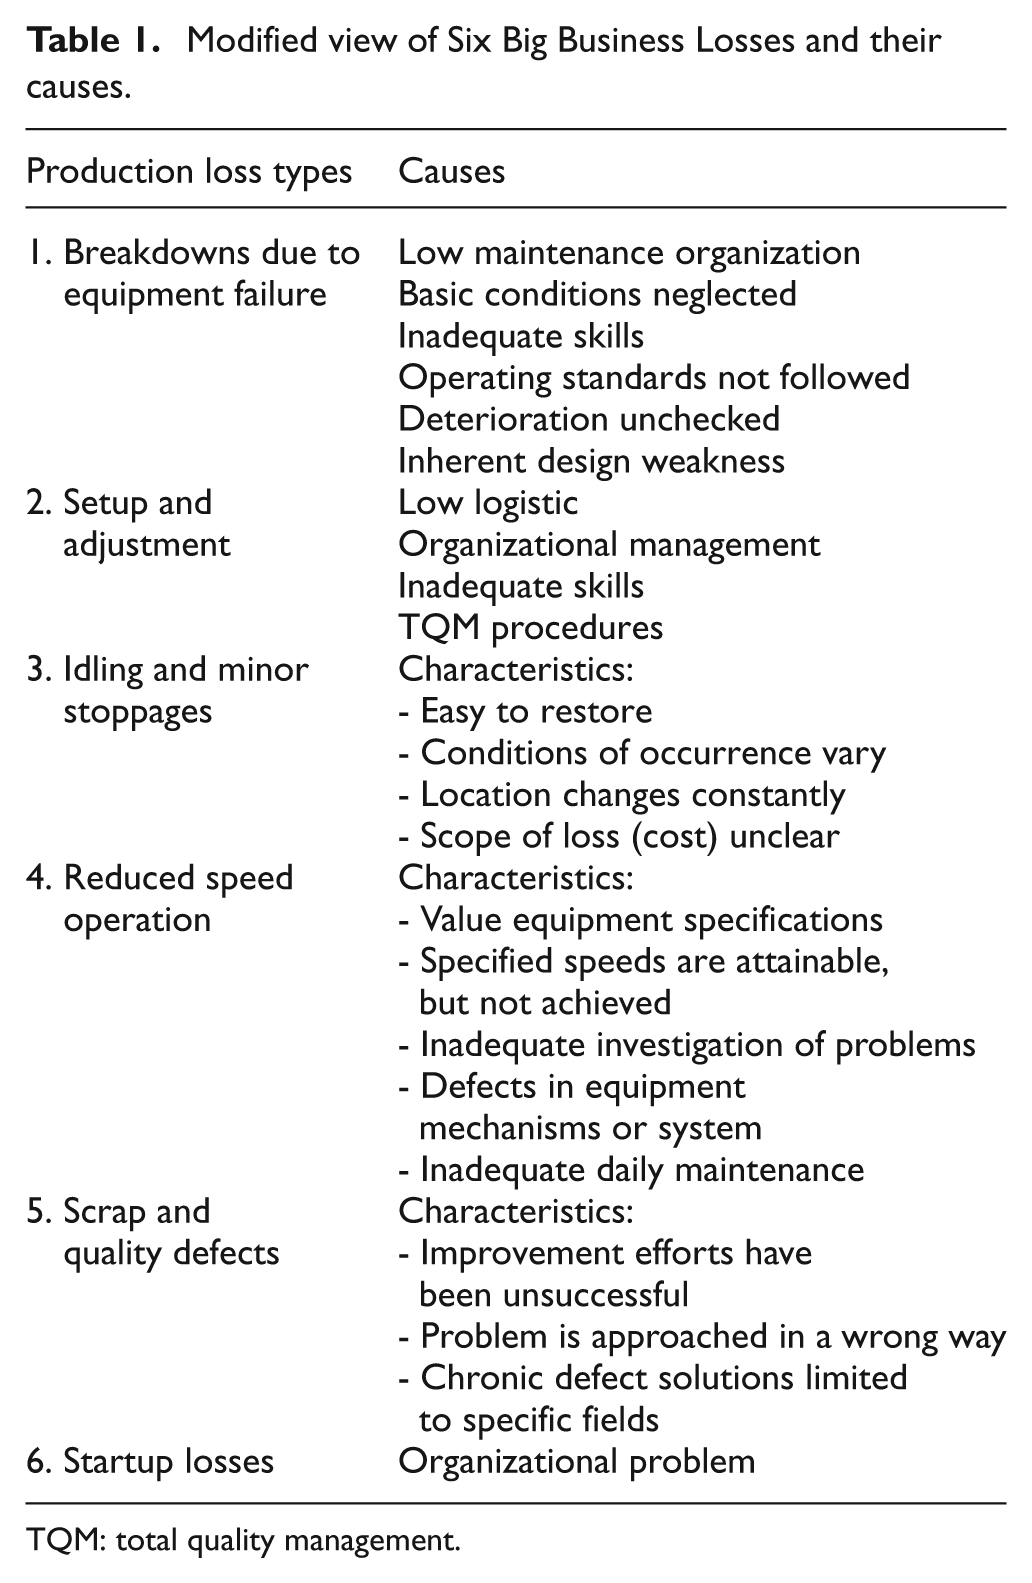
TQM: total quality management.
This approach was applied in the CDC factory and the results have shown that the average efficiency rate is 48%, and main causes of the stoppage are identified: mechanical downtime (9%), setups and changeovers (availability) (7%), idling and minor stops (performance) (7%), reduced speed operation (7%), start-up losses (6%), and scrap and rework (1%).
In the ISO 9004:2000 standard, some methods are listed that can be successfully used to identify business losses and causes leading to their formation, such as brain-writing; Ishikawa diagram; Strength, Weakness, Opportunity, and Threat (SWOT) analyses; and Pareto analysis.
After data collecting and processing, the management team should take appropriate management measures to eliminate causes and prevent business loss reoccurrence. As all losses do not have identical effect on the process quality, the realization of management measures also requires engagement of human and financial resources according to the ISO 9004:2000 standard (section 8.5.2a): Re-evaluation of losses is emphasized because the management team should rank losses and schedule corrective measures’ realization accordingly. In the literature, there are numerous methods recommended for ranking business losses, such as Pareto diagram, histogram, control charts, correlation diagrams, relationship diagrams, and branching-tree diagram. These methods cannot be applied unless there are a large number of crisp data from records.
If there are no large number of data from records or if changes are fast and frequent, the recommended methods are inadequate for using. This fact is underlying the authors’ motive to develop a reliable method containing uncertain and imprecise data and a corresponding software to determine exactly the rank of business losses.
In this article, the evaluation and ranking of business losses at the company-level problem are handled in two steps. In the first step, the relative importance of causes leading to the formation of each considered business loss is estimated by the management team. In the second step, the rank of business loss values is determined by the proposed model and the corresponding software.
It can be assumed that the relative importance of causes leading to the formation of every business loss and its values are different at the enterprise level. They are subjective and qualitative in nature, and it is very difficult for the decision maker to express the preference using precise data. It is closer to human reasoning that the knowledge of decision makers is represented by a natural language, which is the most efficient communication tool. Owing to the development of different mathematical theories, primarily the fuzzy set theory, 9 these linguistic expressions can be adequately modeled using the fuzzy set theory. There are some advantages of the fuzzy approach to modeling uncertainties, over other techniques and methods, because it can provide a valuable framework for handling imprecise and ambiguous data and provides reasoning and decision-making methods based on such data. The fuzzy set theory resembles human reasoning in its use of approximate information and uncertainty to generate decisions. 10
The contributions of this article are as follows: (1) it proposes a new fuzzy model and the corresponding software for ranking business losses at the enterprise level with respect to many causes, (2) it handles uncertainty in relative importance and values of causes using discrete fuzzy numbers, and (3) the developed algorithm can be used to analyze business losses at the group-of-enterprise level over time and to determine a degree of belief that ranking of business losses at the enterprise and group-of-enterprise levels is stable.
This article is organized in the following way. Section “Introduction to the fuzzy set theory” presents introduction to the fuzzy set theory. Section “Modeling of uncertainties” gives an overview of articles that can be found in literature dealing with the problems of uncertainty modeling. The new model and the corresponding algorithm are given in section “A fuzzy proposed model.” The proposed fuzzy model is illustrated by an example with real-life data in section “Case study.” Conclusions are presented in section “Conclusion.”
Introduction to the fuzzy set theory
Basic definition of fuzzy sets
To facilitate the understanding of articles overviewed below and modeling of uncertainties that exist in the proposed model, basic definitions of the fuzzy set theory and rules of the fuzzy algebra are presented. 11
Definition 1. Fuzzy set
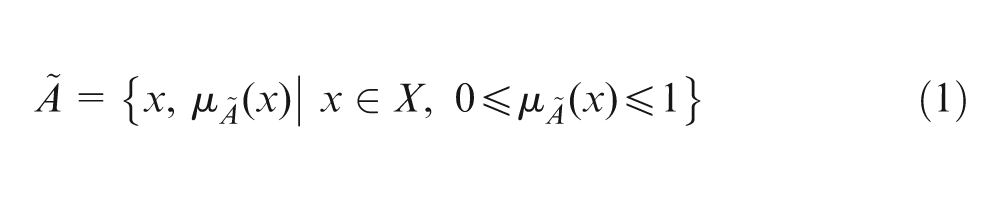
where fuzzy set
Definition 2. A fuzzy number
Definition 3. The
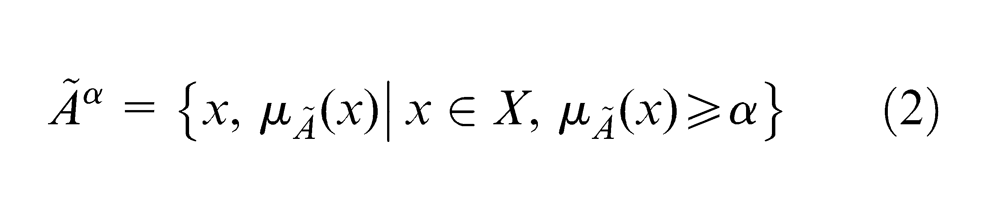
where
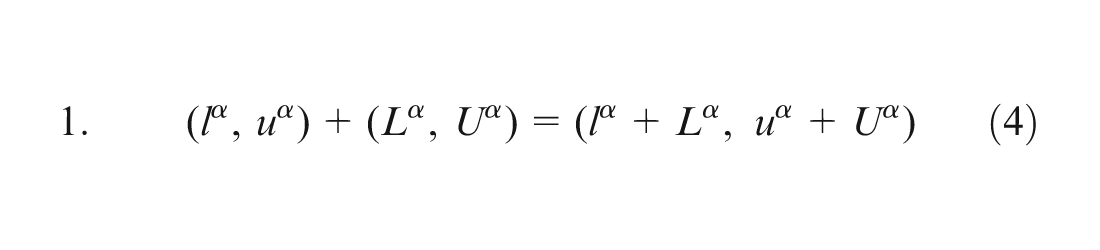
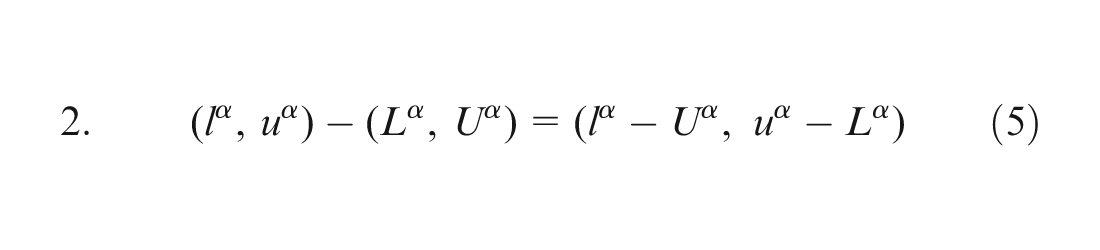
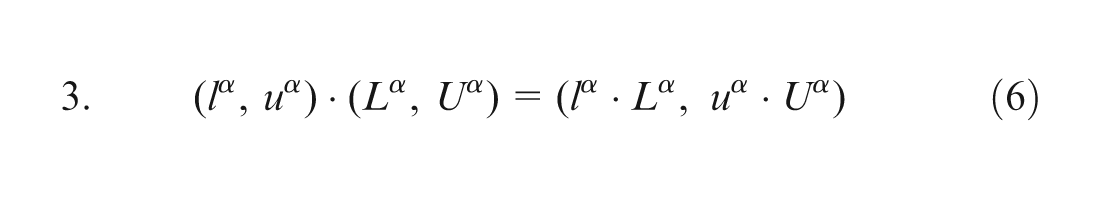
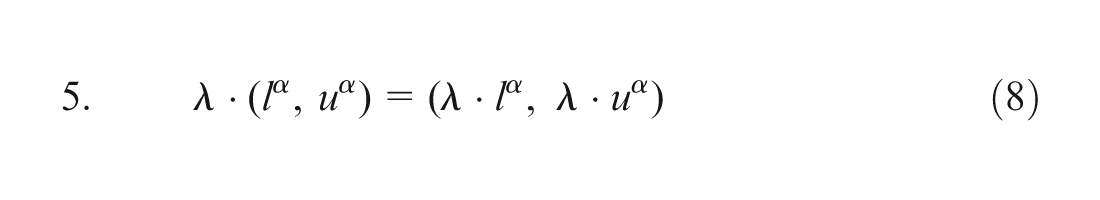
Definition 4. The operations of fuzzy numbers are based on the theorem set by Dubois and Prade.
11
Let two fuzzy numbers
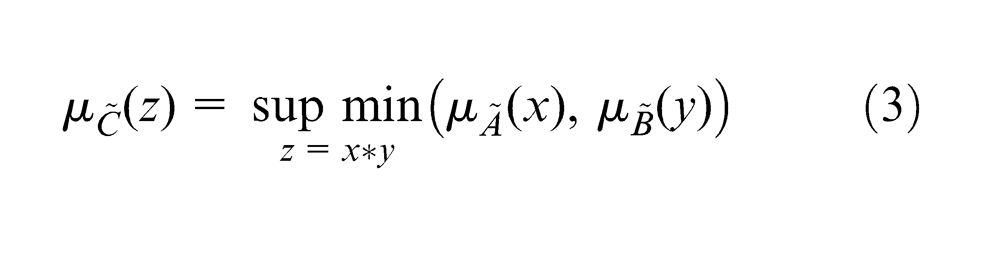
Consider two discrete fuzzy numbers

Modeling of uncertainties
In this section, modeling of uncertainties in the relative importance of causes leading to the formation of business losses and their values for each business loss are described by predefined linguistic variables. In the literature, there are no rules or recommendations on how to choose linguistic terms for describing uncertainties. Number and type of linguistic variables depend on the nature of the problem and management team estimates.
As small and medium companies are considered in this article, it is realistic to assume that (1) the operational management team consists of medium-level managers in a company, (2) the relative importance of any cause occurring in any treated business loss was made by consensus of operational management team, and (3) the relative importance of causes and their values are given by direct estimation of the management team; many authors consider that using pair-wise comparison is more reliable than obtaining them directly because it is easier to make a comparison between two attributes than make an overall weight assignment; 12 however, when there exists a relatively small number of attributes, it is justifiable to apply the direct estimation approach; this assumption was used in previous studies.13–17 Management team members create their estimations based on evidence data, knowledge, experience, available information, expertise, skills, and so on.
In this article, all existing uncertainties and impreciseness are described by linguistic expressions. The modeling of these linguistic expressions is based on the fuzzy set theory. A fuzzy set is represented by its membership function. The parameters of membership function are shape, granularity, and interval of real set numbers that the fuzzy set domain is defined on.
Determining the shape of membership function is a complex decision problem because it should reflect the knowledge and uncertainty available on the treated linguistic variables. 18 The membership function of a fuzzy set can be obtained based on one’s experience, subjective belief of decision makers, intuition, and contextual knowledge about the concept modeled. 19 In the literature, there are six ways of determining the membership functions. 20 It should be mentioned that subjectivity in determining the membership function has been considered as the weakest point in the fuzzy set theory. 21 In this article, the relative importance of causes and cause values are modeled by discrete fuzzy numbers. Why we opted for discrete fuzzy numbers? We used discrete membership function in order to avoid analytic considerations and to apply “digital way of thinking.” 22
Granularity is defined as the number of fuzzy numbers assigned to the relative importance and values of causes leading to the formation of business losses. According to Lootsma, 23 human beings can use only seven categories at the most. According to this assumption, the author used five and seven different linguistic expressions assigned to relative importance of causes and cause values, respectively.
Generally, the domain of any fuzzy set is defined over a set of real numbers that belong to the predefined interval. In the literature, in a volume of works, the researchers used the interval [0,1]. 24
In many articles encountered in the literature, uncertainties are modeled by discrete fuzzy numbers. In Petrović and Petrović, 14 the relative importance of considered criteria and the values of inventory policies are described by three and five linguistic expressions, respectively, which are modeled by discrete fuzzy numbers. The domains of discrete fuzzy numbers are defined on different measurement scales. The developed fuzzy algorithm for determining the best alternative respects all treated criteria as well as their relative importance. In Tadić et al., 25 possible ways of business improvement concerning holding equipment in specific production conditions characterized by decreased production range and lack of financial sources for applying the systems of assembled and disassembled equipment are analyzed. The criteria weights and imprecise criteria values are described by three linguistic expressions modeled by discrete fuzzy numbers. Calculation of the optimization criteria weight vector is based on the concept of equal possibilities. 3 Tadić et al. 26 used discrete fuzzy numbers to model the possibility of hazards and overall safety based on which the safety of each operation process of food industries is evaluated. In the following section, the procedure for modeling the relative importance of causes and their values is presented.
Modeling of relative importance of causes
The relative importance of business causes is different and determined based on the knowledge and experience of operational management team. Also, it can be assumed and taken as unchangeable during the considered period of time. In this article, the relative importance of each identified cause is described by using one of the linguistic expressions from a predefined set of linguistic expressions. In this article, five linguistic expressions are defined: very low importance, low importance, medium importance, high importance, and very high importance. These linguistic expressions are modeled by discrete fuzzy numbers whose domains belong to interval [0,1]. The value 0 denotes the lowest relative importance and 1 denotes the highest relative importance. These discrete fuzzy numbers are given in Figure 1.
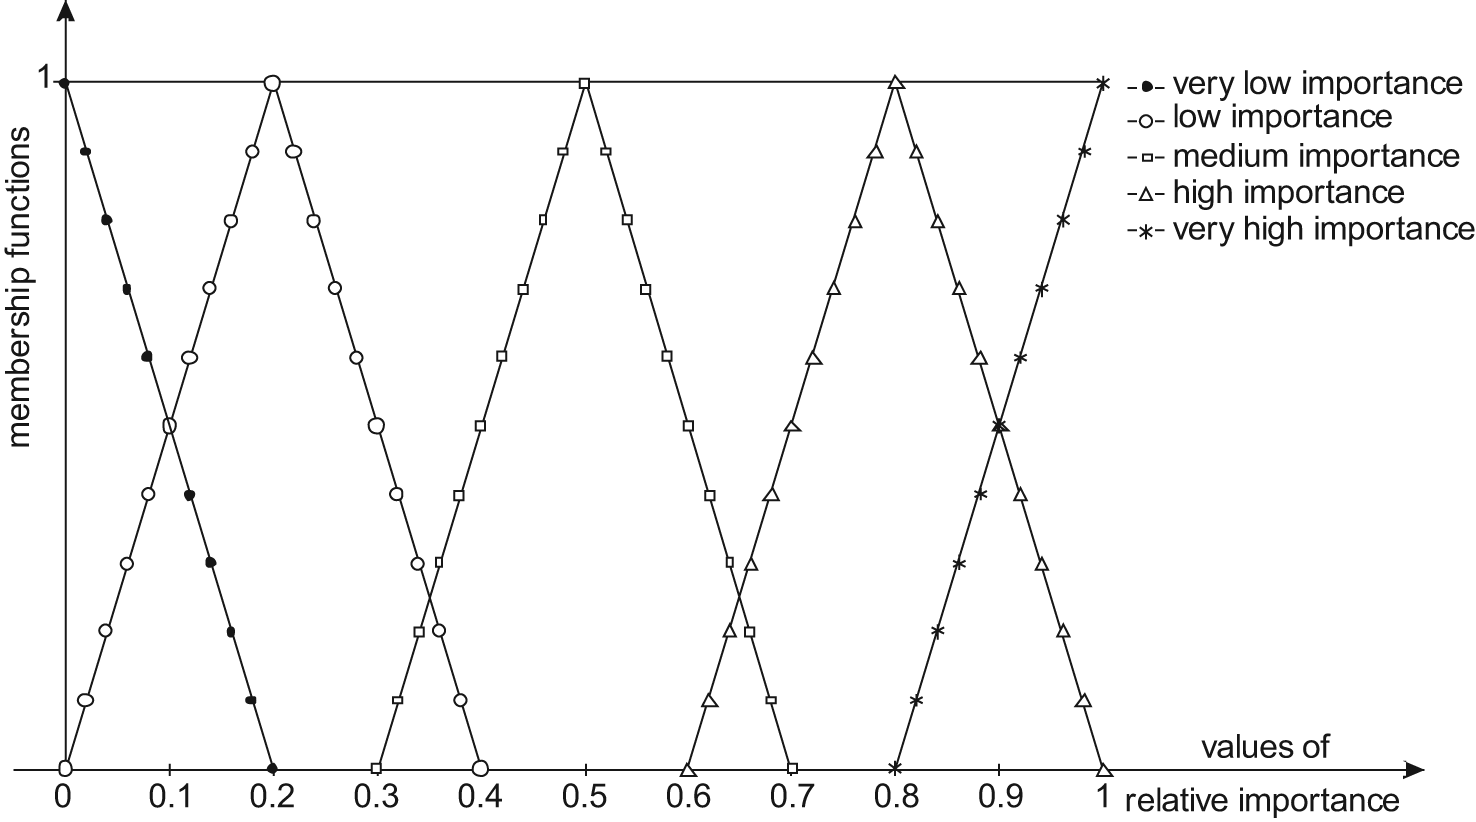
Relative importance of business causes.
Modeling of business cause values
The values of identified causes cannot be stated quantitatively because decision makers in the operational management team most often base their estimates on the evidence data, changeable business environments, experience, knowledge, and so on. In this article, the authors have introduced the identified cause values, which should be clarified in favor to an easier assessment. In this article, the values of the selected causes are adequately described by predefined linguistic expressions, which can be represented as discrete fuzzy numbers
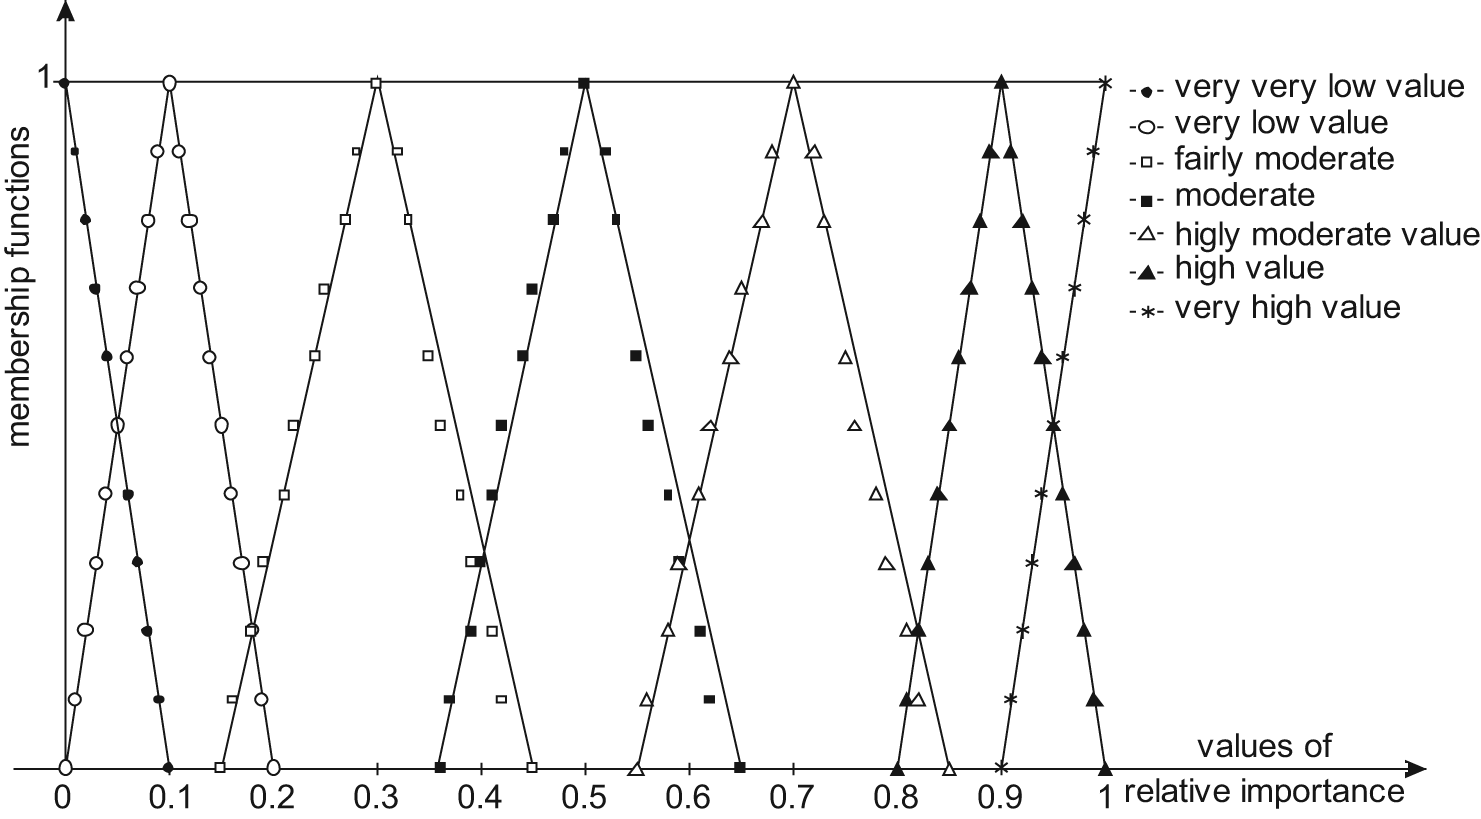
Discrete fuzzy sets representing the values of causes.
A fuzzy proposed model
For the operational management team that carries out the analysis, the following tasks are important: (1) to determine which business loss in a company
The value of each selected business loss in a company
Applying the average value method enables the determination of the value of any business loss i, i = 1, …, I, at the level of one group of similar enterprises,
In this article, the procedure of comparison of discrete fuzzy numbers is based on the method in Petrović and Petrović.
14
These ranked fuzzy numbers are further analyzed to determine a measure of belief that one fuzzy number is bigger than the other and a measure of belief that it is not. This procedure is applied in order to determine the measure of belief that a fuzzy number that is ranked higher is bigger than another fuzzy number that is lower in rank position, in other words, to determine the measure of belief that one business loss in a company
The algorithm for analysis of business loss formation in a company
Step 1. Input fuzzy matrix
Step 2. For a company
Step 3. Multiply

and form a fuzzy I-column matrix
Step 4. Rank all
Step 5. Calculate the degrees of belief that any
Step 6. For a group of similar enterprises, calculate business loss value (i = 1, …, I)

and form a fuzzy P-column matrix

Step 7. Calculate the degrees of belief that any
Case study
The proposed fuzzy model and corresponding software are tested on real-life data of 27 manufacturing small and medium enterprises (SMEs) operating business in central Serbia. In these SMEs, similar production processes are realized. The authors’ choice of a group of enterprises is grounded on the following facts. (1) SMEs are very flexible, their business operations can be rapidly adapted to variations occurring in a changeable market environment, thereby representing an important segment of each country’s economic development; owing to the SMEs characteristics, a large number of them has the capacity of transforming into big companies. (2) In European Union (EU) two-thirds of employees (around 80 million workers) are employed in SMEs, producing around 60% of gross domestic product (GDP) and participating in the overall EU turnover with around 70%. (3) Based on the 2010 records of the Bureau of Statistics of the Republic of Serbia (ISSN 1820-0141, 2010), around 99.4% of registered enterprises in Serbia are SMEs, and manufacturing SMEs employ the highest number of workers. According to Oakland, 24 in the company, three processes can be considered: management process, main process, and support process. In this article, the authors’ attention was focused on the main process in SMEs in central Serbia.
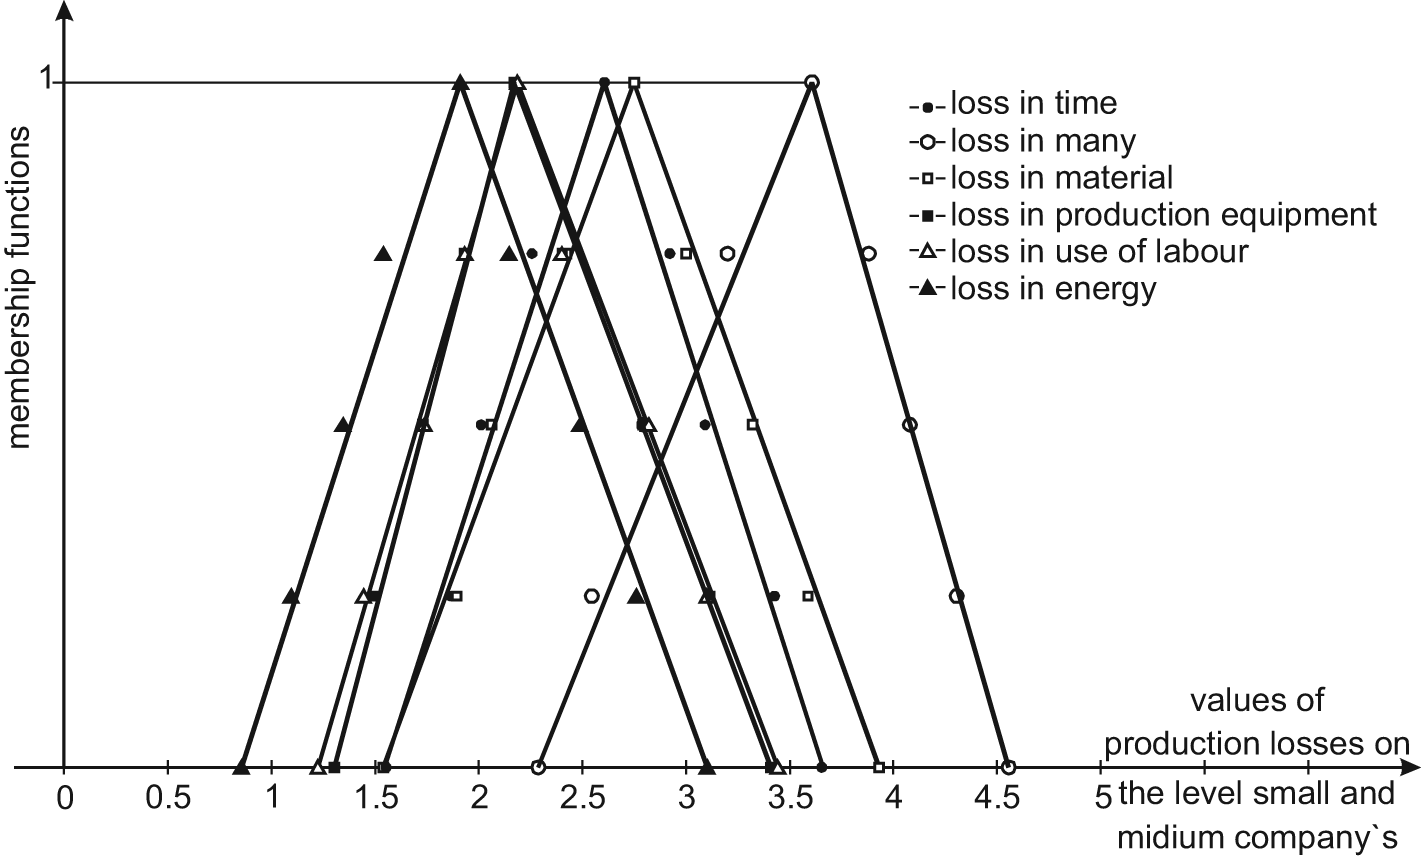
In this article, identification of business losses and causes leading to their formation in SMEs is performed by using the Ishikawa diagram. Six business losses are identified: (1) losses in time, (2) losses in money, (3) losses in material, (4) losses in production equipment, (5) losses in use of labor, and (6) losses in energy.
Seven business causes under consideration and the corresponding reference values are as follows: (1) irrational capacity use; (2) inexpedient production program; (3) irrational use of resources; (4) low organization of production processes, technology, and work methods; (5) irregular supply of raw materials and other needs; (6) lack of coordination of the overall business; and (7) inexpedient construction of engaged resources.
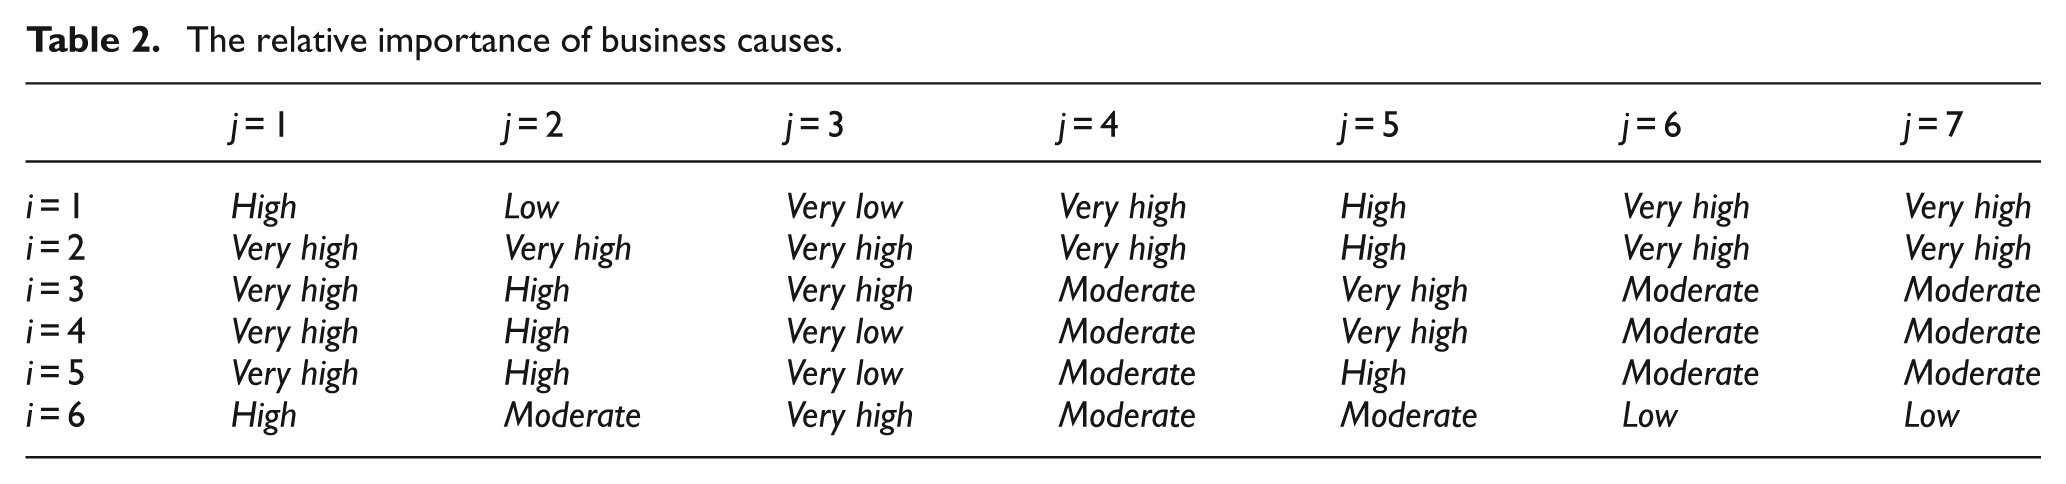
Decision was made on the relative importance of business causes and they were described using linguistic expressions by an operational management team formed at the level of a group of enterprises under consideration. It can be assumed that the relative importance of causes leading to the formation of predefined business losses is equal for all SMEs engaged in a similar activity and operating in a similar environment. The defined linguistic expressions are mapped into discrete fuzzy numbers and arranged in Table 2.
The relative importance of business causes.
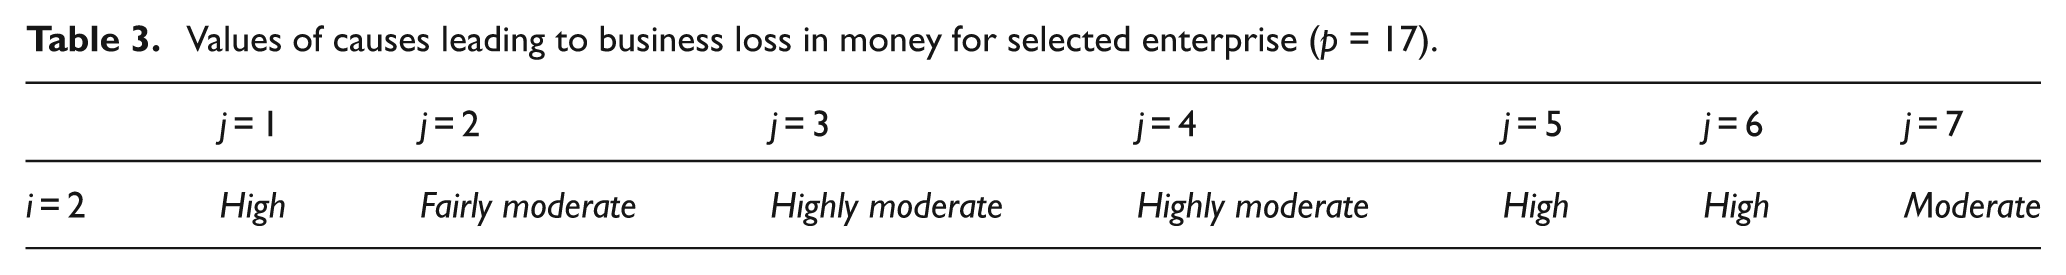
Calculating business loss in money at the company level, chosen at random (p = 17), is presented in detail. The fuzzy rating of values of causes leading to business loss in money at the chosen enterprise level is presented in Table 3.
Values of causes leading to business loss in money for selected enterprise (p = 17).
Aggregated value of business loss in money at the level of a randomly chosen company (in this case p = 17) is calculated by applying the proposed algorithm and software, which is based on fuzzy algebra rules (from Step 1 to Step 3).
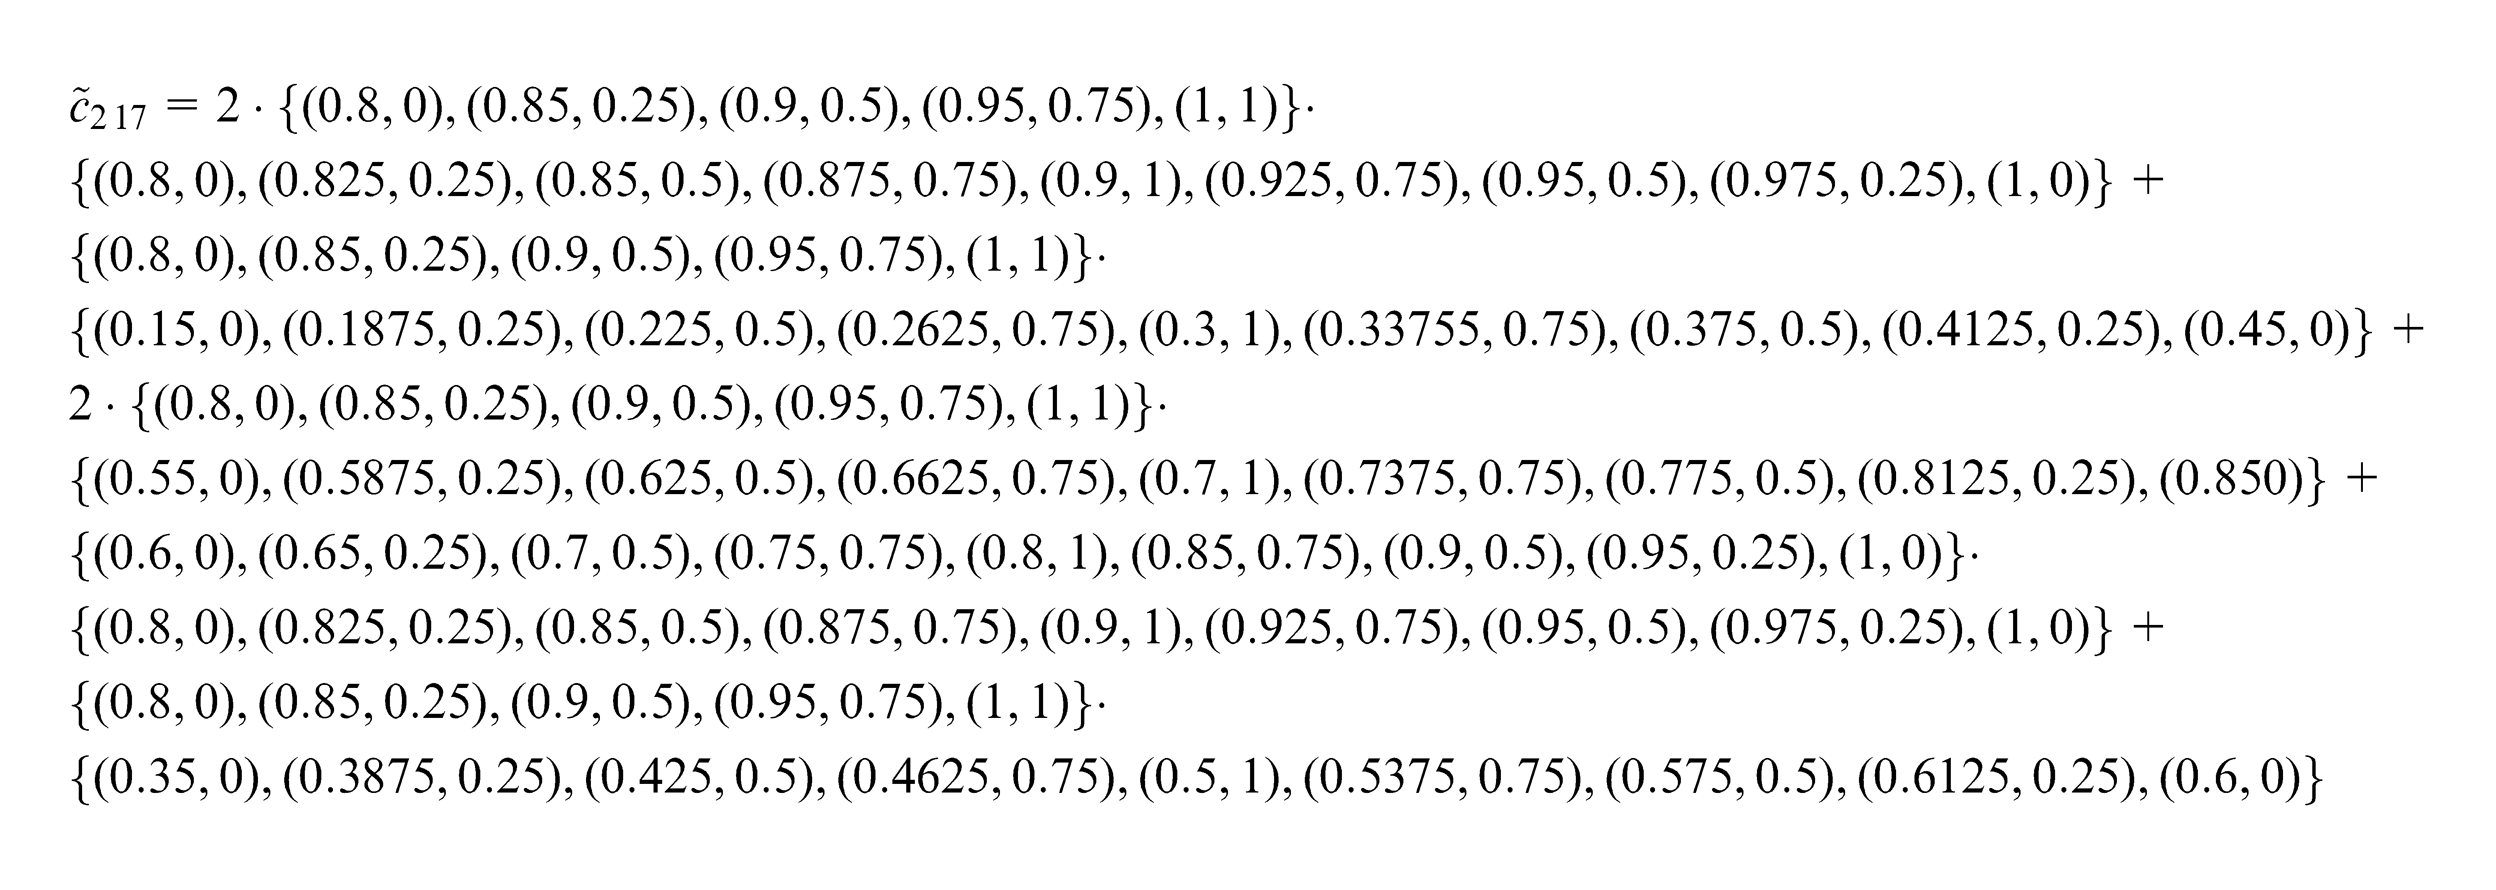
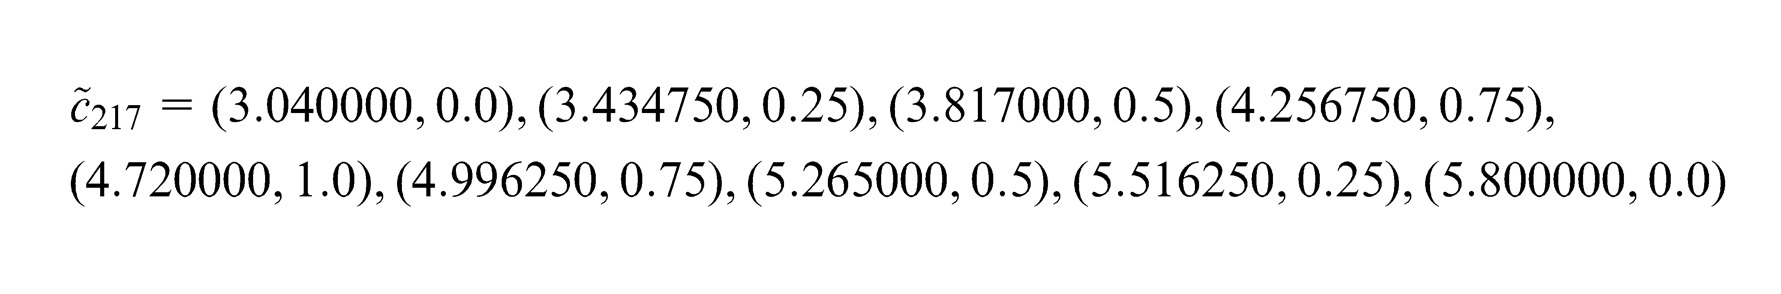
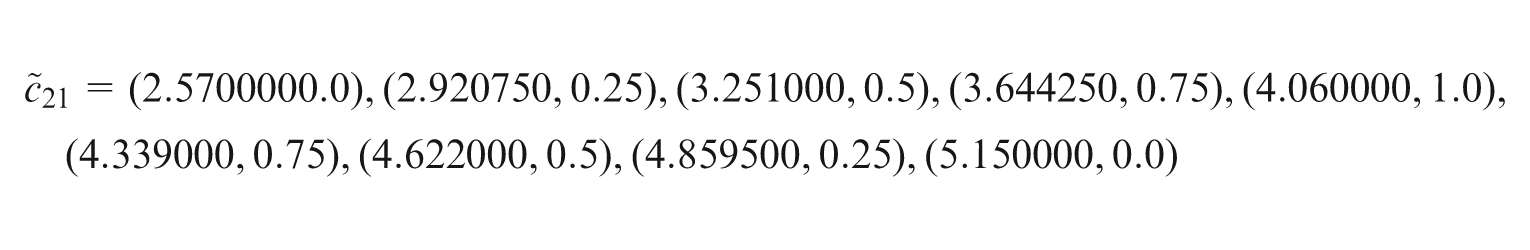
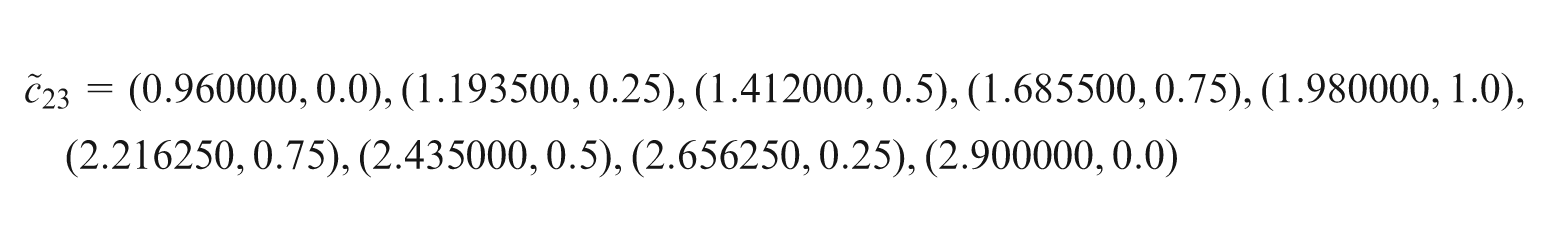
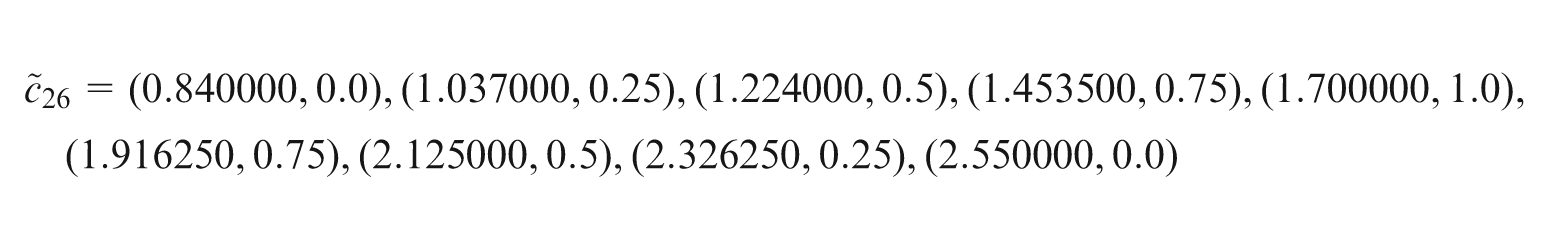
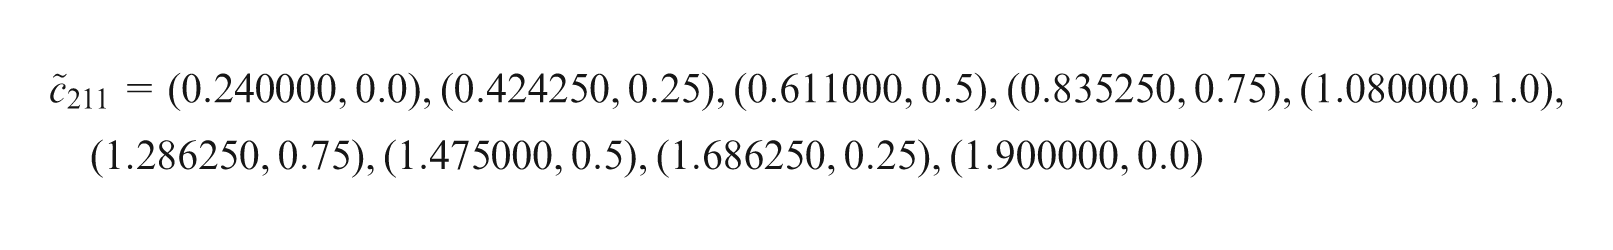
Similarly, the aggregated values of all identified business losses at the chosen enterprise level are calculated (Figure 3). The discrete fuzzy numbers
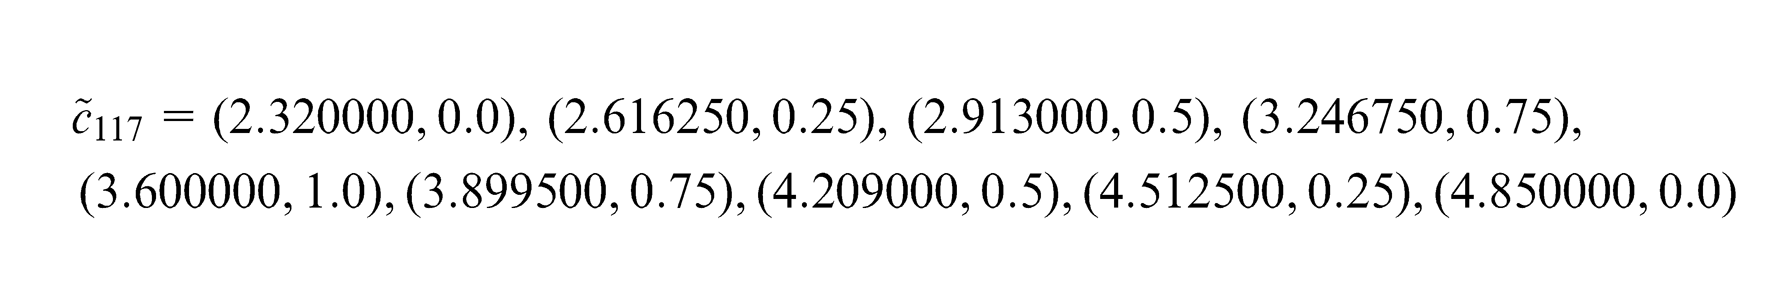
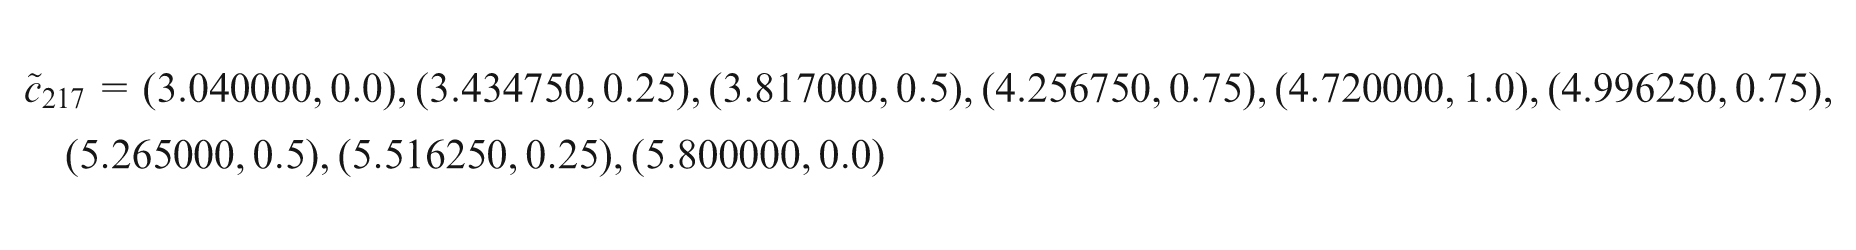
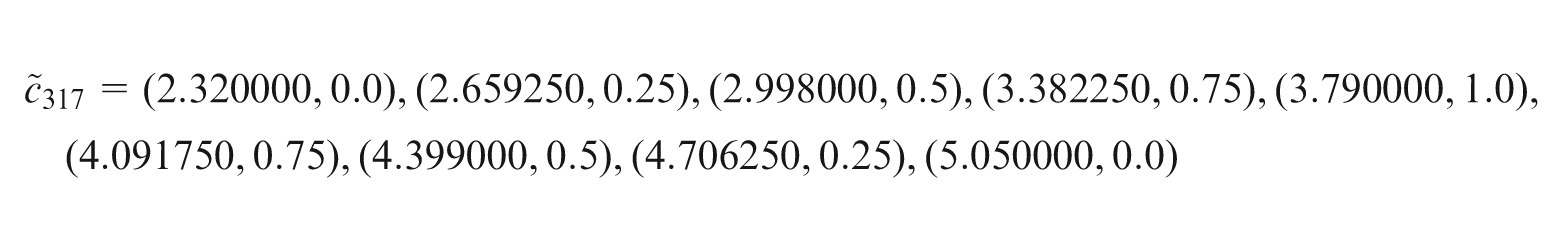
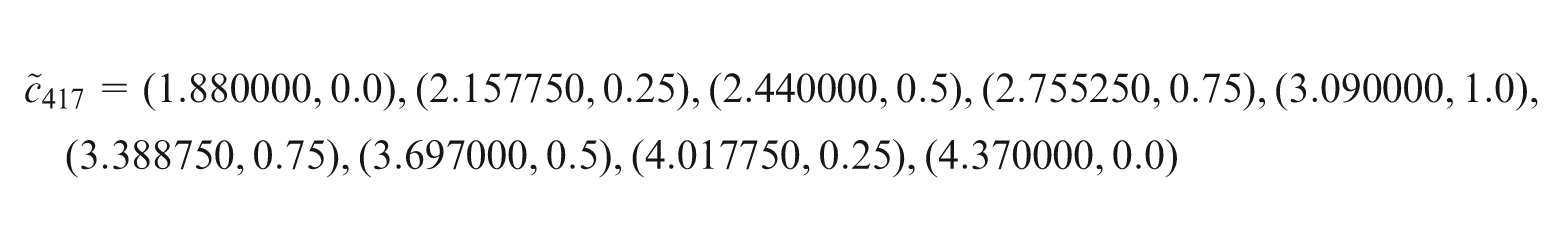

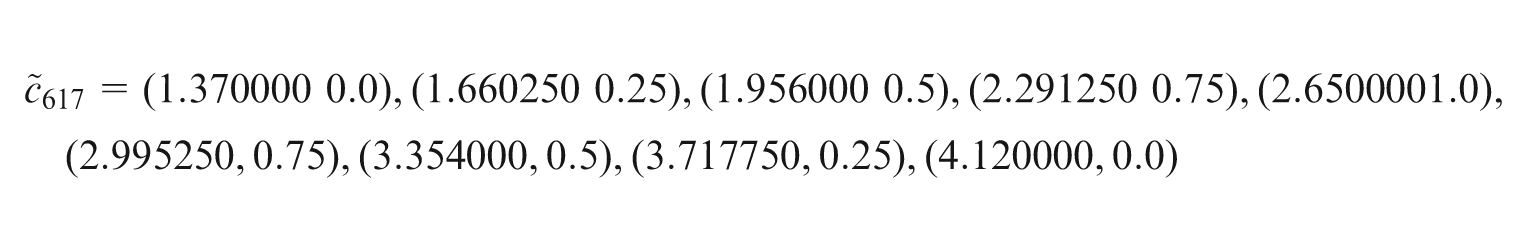
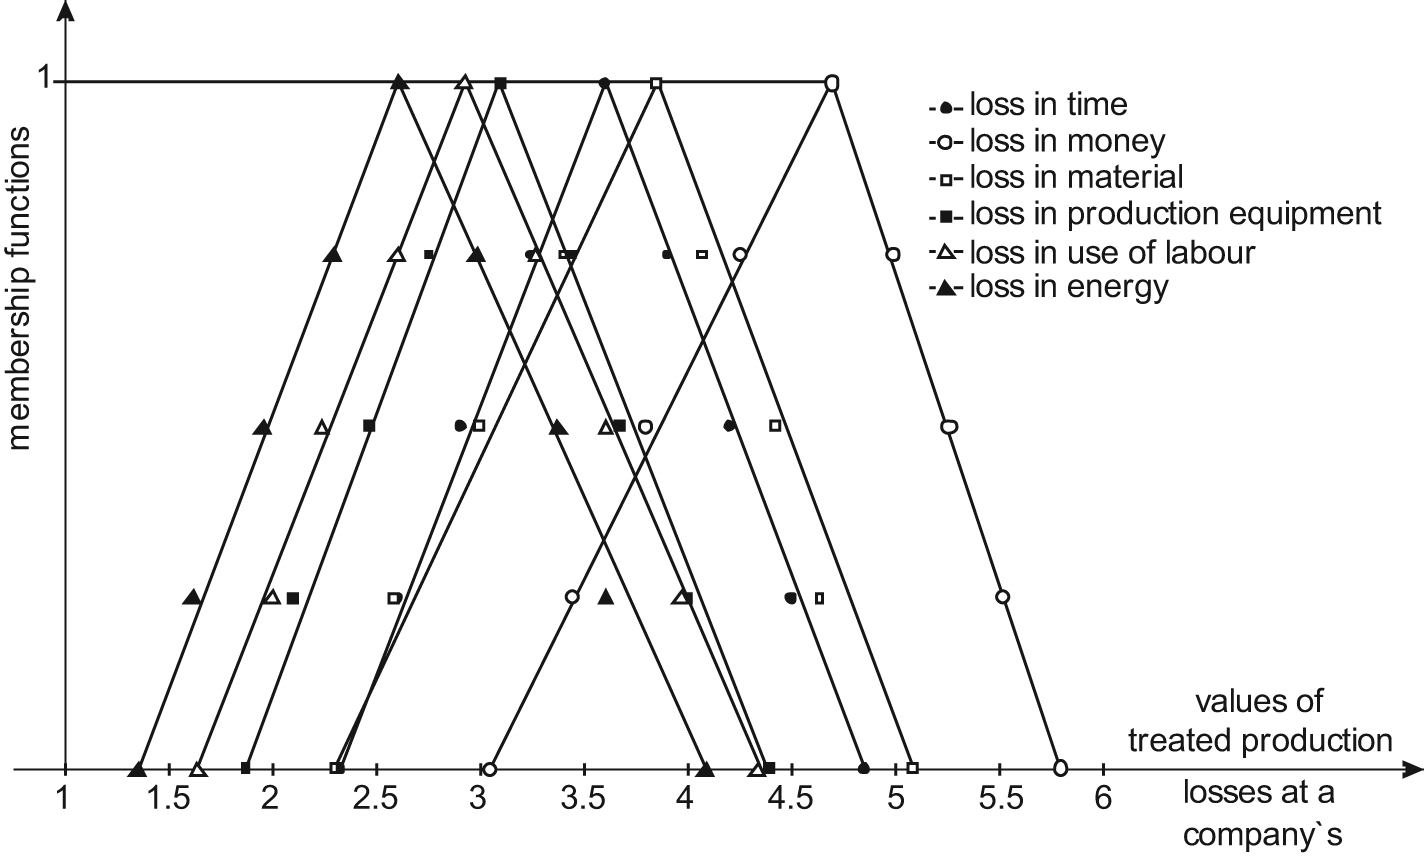
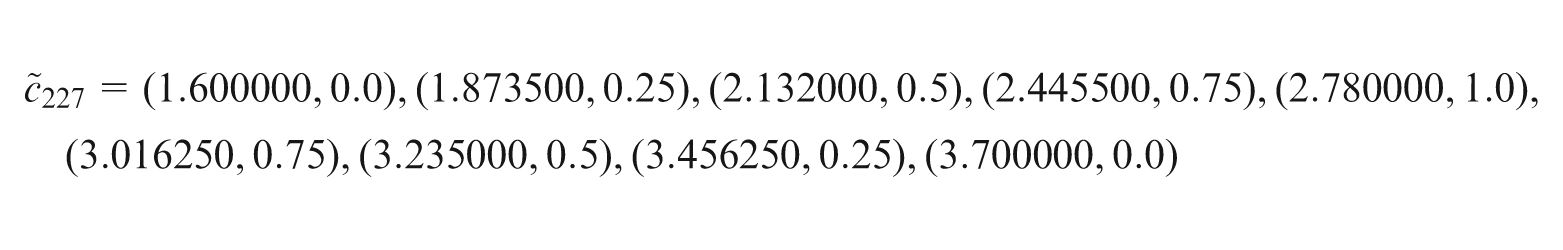
Discrete fuzzy numbers describing business loss values at the company p = 17.
The rank of business losses in a chosen company and degrees of belief that it is possible for business loss i, i = 1, …, I, to take the first position in rank are calculated applying the algorithm (Step 4 to Step 5). The obtained results are presented in Table 4.
Rank of business losses and degrees of belief in the chosen company.
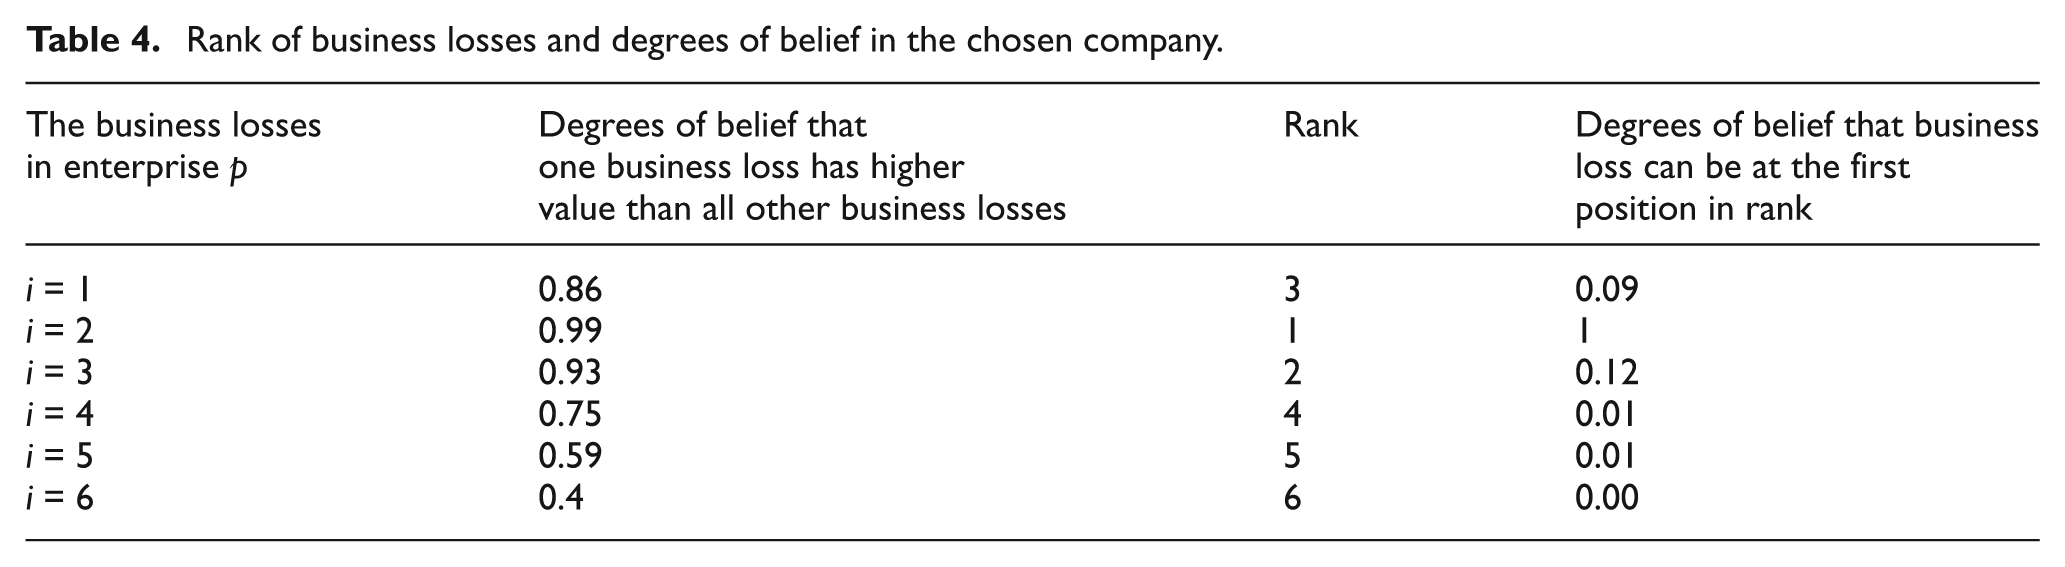
Considering the given results (see Table 4), it can be concluded that in the treated company (p = 17), there is the greatest possibility for the formation of business losses in money (i = 2). The second place in rank is taken by the loss in material and the third by the loss in time. The degrees of belief that business losses taking the second and the third positions in rank can be found at the first place are very low. The results obtained indicate that the management team’s attention should be directed to taking measures that result in the reduction in loss in money.
The details of calculating business loss in money at the sample level of 27 SMEs operating business in central Serbia are given. The business loss in money at the level of each SMEs is calculated by using proposed software. The calculated values are as follows


The value of this identified business loss is calculated by the proposed algorithm (from Step 6 to Step 7)
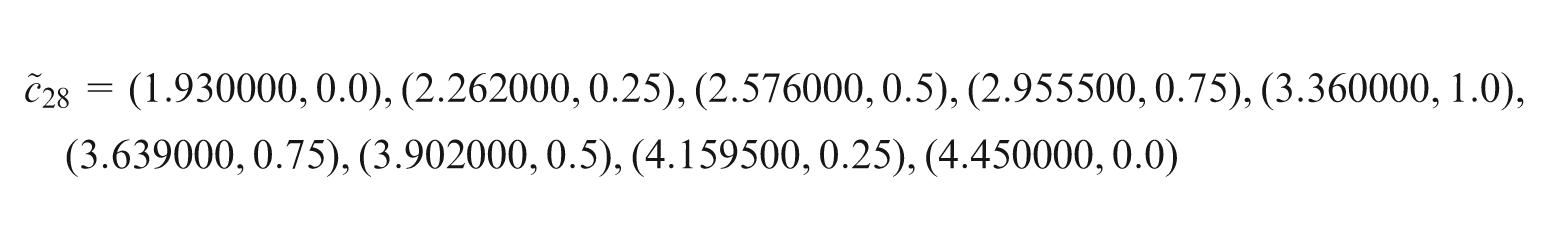
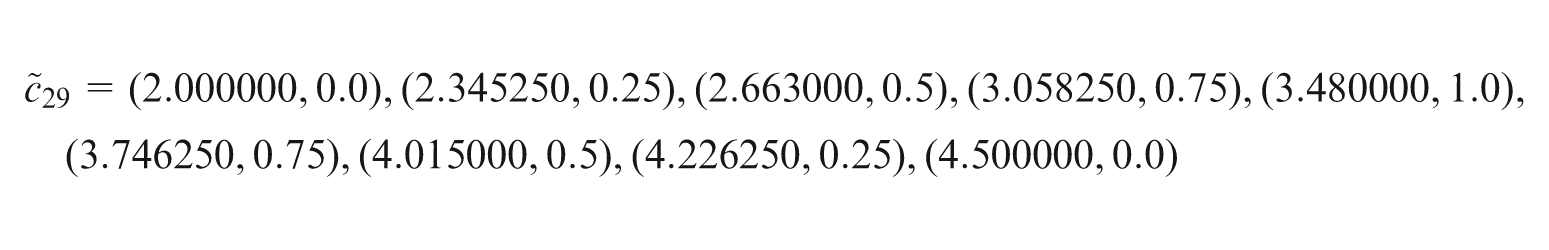
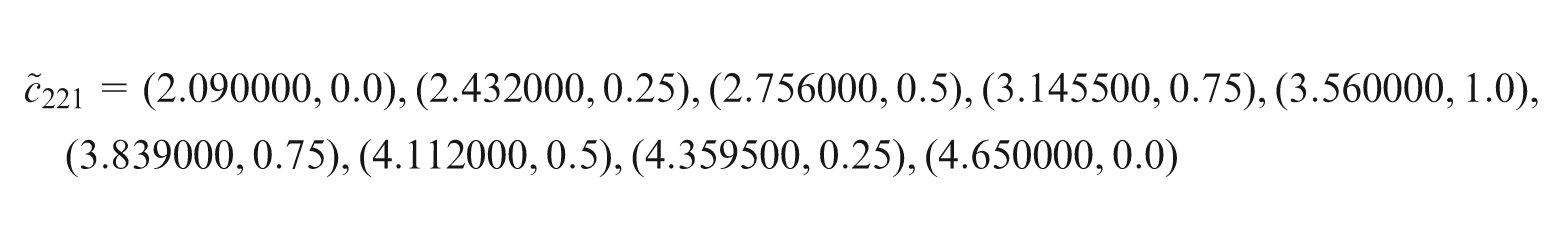
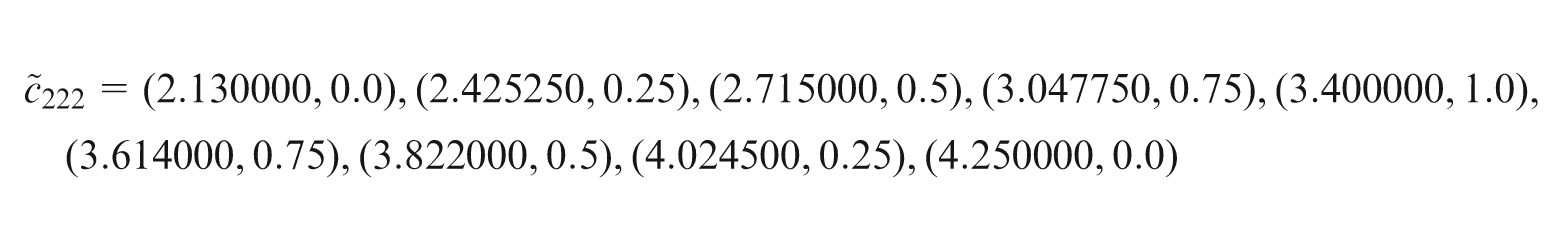
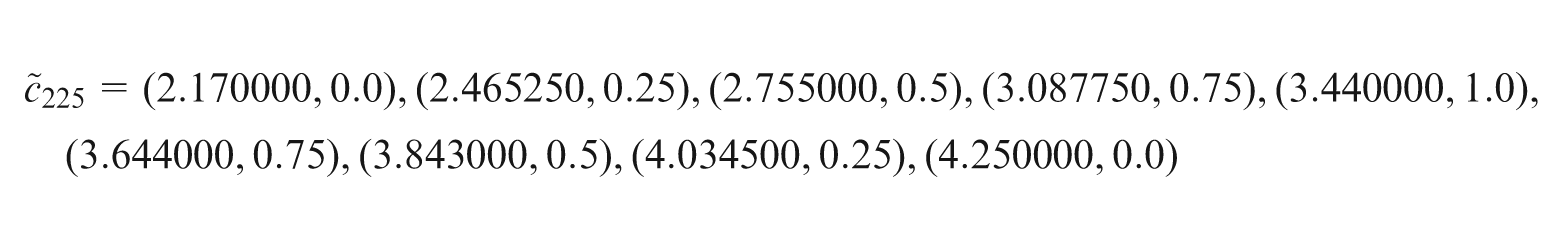
In similar way, the values of all business losses at level of all SMEs are calculated and presented in Figure 4.
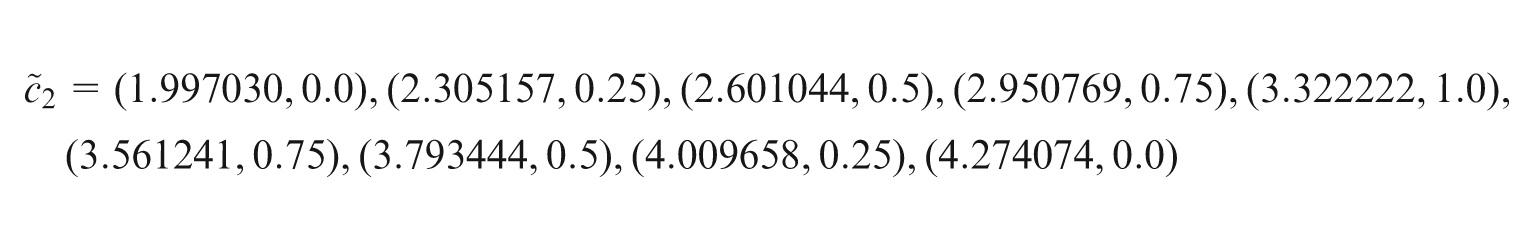
Discrete fuzzy numbers describing business loss values in SMEs operating business in central Serbia.
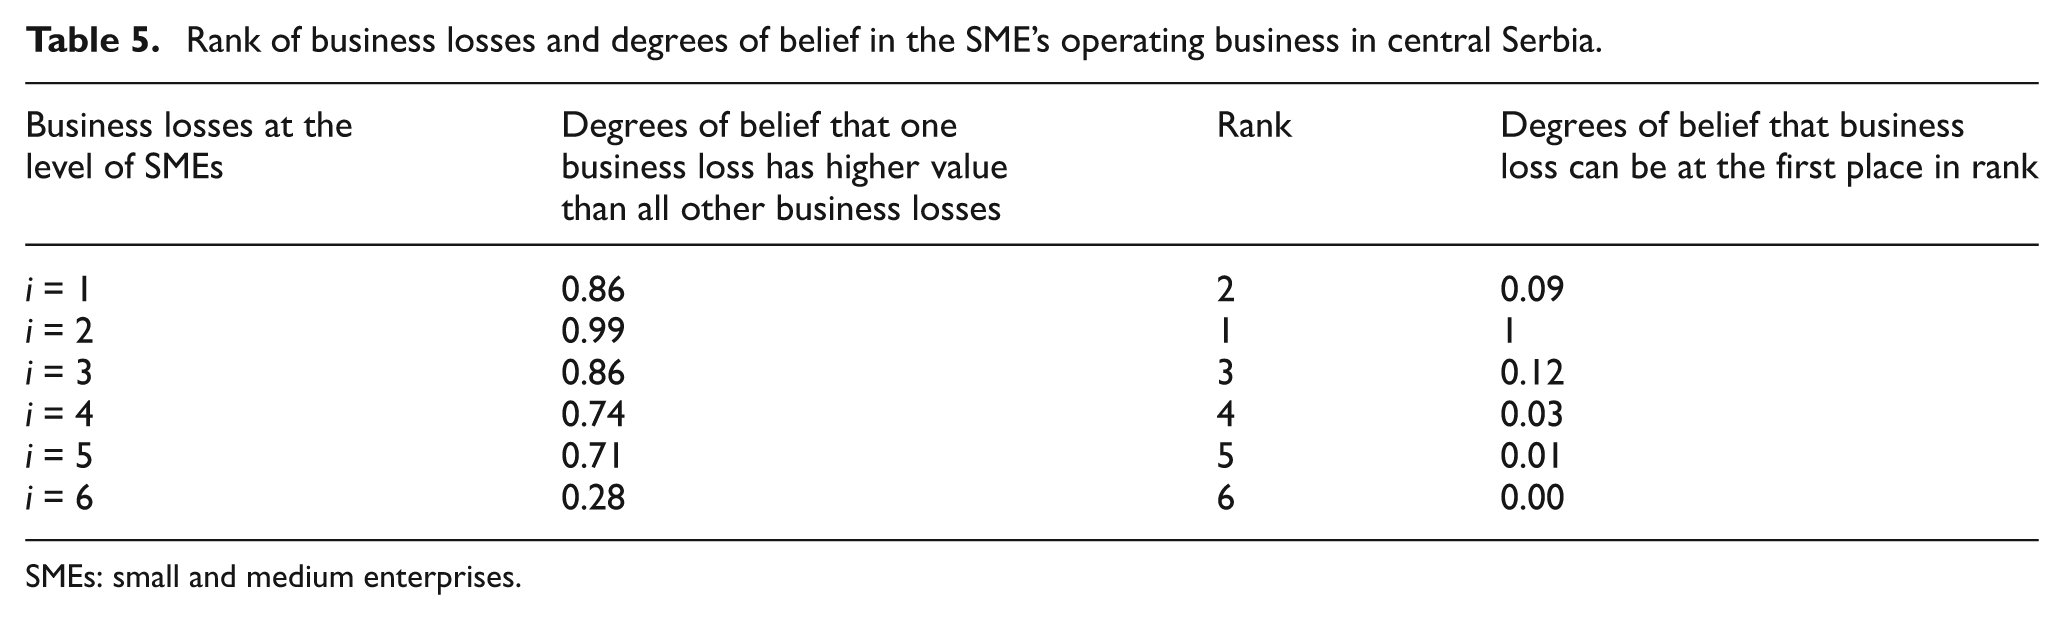
In Table 5, the rank of business losses in SMEs operating business in central Serbia is presented.
Rank of business losses and degrees of belief in the SME's operating business in central Serbia.
SMEs: small and medium enterprises.
The results presented in Table 5 led to the conclusion that loss in money has the greatest possibility to occur in SMEs operating business in central Serbia. Loss in material and loss in time take the second position in rank. The degrees of belief that these two business losses are greater than all business losses considered are equal and their value amounts to 0.86. Based on the calculated degrees of belief that it can be said for business loss to be at the first place, we can conclude that loss in money at the level of SMEs operating business in central Serbia has the highest predisposition to take the highest place.
Discussion
The analysis of results obtained for 27 manufacturing SMEs (see Table 5) indicates that loss of money has the highest predisposition to occur. It can be said that given results are expected. In all developing countries, like Serbia, business operations of any organization are associated with a shortage of financial resources needed for business initiation and maintenance. This problem is particularly present in SMEs. The result can be considered relevant to each considered manufacturing SME.
Decrease in loss in money value can be achieved by taking corresponding management measures, whereby the value of causes leading to the formation of loss in money is reduced. In order to decrease irrational capacity use, it is necessary to carry out the analysis of conditions of equipment capacity use and to establish the degree of capacity use for each type of equipment (e.g. applying the work sampling method, continuous measurements method).
Increase in capacity use level is achieved applying the following management measures: proactive approach to equipment maintenance, reduction in lead time, greater engagement of workers, and so on. Change in production program, which means diversification and/or modification of products and services of any enterprise, is one of the most significant decisions by strategic management. Decision making on the change in production program requires the application of lean production methods. For instance, marketing management should carry out market analysis that means, among other things, to find out the possibility of product and service placement at the market in order to increase the enterprise’s competitive position. The analysis of possibility to change the production program is the task of development management.
The concept of resource refers to machines and equipment, materials, tools, energy, employees, information, and financial resources. Reduction in this cause value in each SME is realized first via downsizing and/or manufacturing equipment sale.
Low-level organization of production processes, technology, and work methods and inexpedient construction of engaged resources can be decreased by applying the principles of lean organization. 28 Irregular supply of raw and other materials is solved most efficiently by realizing the supplier relationship, as defined by the total quality management (TQM) concept. Supply time and costs are reduced in this way, but reliability of the supply process is simultaneously increased.
Lack of coordination of the overall business can be described as delay and decreasing of output result quality. Decrease in this cause can be achieved by improving employees’ communication and coordination of work tasks between business processes. Management of human resources, process management, and quality management are responsible for determining and monitoring of measures that should lead to this cause value decrease.
Conclusion
Income statements of many companies, primarily in developing countries, show poor operating results. It has almost become a rule to justify such conditions by the lack of financial resources. Many practitioners and researchers have shown that in a large number of companies, one or more business losses occur over time. Managers consider that an important issue in increasing management efficiency is to estimate the exposure to possible business losses for each company. Therefore, the considered problem is one of the most important management problems in all industrial firms operating in uncertain environments.
In general, business loss ranking problems adhere to uncertain and imprecise data, which cannot be expressed by numerical values. It is appropriate to use linguistic expressions instead of numerical values for describing all uncertainties that exist in the considered problem. Modeling of linguistic variables is based on the fuzzy set theory.
In this article, all uncertainties and imprecision present in the considered problem are modeled by discrete fuzzy numbers. The relative importance of causes and their values and corresponding membership functions were made by consensus of the management team.
As a contribution to real-life practice, the method was implemented in software solution that provides a flexible, user-friendly environment for management teams, stakeholders, and so on. The method and software could be very useful for (1) managers of many organizational parts to improve management of their processes, (2) top management of the company to increase the efficiency of its business operations, which further makes the company more competitive at the market, and (3) the government that plans economic development of SMEs.
The proposed method is flexible: the changes, such as those in the number of causes or their relative importance, and the membership functions’ shape of fuzzy numbers (1) can be easily incorporated into the model and (2) can be easily extended to the analysis of other management decision problems in different research areas.
In addition, it is demonstrated how to use the proposed algorithm to determine the measure of belief that business loss located at the second and lower place has greater value than the value of business loss located at the first place. This can lead to more efficient and effective management.
Footnotes
Appendix 1
Appendix 2
Declaration of conflicting interests
The authors declare that there is no conflict of interest.
Funding
This research received no specific grant from any funding agency in the public, commercial, or not-for-profit sectors.