
Abstract
In the context of a world dominated by growing uncertainty, complex sociotechnical systems find themselves confronted with unexpected disruptions, which may lead to significant losses. To cope with these adverse events, modern sociotechnical systems constantly seek out ways of enlarging their ability to absorb and recover from disturbance, a capacity that we call resilience. With the aim of helping systems fulfill this mission, many research works have been conducted to develop methods for measuring, evaluating, and increasing the system’s resilience. One of the approaches, which arise from these works, is resilience engineering, a paradigm within which this article proposes a new structure of sociotechnical system processes, characterized by the introduction of resilience processes and their association with the other process categories. To illustrate the new proposed structure, we implemented a metamodel using the systems modeling language. Then, we focused on the resilience process behavior in a crisis through a qualitative and quantitative study accomplished by applying system dynamics approach. This article also develops a scoring system to assess the resilience of sociotechnical system processes and rank them based on the results.
Introduction
In recent years, resilience becomes increasingly in vogue. It is deemed as an effective weapon against the backdrop of the expanding complexity and the inherent uncertainty of an environment in which sociotechnical systems operate. Significant amounts of definitions were proposed for this buzz concept in several fields and a lot of them come from the concept of resilience engineering. Hollnagel et al. 1 defines resilience as the ability of a system or organization to respond and recover from disturbances at an early stage, with minimal effects on the dynamic stability. Resilience can also be considered, according to Leveson et al., 2 as the capacity of systems to prevent or adapt to changing conditions to maintain (control) the system’s properties. Becker 3 adds a societal dimension to the concept of resilience by defining it as “emergent property determined by the ability of the human-environment to anticipate, recognize, adapt to and learn from variations, changes, disturbances, disruptions and disasters that may cause harm to what human beings value. p.146.” In Figure 1, we present a balance of resilience meanings and bringing together the notions of resilience in several domains. 4 –6

The balance of resilience meanings.
In the broadest sense, resilience is the process that helps organizations to make their systems able to deal with disorganization, loss, and damage to maintain themselves and endure despite the obstacles emerging from the environment, history, or existence. It is also the result of this process that is noticed and can lead to recovery or even rebirth. 7 Under the umbrella of sociotechnical systems theory that was developed at the Tavistock Institute in London in the late 1940s, 8 Hollnagel, Woods and others have carried out various works aimed at transforming systems so that they can emerge after disasters. These works gave birth to the discipline, mentioned earlier, called resilience engineering. Beyond the initial goal of safety management methods, which is overcoming risks, resilience engineering looks for ways to enhance the ability of organizations to monitor and revise risk models, to create processes that are robust yet flexible, and to use resources proactively in the face of disruptions or ongoing production and economic pressures. 9 Additionally, this school encouraged the process-oriented management to enable systems to react as quickly as possible to changes. 10 A process, being a keyword in this way of management, is a completely closed, time-logical sequence of activities that are required for working on a process-oriented relevant business object. 11 These activities are divided into tasks, which are sequenced into workflows. These tasks are performed, while following procedures, by roles or actors to transform inputs that may be in the form of substance, information, energy, and so on, into outputs, using different kinds of resources (financial, human, natural, information technology, production, etc.). 12,13 Currently, an in-depth attention is given to process modeling. Academics resort to this research method to enhance the performance of processes. Since resilience can be considered as a new dimension of performance, alongside effectiveness and efficiency, process modeling can be used to improve the resilience of sociotechnical system processes. By taking this approach, the present article revolves around a three-fold objective: shedding light on the positive effect of restructuring system processes by introducing resilience processes as an integrated part of the traditional well-known structure of sociotechnical systems, exploring how a resilience process intervenes in the wake of a crisis, and putting forward a new scoring system that considers an assessment of the resilience of sociotechnical system processes. To achieve this objective, the remainder of this article is organized as follows: the next section illustrates the new proposed structure of sociotechnical system processes with a conceptual metamodel. The section entitled “System dynamics modeling” underlines the important role played by resilience processes in ensuring the resilience of sociotechnical system processes when faced with a danger. It also describes the methodology for process ranking according to the assessed level of resilience. Conclusions are made and opportunities for future research are discussed in the last section.
Process modeling
Resilience engineering can be considered as a subdomain of systems engineering. The latter can be considered as an interdisciplinary approach that design and realize successful complex systems, which can carry out valuable functions in an optimal manner. 14 From its perspective, a model is used to specify the design of the system with all its components including processes as well as manage the entire life cycle of the system. 15 To design process models, we widely use metamodeling. It is the activity of constructing metamodels, which constitute a formal specification of models and help to analyze and understand them. 16 Elaborating metamodels requires the use of modeling languages. Many requirements related to process modeling languages have been identified in the literature. They vary from facilitating human understanding, to analyzing processes, or to providing an automated execution support. 17 One of the most largely used languages is the Unified Modeling Language (UML), which is an international object-oriented standard specified by the Object Management Group (OMG). At the beginning, it has been specified to describe, in an easy understandable way, software projects. However, with the apparition of UML 2.0, it becomes exploitable to describe any type of system. 18 The adaptation of UML for systems engineering has the name of Systems Modeling Language (SysML).
This is a general-purpose graphical modeling language for specifying, analyzing, designing, and verifying complex systems. 19 Among its most important diagram types, we choose the block definition diagram, which is a stereotype of the UML class diagram with additional restrictions and extensions defined by the SysML metamodel. 20 The block definition diagram describes the structure of the system and the relationships among blocks, which are basic structural elements aiming to specify hierarchies and interconnections of the system to be modeled. 21
In reference to the paper by Wang et al., 22 five modeling constructs for sociotechnical systems are presented: (1) domain that can be technical or social, (2) aspect, which is a grouping of entities (regulations, laws, etc.) belonging to the social domains and possibly having an influence on the technical domain, (3) context-of that is the relationship between an aspect and another object, (4) agent/agent group such as users, individuals, and societies, and (5) stage that is the system’s status (normal and exceptional).
In our case, we propose a sort of instantiation of these modeling constructs. In fact, we take a process as a sociotechnical domain, because the human component is omnipresent (actors, resources, etc.), and activities as objects of the domain. In addition, regulations and policies in the social domain can negatively affect the functioning of the sociotechnical domain and thus represent a risk factor for the latter. According to the context, we say that a risk factor can generate disturbances on the process. For agents and agent group, we mention, by way of example, actors, authorities, external clients of the system, and so on. This study take an interest in a system that has an exceptional status (under disturbances).
As shown in Figure 2, we used the block definition diagram to construct a conceptual metamodel representing the different processes of a sociotechnical system (Figure 2).

A conceptual metamodel of sociotechnical system processes.
We present below a kind of glossary regrouping the definitions of the various concepts and relations appearing in the metamodel: A process is triggered by one or more events. A process aims to achieve one or more objectives. Depending on the structure of sociotechnical system, a process can be broken down into sub-processes, which are themselves processes, or into activities. One or more actors can perform an activity. An activity can use one or several inputs to produce one or several outputs. An output from a process can play the role of an input for another process. An activity is a succession of tasks, which can be defined as elementary or atomic activities that cannot be subdivided. A task can be carried out under one or more conditions. We can distinguish between four main categories of processes: business, support, management, and resilience. Processes belonging to these categories are interrelated. Management processes identify the necessary resources that must be allocated to the activities of a certain process. Support processes provide and make available the resources needed already defined. Business processes use the resources provided. Resilience processes intervene in the event of an anomaly or incident to avoid the unavailability of resources and thus, the interruption of activity. Sociotechnical system processes are exposed to numerous risk factors. Risk factors can cause disruptions in the operation of the system. Disturbances can turn into failures. Disturbances and failures are considered as trigger events for resilience processes in particular. Several indicators are put in place to evaluate sociotechnical system processes. These indicators can be related to time, costs and benefits, resources, quality and resilience.
This metamodel shows that a novel process category containing resilience processes is involved. This invites to raise questions about the utility of integrating this category into the structure of sociotechnical system processes and the way in which resilience processes can ensure system functioning in crisis periods.
The next section will provide interesting answers to these questions.
System dynamics modeling
Jay W Forrester initiated system dynamics (SD) in the late 1950s. It is a multidisciplinary subject, which basically deals with the study of any dynamic system. Fundamentally, it deals with feedback mechanisms and is built on cause and effect relations among the factors influencing the system under investigation. 23
Feedback loops have their place among the basic principles of SD modeling. A feedback loop can be described as a closed chain of causal connections from a stock, through a set of decisions or rules or physical laws or actions that are dependent on the level of the stock, and back again through a flow to change the stock. 24
To represent feedback loops along with different causal links between variables and polarities of the links (positive when both the cause and the effect move in the same direction and negative otherwise), we can use causal loop diagram (CLD), which is a systems modeling technique utilized to qualitatively explore variables and interrelationships of a system of interest. 25
In our case, we need to gain a better understanding of how a resilience process intervenes in case of disruption for the purpose of helping sociotechnical system processes to survive and strengthening their resilience. To reach this goal, a CLD is drawn up, in Figure 3, using the Vensim PLE for Windows software (Version 7.2a Single Precision [x32]: Ventana Systems, Inc.), which is an integrated environment for the development, analysis, and application of SD models. 26
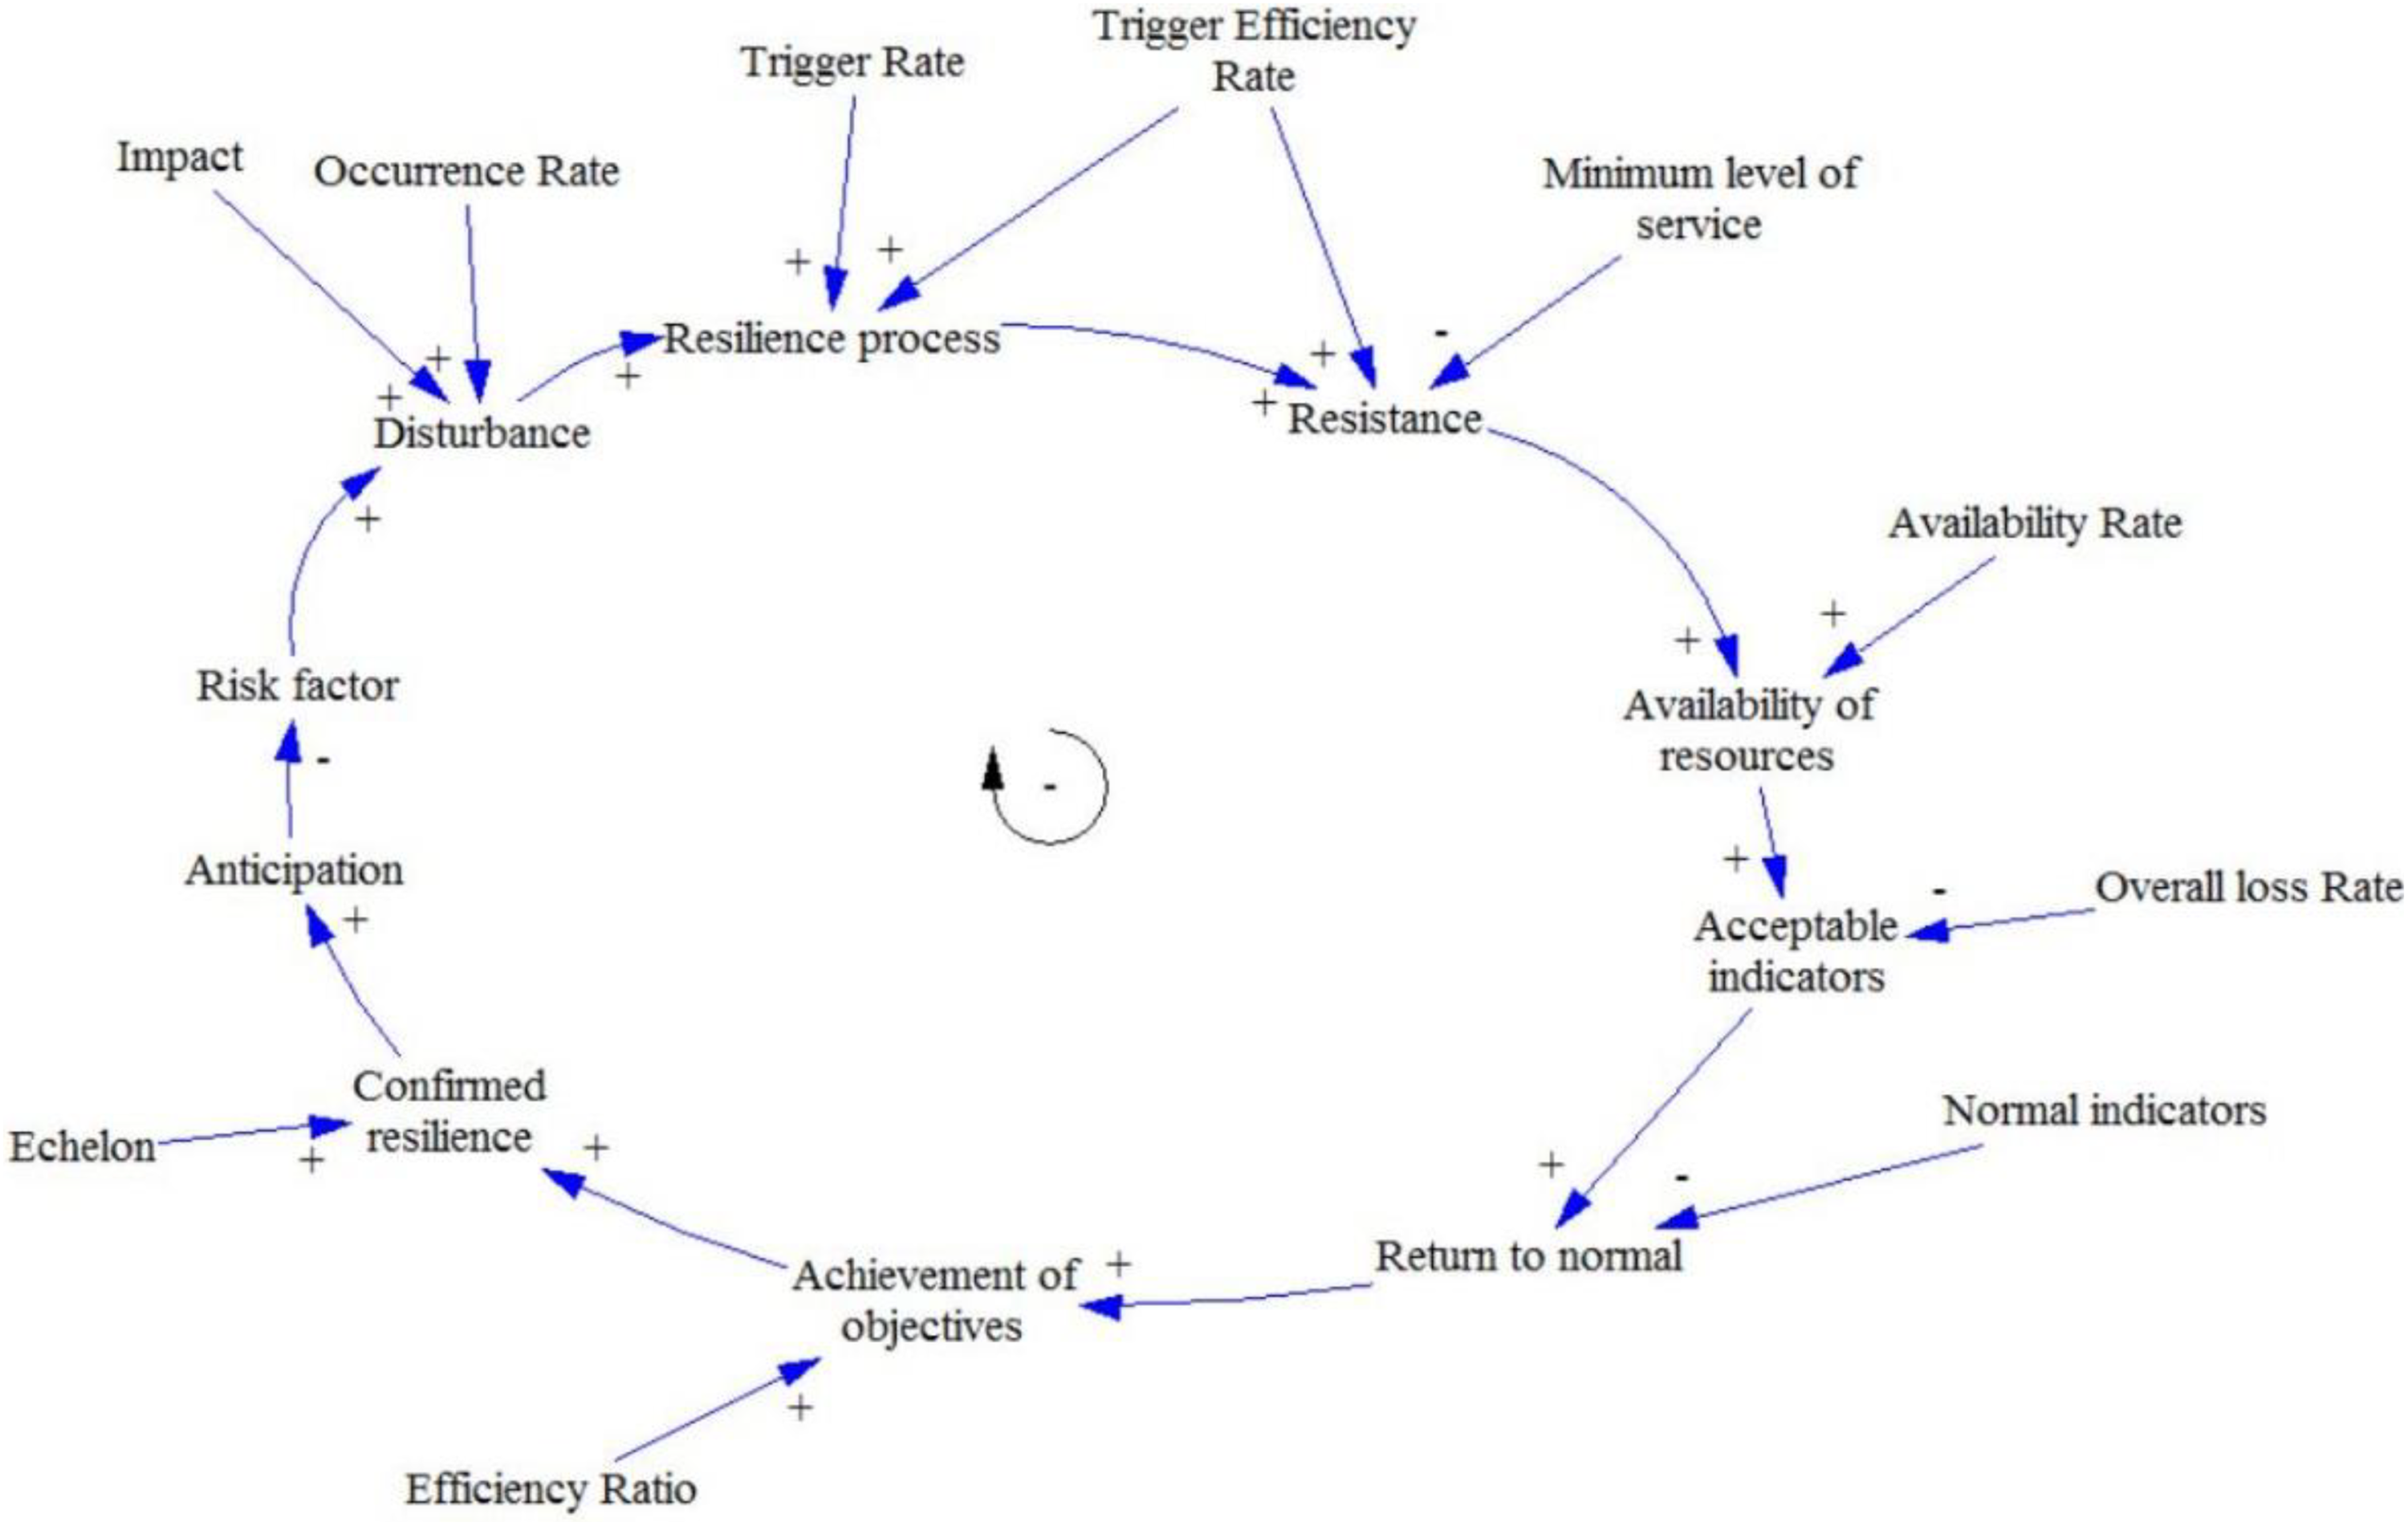
A CLD of resilience process intervention in case of disturbance. CLD: casual loop diagram.
In the Figure 3, there is one negative feedback loop. This loop shows that a significant presence of risks gives more chances to a generation of disturbances. The higher the rate of occurrence and the impact of the disturbance, the greater the trigger rate of the resilience process is. Moreover, the higher the rate of effectiveness in triggering the resilience process, the greater the resistance of the process affected by the disruption is. As a result, resources remain available despite the difficulties, which guarantees the acceptability of indicators (costs, deadlines, quality, etc.). The closer to normal the acceptable indicators, the more assured the return to normal operation would be. This return will allow the process to achieve its objectives (measured by the efficiency rate). If the process succeeds in achieving its objectives, it means that it is resilient since it has been able to accomplish its mission under such conditions. A resilient process must be able to take anticipatory measures to manage better the situation if this happens again.
We define some variables appearing in the CLD in Table 1:
Description of some CLD variables.
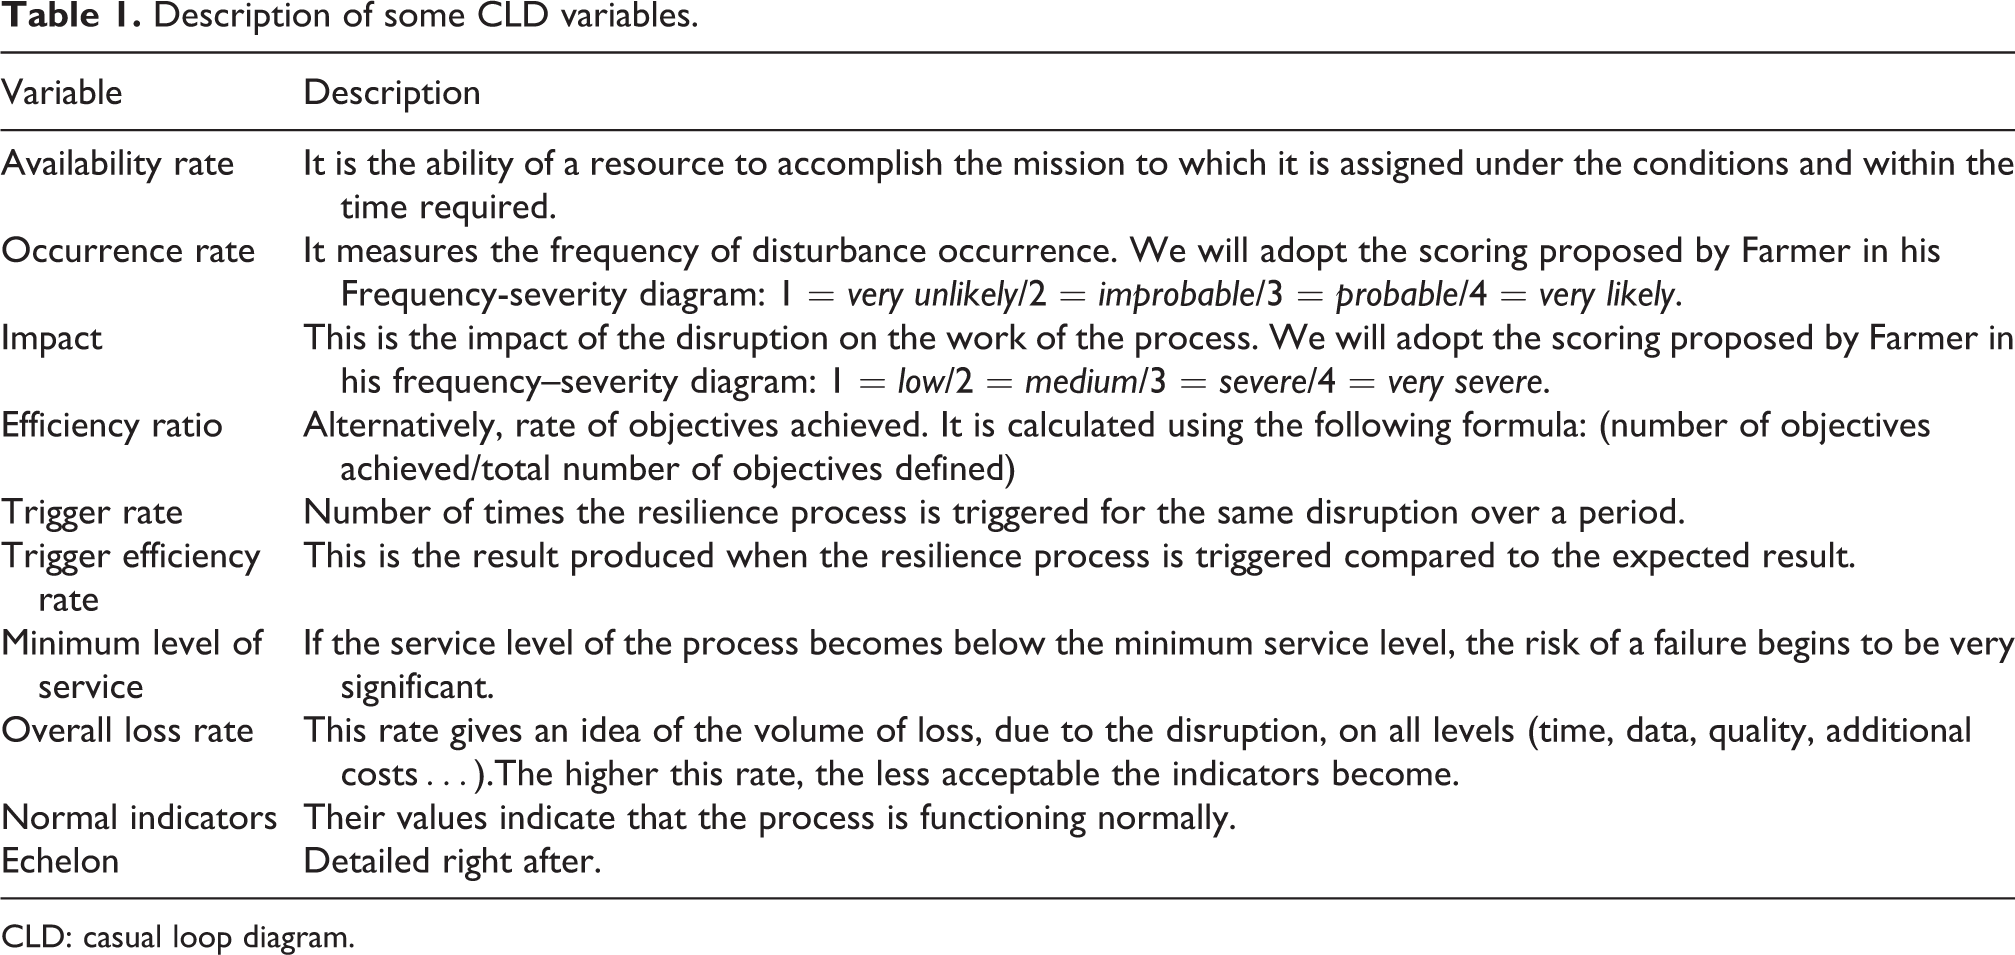
CLD: casual loop diagram.
To be able to assess the resilience of a process, we propose a scoring system named the resilience scale. It is composed of five echelons (Figure 4).

Resilience scale.
Echelon 0: The process is unconscious of resilience. No resilience process is associated with it. Faced with anomalies, the process reacts arbitrarily and tries to get out of it. The consequences on costs, deadlines, and quality are far from negligible. Echelon 1: The process is warned of resilience. It does not yet have an elaborate resilience process. However, it is aware that resilience is an asset that it lacks and that it absolutely must have. It has developed a strong knowledge of the subject and it only remains for it to apply itself. Echelon 2: The process is aspiring. It is a beginner and tries to set up resilience processes by analyzing the risk factors to which it is exposed and by taking into consideration frequent crises. Echelon 3: The process is progressing. It overcome less serious disturbances within a reasonable time without or with negligible impact on the conduct of the activity. However, the consequences can be more dramatic in serious situations. Efforts are being made to improve mechanisms of resistance, recovery, and anticipation for this type of disruptions. Echelon 4: The process is expert. Anticipated situations, which constitute the majority of situations confronted, are perfectly manageable. As for unforeseen situations, the process tries to adapt to changes without ceasing the activity and stopping the continuous search for a return to normal functioning. This return does not take too long and the resulting costs are not considerable.
To complete our study, we turn now to the quantitative aspect. To do this, we will construct, from the CLD, a stock and flow diagram illustrated in Figure 5. This diagram uses three main types of elements: stocks, flows, and auxiliary variables and introduces the time dimension by considering the rate of change in the level of variables over time. 27

Stock and flow diagram of resilience process intervention in case of disturbance.
Table 2 groups the different variables appearing in the stock and flow diagram:
The stock and flow diagram variables.

To run our model, we will consider two process cases. The first is an aspiring process with a resilience echelon that equals two and the second is a progressing process with a resilience echelon that equals three. We assume that both processes have undergone a probable (rate of occurrence = 3) and severe (impact = 3) disruption. Since disturbance is frequent, the rate of triggering the resilience process will be high. It is thus assigned, for example, a value of 0.6 (60%). Given that the first process is aspiring, the effectiveness of triggering its resilience process will be modest. This rate can have the value “0.35 (35%).” On the other hand, the progressing process benefits from a reasonable trigger efficiency rate. In this simulation example, we will take 0.65 (65%). The minimum level of service is considered 0.4 (40%). For both processes, the rate of effectiveness of triggering the resilience process determines the rate of resources availability. Consequently, for the aspiring process, the availability rate will be 0.35 (35%), while it will be 0.65 (65%) for the progressing process. The more resources are available, the less losses (time, financial, informational, etc.) are recorded. Therefore, for the aspiring process, the overall loss rate will be 0.65 (65%), while this rate will have only 0.35 (35%) as a value for the progressing process. The normal indicators are set at 0.6 (60%). Obviously, the effectiveness rate will differ from one process to another. In this example, it is assumed that the aspiring process achieves only 30% (efficiency ratio = 0.3) of its objectives, while the progressing process achieves 60% (efficiency ratio = 0.6).
In Table 3, we will find a summary of all the values allocated, within the framework of this simulation example, to the auxiliary variables constituting our model.
Values for simulation.

The model simulation results for both processes are displayed in the two graphs below (Figures 6 and 7):

Simulation results for the aspiring process.

Simulation results for the progressing process.
By comparing the two graphs, we can formulate the following remarks: For the aspiring process, the value of the disturbance (numeric value = 249) is more important than that of the progressing process (numeric value = 120). The disturbance affecting the progressing process disappears on the 8th day, whereas it disappears only on the 14th day for the aspiring process, knowing that the disturbance started at the same time for both processes (2nd day). The initiation of the resilience process is related to the volume of the disturbance. This explains why the value of the resilience process for the aspiring process (numeric value = 372) is more important than for the progressing process (numeric value = 130). However, the resistance of the process is related only to the trigger efficiency rate and not to the launch itself. It is for this reason that the resistance of the progressing process is better than that of the aspiring process, and the same goes for the availability of resources (at day 22, we have, as numeric value, 5 for the aspiring process versus 60 for the progressing process) and the establishment of normal functioning (at day 22, we have, as numeric value, 128 for the aspiring process versus 360 for the progressing process). The evolution of confirmed resilience over time is relatively slow for the aspiring process (numeric value = 30 at day 10), which is not the case for the progressing one (numeric value = 130 at day 10). For both processes, the intervention of the resilience process is not completed directly after the end of the disturbance because anticipatory measures must be taken to avoid repeating the same scenario (it continues to operate 4 days after the disappearance of the disturbance for the aspiring process and 3 days for the progressing one). In general, the intervention of resilience process for the aspiring process is longer (14 days) than that for the progressing one (8 days).
All these findings listed above affirm that within a sociotechnical system, every process must be associated with a resilience process set up in such a way as to continuously develop the resistance of the relevant process to operational disturbances that can be sources of major failures. This resistance helps the process to resume its normal activity easily and quickly. The resilience process must also aim to analyze the disturbances encountered and to study their causes (risk factors) as well as their impact and frequency to avoid or at least anticipate their occurrence and subsequently limit their consequences. During these steps in the execution of the resilience process, there is a clear improvement in the resilience of the process affected by the disturbance. This ability to remedy disturbances makes the process more robust in crises, minimizes losses, and accelerates the return to normal operation.
In short, one of the most noteworthy practical implications is that the proposed structure of sociotechnical systems (not only enterprises, but all kinds of sociotechnical systems; for instance, academic institutions, governmental institutions, etc.) includes a category of processes called resilience processes that help the core processes to adapt to challenges presented to them and rapidly recover from disruptions. In other words, this category makes them more resilient to shocks.
Conclusion and further work
In this work, we have approached the management of sociotechnical system processes using resilience engineering. We considered resilience as a category of processes in its own right. This category includes processes that help other processes in the system to overcome difficulties by increasing and strengthening their resilience, that is, their ability to adapt to a crisis. To model the processes of sociotechnical system, we opted for SysML because of its many advantages. We have drawn up, by means of a block definition diagram, a metamodel that draws its originality from having revealed resilience processes, their triggering modalities as well as the role they play in avoiding the unavailability of resources and consequently the interruption of activity. To outline this role, we used SD modeling. We selected a set of variables based on the three main missions of a resilience process: resistance, recovery, and anticipation. Among these variables is the echelon.
Actually, resilience can be considered as a criterion for evaluating sociotechnical system processes in terms of maintaining business continuity in the presence of anomalies. In this context, we have set up a scale, called the resilience scale, which aims to assess the level of resilience of each process. The resilience scale defines five echelons: unconscious, informed, aspiring, progressing, and expert. For each echelon, the resilience scale identifies the characteristics that need to be satisfied by the process and that allow the transition to the next echelon. We constructed a CLD composed of a single negative feedback loop since it tends to mitigate risk factors and therefore disturbances. We then converted this diagram into a stock and flow diagram before making a simulation at the end of which we were able to draw decisive conclusions.
This qualitative and quantitative study allowed us to highlight and understand the role that resilience processes play in improving the resilience of sociotechnical system processes and thus, the evolution of the latter from one echelon to another.
In future work, we will try to explore in detail the functions of a resilience process in ordinary circumstances (risk assessment). We will propose a risk matrix, which is a 4 × 4 table that results from dichotomizing two axes, namely the impact of the risk factor on the core metrics (costs (abnormal expenses), time (deadlines), quality and resources), and the degree of development of contingency plans (or plan B). For high risk areas, we will need to develop and test plan B. Regarding the extraordinary circumstances, we will explicitly define the three missions discussed in this article: resistance (the intervention of resilience processes by activating plans B to ensure the availability of resources and the continuity of the activity), recovery (declaring the crisis situation terminated and providing the necessary support), and anticipation (evaluation and learning lessons from bad experiences). This work will allow having a global visibility of how a resilience process operates and help us to set up a complete and fully developed SD model. We will also formulate a questionnaire for the rating of processes as per their level of resilience. To do this, we will use as a basis some already existing methods, notably the resilience analysis grid. 28 Once prepared, we will apply it to a sociotechnical system in real life. We will then use SPSS (Statistical Package for the Social Sciences, Version : IBM SPSS Statistics Base 22.0. Vendor : IBM) to analyze the answers and identify the processes for improvement. Finally, we will transform all those achievements into a computerized decision-making tool that will be made available for sociotechnical systems to enable them to remain competitive against all the risks they face.
Footnotes
Declaration of conflicting interests
The author(s) declared no potential conflicts of interest with respect to the research, authorship, and/or publication of this article.
Funding
The author(s) received no financial support for the research, authorship, and/or publication of this article.