
Abstract
This article offers a network perspective on the collaborative effects of technology transfer, providing a research methodology based on the network science paradigm. We argue that such an approach is able to map and describe the set of entities acting in the technology transfer environment and their mutual relationships. We outline how the connections’ patterns shape the organization of the networks by showing the role of the members within the system. By means of a case study of a transnational initiative aiming to support the technology transfer within European countries, we analyse the application of the network science approach, giving evidence of its relative implications.
Introduction
Over the past decades, technology transfer has become an important instrument for external acquisition of technological knowledge, resulting in a remarkable increase in the number of technology transfer agreements between different entities. Such a rising trend has led to the emergence of complex innovation networks that develop in response to changes within the economic environment. 1 These organizations are able to achieve sustainable competitive advantage as they allow members to gain access to critical resources beyond the boundaries of their own assets. Thus, organizations performance can be related not only to their internal knowledge and their intangible assets 2 but also to the effects of networking.
The growing importance of such networks shows that partners are increasingly involved in relationships with other members and, consequently, positions are also affected by the overall structure of the network. 3,4 Indeed, innovation networks create opportunities for members that benefit from the access to their partners’ resources and also, to a certain extent, to those with whom the other members are connected.
From this perspective, the advent of globalization has increased the opportunities of technology transfer across borders, with innovation networks emerging as tools that enable members to foster their innovation capabilities and spread knowledge beyond expectations. 5
Various definitions of technology transfer have been provided by literature, and in recent times, there has been a shift from a single relationship interaction to more complex, multiple, interdependent, intersectorial organizational architecture. 6,7 For instance, in the study by Kedia and Bhagat, 8 the technology transfer is defined as an inter-organization process between supply and recipient organizations. Similarly, in the study by Autio and Laamanen, 9 it is defined as an intentional goal-oriented interaction between two or more social entities, during which the pool of technological knowledge remains stable or increases through the transfer of one or more components of technology.
Technology transfer networks can be mapped as inter-organizational innovation systems as they are considered an attractive ecosystem in which to generate innovation in various sectors, as well as being characterized by a recurring exchange of interactions among members that maintain residual control of their individual resources yet periodically, and jointly, make decisions regarding their use. 10 Within these systems, an innovation is not seen as the product of one member, but the outcome of the interplay between several partners participating in a self-organizing process in which order emerges due to the interactions between partners. 11,12 All members are simultaneously involved in the ongoing management of the network, and the resulting structure and performance is co-produced by their actions. 5,13
Members of such networks can be organizations, firms or research centres, located in diverse regions and linked by joint interests, as well as technologies and skills motivated by the decision to cooperate according to certain rules. Other examples of these kinds of networks are business incubators, technological districts and consortia established by international initiatives financed by the European Commission. Members are formally associated by joint ventures, licensing arrangements, management contracts, subcontracting, production sharing and research and development (R&D) collaborations. 1
Our analysis is performed by means of an empirical study of a real technology transfer network. We refer to the Enterprise Europe Network (EEN) that was established in 2008 by the European Commission and can be considered an instrument in the European Union’s strategy to support economic growth. One of the main expected results of the network is to increase the number of small and medium enterprises (SMEs) connected to other entities across Europe for cross-border business cooperation, technology and knowledge transfer and innovation partnerships.
Part of the literature has considered the technology transfer at transnational level, both as a mechanism in which country acquires, develops and uses technology knowledge 14 as well as the process of transferring the knowledge and concepts from one country to another. 15
This article maintains such an approach at country level, aiming to describe quantitatively the environment in which technology transfer evolves by means of the network science paradigm. 16 The network science is a tool to investigate systems by means of complex networks as mathematical abstraction for modelling and other multidisciplinary approaches to infer behaviours of various phenomena. 17 Complex networks model organizations composed of entities, called nodes, connected by relationships, defined as links 18 and in mathematical literature, they are called graphs.
Network science provides an approach at two different levels. The first offers an overall picture of the whole network organization and concerns itself with the emergence of recurrent phenomena; the other emphasizes the details of specific networks. This multilevel approach is widely used to represent systems in nature and science, such as the World Wide Web, the markets of interacting producers and consumers and the social environments. 17,19
The second level of approach in network science is performed mainly by means of the social network analysis (SNA). It is an instrument to conceptualize and investigate connections among social entities. In general terms, SNA can be considered as an archetype that abstracts social life in terms of connection structures among entities (communities 19 ) and measures of centrality. 20
For this second level, some approaches were presented in technology transfer literature, such as in the study by Vonortas, 21 where SNA is used in order to evaluate R&D programs; in the study by D’Alise et al., 14 in case of clusters of pharmaceutical industries; and in the study by Verspagen and Duysters, 22 where a particular, complex network organization is used to model technological alliances.
Some attempts, in order to study collaborative research effects in transnational networks in the European Framework Programme using SNA, were presented in the study by Heller-Schuh et al. 23 In the study by Roediger-Schluga and Barber, 24 a similar approach was presented with an outlook on the network degree distribution.
Technology transfer between network members establishes relationships that create patterns of knowledge 1 and causal linkages, 25 revealing effects considered imperfect and often subjected to different interpretations. 26 In order to mitigate the lack of knowledge on the underlying phenomena, in this article, we assert that stable patterns establish a correlation structure between members, which create a collection of links starting from various observable variables.3,27
The aim of this article is to extend the use of the network science approach to innovation networks by considering the organization of the observed systems and analysing the recurrent phenomena. In order to achieve this result, our contribution concerns the integration of the two described levels in a framework. Hence, this article is devoted to the definition of a general framework rather than a deep statistical analysis.
Theoretical settings
Network science is an emerging, interdisciplinary field of study aiming to understand not only the structure in terms of its organization but also the development and the dynamic of networks through different methods and tools attributed to several disciplines such as social science, mathematics, statistics, physics and computer science. 28
The mathematical description of networks is found in graph theory. A graph G = (V, E) is composed of a set V of n nodes, that represent the elements of the system, and a set E of m links, defining the interactions between nodes.
We refer to a member by an index i, meaning that we allow a one-to-one correspondence between an index and a member. A graph contains subgraphs such as G′ = (V′, E′) where V′ is a subset of V and E′ is a subset of E.
Network metrics and complex networks analysis measures
The graph representation allows for the calculation of several measures that reveal the network characteristics. Table 1 shows a short glossary of network measures. It also reports the current meaning in terms of innovation, drawing advantage from a summary of the different contributions in literature such as, for instance, in literature. 1,5,27,29 –31
A short glossary of network measures.

Many real networks exhibit a sophisticated spread of the node degree. Indeed, the connectivity distribution is more likely to follow a power-law function, that is, the probability P(k) that a node in the network interacts with k, other vertices, decays with the power law P(k) ∼ k−γ with slope γ as the scaling exponent. This distribution implies that each node has a statistically significant probability of having a high number of links compared to the average connectivity of the network.
Barabási and Albert 32 introduced these particular graphs (Barabási–Albert (BA) model) that have an inhomogeneous topology due to a relatively small number of highly connected nodes – hubs – and a large number of low degree nodes – spokes. Such topology gives a modelization of a common aspect in real environment, that is, few entities are very active having many relationships while the majority has few, at least unique, interactions. These systems are characterized by a low average path length, high clustering coefficient, which is much larger than in random graphs, as it decreases as the node degree increases with a power-law degree distribution occurring.
Scale-free graphs show two key features, namely growth and preferential attachment that are responsible for the power law observed in real systems that grow by the continuous addition of new nodes to the system and exhibit a preferential attachment mechanism meaning that the probability of connecting to a node depends on its assortment of connections.
In the BA model, the links’ inhomogeneity reflects the degree of members’ involvement in the network and the different role of hubs, semi-peripheral and peripheral members. Moreover, the BA model is characterized by self-organizing behaviour. 32,33 When a system presents such behaviour, we should expect a non-linear, sophisticated dynamic of interactions with a certain level of independence from the external environment. 34 The presence of scale-free organization is a suitable model to represent the structure of innovation networks 5,35,36 ; hence, this article follows this approach.
The network robustness represents one of the most interesting features of scale-free networks. Robustness refers to the capacity of the network to perform its basic functions even in the case of missing nodes and links. Related to robustness, the resilience is the dynamic feature that entails a change in the network’s essential activities. Resilience is the capacity of the network to adapt to internal and external errors by altering its processes while continuing to perform. 37,38
Real networks exhibit an unexpected degree of tolerance to the random deletion (errors) of their nodes due to their heterogeneity. Indeed, such breakdowns affect mainly the various small nodes that play a limited role in maintaining the networks’ integrity and their removal has limited impact on the graph’s structure. 39,40 Scale-free networks with γ ≤ 3 show a high robustness to random failure meaning that, to break such networks apart, virtually all nodes must be removed.
In general, once a small fraction of nodes is detached, the distance among the remaining nodes increases since some of the patterns contributing to network connectivity are eliminated. Thus, for the remaining nodes, it is more difficult to communicate with each other.
The attack refers to a removal process targeted to specific nodes, that is, those highly connected. In real networks, the deletion of a single hub does not fragment the system as the remaining hubs can still hold the system’s integrity. However, if the number of removed nodes reaches a critical threshold, the network suddenly breaks into disconnected components.
In scale-free networks, when the most linked nodes are removed, the diameter increases rapidly. 37 This vulnerability to attack is due to the inhomogeneity of the connectivity distribution. Indeed, the removal of the few highly linked nodes alters the network topology and decreases the capacity of the remaining nodes to communicate with each other.
Regarding the SNA, in this article, we focus on the centrality value that represents the node’s relative importance within a graph, with the assertion that the higher the centrality indexes of a node, the higher its perceived centrality in the graph. There are several quantities describing the centrality that depend on the type of statistics on which they are based; the most commonly used are presented in Table 2 with a brief description of their meaning in innovation networks, as better explained in the study by Ferraro and Iovanella. 27
A short glossary of centrality measures.

The proposed research methodology
The proposed research methodology integrates the ability to study the network organization and the emergent phenomena and computes the classical SNA measures. Figure 1 shows such a framework; one that is able to collect all of the aspects reported in the previous section. We distinguish two main phases: network modelization and network analysis.

The research methodology.
The first step in the methodology consists of mining the database and collecting data in order to build the network. The modelization phase is completed with the network visualization for inspection and reporting purposes.
After the modelling phase, the network analysis identifies classical measures, such as density, average shortest path and so on. The degree-distribution analysis phase tests the scale-freeness of the observed network and is then followed by centrality, robustness, assortative analysis and community detection.
The detection of the network organization is particularly important and Table 3 summarizes some key features of random, small-world and scale-free networks and the related meanings in terms of knowledge transfer. In general, we refer to the wider literature when discussing three particular network organizations, while here we refer mostly to the studies by Choi et al. 3 and Barabási 41 and the references therein.
Note that the framework has a modular structure and new analysis can be added as, for instance, the homophilic analysis 5 and the information spreading study. 3
Network organization and its influence on technology transfer.

The case study: The Enterprise Europe Network
Herein, we consider as a case study the Enterprise Europe Network (EEN). The EEN activities directly contribute to the overall Europe 2020 objectives of smart and sustainable growth, aiming to foster a competitive environment and to stimulate the innovation capacity of businesses, especially SMEs (European Commission, ‘2016 Work Programme, financing decision and support measures – 2016 COSME Work Programme Annex’, Brussels, 18.1.2016, C(2016) 63, page 15 (http://ec.europa.eu/DocsRoom/documents/15130/attachments/1/translations/en/renditions/native, accessed April 4th, 2016)).
EEN was established in 2008 by the European Commission and can be considered a key instrument in the European Union’s strategy to support growth and jobs. It is managed by the Executive Agency for Small and Medium-sized Enterprises (EASME) on behalf of the European Commission. The EEN mission is to help companies make the most of the opportunities offered by the European marketplace.
The network brings together, as members, more than 600 different and independent organizations from 60 countries, including chambers of commerce, technology centres, universities, research institutes and development agencies. Members are organized in consortia at country level.
Network members provide business support services – in particular for SMEs – by offering information, feedback and partnering services, innovation, technology and knowledge transfer services (European Commission, ‘2016 Work Programme, financing decision and support measures – 2016 COSME Work Programme Annex’, Brussels, 18.1.2016, C(2016) 63, page 16 (http://ec.europa.eu/DocsRoom/documents/15130/attachments/1/translations/en/renditions/native, accessed April 4th, 2016).
The clients of network members are companies and researchers. Clients are supported in finding partners for business cooperation, technology transfer and collaborative research, which match their needs and expectations in terms of innovation. Once the cross-border partner search has been finalized, the parties involved sign a partnership agreement (PA).
The aim of the partnership process is to reach a transnational PA, that is, a long-term collaboration of technology transfer between SMEs and research institutes and between SMEs or other possible clients, resulting in tailored services offered by the EEN member to the client. Thus, PA should follow the guidelines specified by the EASME.
Providing partnering services to clients represents a significant part of the EEN’s roster of activities. Indeed, developing a PA requires a lot of efforts in terms of time, skills and follow-up since it embraces a variety of network services as well as tailored knowledge according to the particular sectors involved.
The PA process is one of the services within a comprehensive set provided to make the most of the innovation opportunities in the European Union. It has the characteristic of being measurable, thus it is an important performance indicator for assessing the effectiveness and efficiency of the activities undertaken by the EEN to fulfil its goals (European Commission, ‘2016 Work Programme, financing decision and support measures – 2016 COSME Work Programme Annex’, Brussels, 18.1.2016, C(2016) 63, page 18 (http://ec.europa.eu/DocsRoom/documents/15130/attachments/1/translations/en/renditions/native, accessed April 4th, 2016). Only PAs meeting the guideline’s criteria are eligible for consideration by the EASME as a deliverable of EEN members’ activities.
The number of PAs signed by the clients of network members increases in time, generating a collection of relationships that shapes a pattern of connections. The set of all interactions in a specific time period constitutes an inter-organizational innovation network having members as nodes and relationships as connections.
Since we have nodes and connections, we are able to build an analytical description of the network by means of the network science tools. Such crucial step allows us to move from a qualitative to a quantitative, analytical representation of the underlying network organization.
We analyse the available data set provided by investigating the executive agency of the network (EASME), which covers the period of 2011 to 2013. Since the data of the PAs related to the individual organization members are confidential, they are aggregated at country level, meaning a more exhaustive network is not available.
Empirical evidence
According to the framework in Figure 1, we analyse the available data set provided by the EASME concerning 7329 PAs signed during the period from 1 January 2011 to 31 December 2013 among the EEN countries. We model the technology transfer activities across the EEN members by means of a graph G composed of a set V of n nodes and a set E of m links where nodes are countries and links appear when a PA is formalized between two of them. The data of the PAs related to the individual organization members are confidential; hence, they are aggregated at country level. It is worth mentioning that this article focuses on introducing the network science as a methodology to study the structure and the dynamic of a technology transfer system rather than give a wide picture of the system itself. We devoted some papers as literature 5,27,29 for the description of the many other EEN issues.
Network members can sign more than one PA; therefore, it is possible to consider such value as a weight in the links and refer to the intensity of the connections among countries. In this article, we are interested in the structure of the connections among members rather than on their intensity. Therefore, we focus the analysis of EEN as an unweighted graph where the links between nodes are either present or not. A complete SNA in terms of inter-organizational innovation weighted network and various complex weighted network hints are presented in the study by Ferraro and Iovanella. 27
We refer to a country by an index i meaning that we allow a one-to-one correspondence between an index and a country. Two nodes, says i and j, are adjacent through a link if there is at least one connection (a PA formalized by network clients assisted by the EEN members) between them.
The data set gathers a collection of spreadsheets reporting the number of the PAs in compliance with EEN guidelines. The data set is processed in order to extract the relationships among members’ countries to plot three different graphs (Figures 2 to 4) for each year under observation with the number of nodes and links as reported in Table 4. The nodes are the countries (labelled with the official country codes (https://www.iso.org/iso-3166-country-codes.html)) with at least one PA signed and the links reflect the interactions among countries. Those that have not signed any PA in the period 2011 to 2013 are not considered in the analysis.

The EEN graph in 2011. EEN: Enterprise Europe Network.

The EEN graph in 2012. EEN: Enterprise Europe Network.

The EEN graph in 2013. EEN: Enterprise Europe Network.
The EEN graph parameters.

EEN: Enterprise Europe Network.
Note that in Figures 2 to 4, the size of the nodes is proportional to their degree in order to highlight the presence of the hubs.
The data processing and the network analysis are conducted using the software R 42 with the igraph package. 43
One of the basic characteristics of graph G is its density d and in EEN graphs, the value of the density is low (0.25 and 0.30 in the period considered) denoting that the network is sparse. This effect, apparently negative in terms of information flow and communication, is justified by the network organization and is compensated by the low value of the diameter.
The diameter (D) measures the extent of the graph and the topological length between two nodes. The smaller D is, the shorter the expected path between spokes is, as the hubs act as bridges between the many small nodes. In EEN graphs, the value is 4, that is, the path among the farthest nodes is short; as a consequence, all countries appear strongly connected due also to EEN’s modest size in terms of nodes’ number. This effect compensates the low value of density and its impact on knowledge transfer.
EEN as a scale-free network
We show that a complex network with the scale-free feature is an adequate network organization to represent EEN. We refer mainly to the BA scale-free network model. 33,32
Scale-free networks are mainly identifiable by three characteristics: a low average path length, a high average clustering coefficient and a power-law degree distribution with 2 ≤ γ ≤ 3. 17
The average shortest path length characterizes short patterns connecting members in the network. In EEN, the values are 1.91 in 2011, 1.78 in 2012 and 1.92 in 2013 (as reported in Table 4), meaning that, in the time period considered, the distance among members shapes the small-world characteristic of the network. Furthermore, in a scale-free network, the theoretical average shortest path is known to be lnln(n); in the 3 years under observation, they are 1.35, 1.36 and 1.37, respectively, which are very close to the real values.
The average clustering coefficient C of the whole network is the average of the clustering coefficients of all individual nodes. In innovation networks, members sharing common partners are aware of each other’s trustworthiness, capabilities, competences and reputation, thus mitigating the effects of power asymmetries. 44 In the case study, this value is 0.65 in 2011, 0.67 in 2012 and 0.61 in 2013, indicating the presence of dense local subgroups of interconnected nodes sharing technology transfer agreements.
Regarding the degree distribution. P(k) ∼ k −γ , to evaluate the value of γ, we use the proper function in software R, resulting in the values of γ = 2.82 in 2011, 2.69 in 2012 and 2.83 in 2013.
The values of the average path length, the cluster coefficient and γ reported in Table 4 meet the three scale-free properties required and are comparable with the values of other real networks as reported in the study by Wang and Chen. 17 As a consequence, we can sustain that the most suitable organization for the EEN is represented by the BA model. We acknowledge that EEN networks are characterized by a rather small number of nodes; nevertheless, the BA model seems to represent a suitable approximation for the network organization.
As a final test, we compare the slope of the power-law degree distribution of the EEN with a classic random graph that has the same number of nodes and links, which we generated using the Erdös and Rényi model. 45 This analysis is performed to exclude the randomness of the EEN graphs. Figure 5 depicts the comparison between the two distributions, with the power-law slope of the EEN (the blue line) clearly decreasing less quickly than that of the random graph (the green line).

Degree distribution comparison between the EEN network and the Erdös and Rényi model in 2011 (left), 2012 (centre) and 2013 (right). EEN: Enterprise Europe Network.
The main implication about the scale-freeness of the EEN graphs stands in its implicit self-organized dynamic. The EEN networks are based on a top-down mechanism established by the provided business support services, while a bottom-up dynamic generates relationships shaped by the partner individual initiative. Such dynamic is not organized by the EEN itself and can be considered self-organized and independent from the environment.
EEN robustness
Although in the observed network it is inconceivable to expect a random failure or even a deliberate attack due to the fact that the nodes of the graph represent countries, we have implemented a double analysis – error tolerance and the attack tolerance – and its effects on the network’s diameter to detect the general features and maintain the ability of our framework to analyse an inter-organizational innovation network.
In the simulation performed in the case of error, we observe that EEN tends to retain its diameter every time a random node is removed, at almost at 70% oscillations notwithstanding.
The scale-free organization of the networks states that we have a high level of resilience against error failure. This aspect indicates that in case of a more realistic crise concentrated in one or few more countries does not affect the networks until the issues regarding the performances could be discarded since other issues as network recovery and catastrophe management become definitely more relevant. For instance, this is the case of the Syria that joined the network in 2011 but suddenly came out for the well-known circumstances.
The attack tolerance analysis is carried out by removing, at each time, the node with the highest degree, simulating an attack on the most connected nodes. The EEN diameter increases with the growing percentage of node removal and it suddenly decreases when almost 45–50% of the nodes are erased. Figure 6 shows the effects on EEN diameter under random error and attack in the period considered.
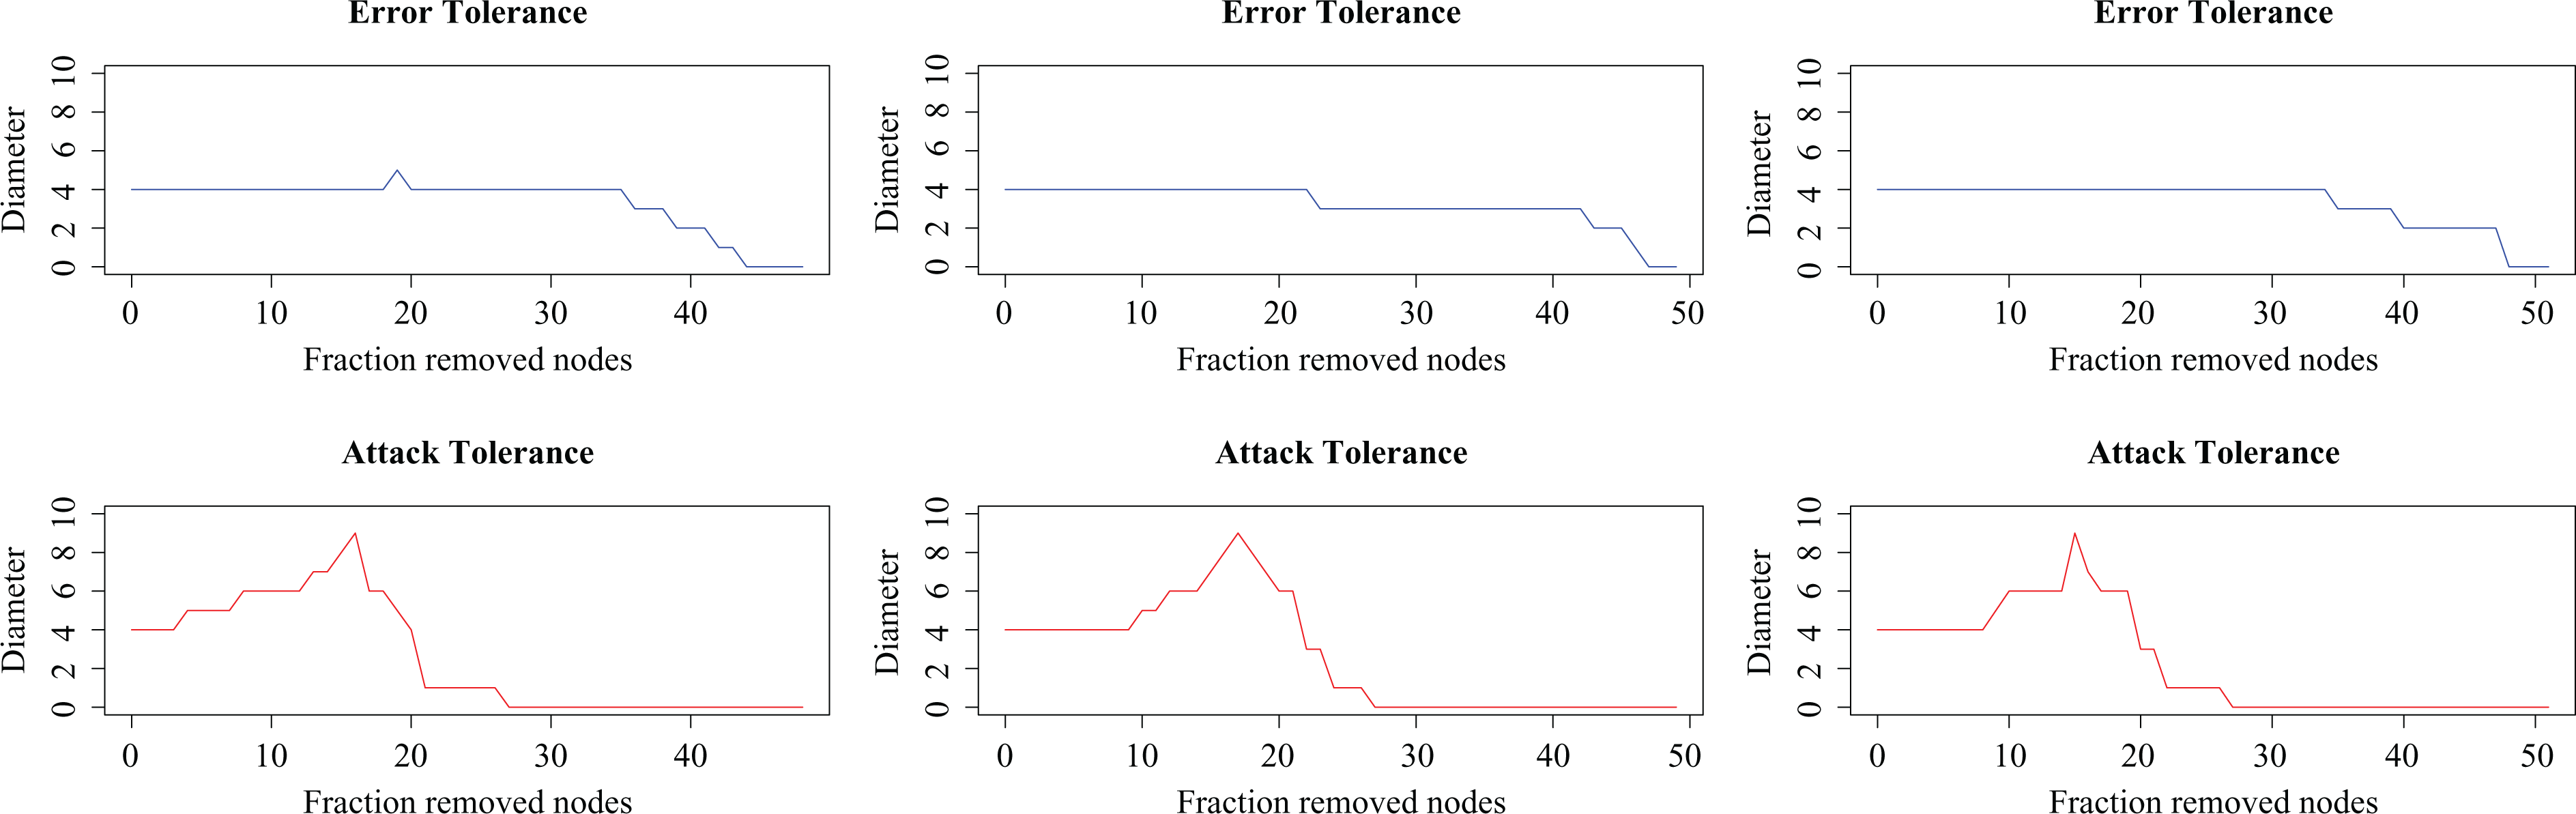
EEN diameter under random error and attack in 2011 (left), 2012 (centre) and 2013 (right). EEN: Enterprise Europe Network.
Note that if we use the presented framework for a general innovation network, the withdrawal of one or more members is a realistic hypothesis since they can possibly shut down or leave the network. Thus, this analysis allows us to observe how this phenomenon affects the whole system.
EEN disassortativity
The disassortativity index is computed by the Pearson correlation coefficient (r) between two countries connected by a link. Correlation plays a relevant role in the characterization of a network’s topology and is crucial in understanding the branching out of technology transfer patterns, as well as the network’s robustness in case of random failure or deliberate attack.
EEN presents a negative assortative value r = −0.33 in 2011, −0.36 in 2012 and −0.32 in 2013. This means that in EEN, the majority of technology transfer connections are between high-degree and low-degree countries, revealing a disassortative mix typically observed in technological networks. 46
This phenomenon has implications regarding the network resilience. In assortative networks, the removal of hubs results in less damage because they form a core group with many of them becoming redundant. On the contrary, in a disassortative system, hub deletion is more damaging as hubs are connected to many small degree nodes, which collapse the network once the most important nodes are removed. Therefore, such networks are particularly vulnerable in case of deliberate attacks to the highest degree nodes.
Communities detection in EEN
In a network, a community is a subgraph whose nodes are tightly connected according to certain rules. The analysis of such groups allows for the understanding and visualization of local latent structures of the network.
The EEN presents very low values of modularity (see Table 4), meaning that members are not organized in different communities. Thus, we can affirm that proximity effects among adjacent countries are not present. Such behaviour has its reasons because the PA process strictly follows the EEN guidelines and all the activities are performed considering English as official language. Then, the network is free of latent activities that could have the result to have a number of countries which tend to sign PA in circumscribed communities.
An alternative approach is to look for the largest communities of mutual interconnected members, that is, cliques, The main difference with the community as intended as far is that in a clique, all members are symmetric with no differentiation among them; thus we do not have to expect a hierarchy of roles. Table 5 shows the EEN membership in each clique during the considered period.
EEN clique compositions in years 2011, 2012 and 2013.

EEN: Enterprise Europe Network; BE: Belgium; CH: Switzerland; CZ: Czech Republic; ES: Spain; FR: France; IT: Italy; NL: Netherlands; PL: Poland; SE: Sweden; TR: Turkey; UK: United Kingdom; FI: Finland; HU: Hungary; GR: Greece; IL: Israel; RO: Romania; NO: Norway; PT: Portugal; DK: Denmark; DE: Germany.
Results from the analysis show that, in 2011, the EEN has only one clique of 12 members while in 2012 the network contains 6 cliques each having 12 members. In 2013, the number of cliques increases to 14 with 10 members indicating a different way to share out the PAs overtime.
There is a relevant overlapping represented by eight countries, namely Belgium (BE), Germany (DE), Spain (ES), Italy (IT), Netherlands (NL), Poland (PL), Turkey (TR) and United Kingdom (UK) constant over time; in 2012, the overlapping is extended to Israel (IL). Table 6 resumes the cliques overlapping in the analysed period.
Cliques overlapping

BE: Belgium; CH: Switzerland; CZ: Czech Republic; ES: Spain; FR: France; IT: Italy; NL: Netherlands; PL: Poland; SE: Sweden; TR: Turkey; UK: United Kingdom; FI: Finland; HU: Hungary; GR: Greece; IL: Israel; RO: Romania; NO: Norway; PT: Portugal; DK: Denmark; DE: Germany.
From this analysis, we observe a group of countries strictly interconnected in terms of technology transfer partnerships, surrounded by partners with different levels of membership in terms of clique. The clique spanning over a relevant number of countries reveals the absence of a core group, supporting the disassortative mix feature of the networks.
It is important to clarify that in this context, the term community is related to the result of the used algorithm. Thus, such a group is the expression of the patterns’ relationships in the network 47 and not the gathering of countries according to a particular characteristic. In other terms, this analysis provides information on the emergence of community as a result of the connection pattern.
SNA analysis of the EEN
Herein, we show the results of the standard SNA, where Appendix 1 reports the centrality measures and the local clustering coefficient, Ci , of the first 25 EEN countries in 2011, 2012 and 2013, respectively. As an example, Figure 7 depicts the map of European members of EEN considering values of degree and betweenness shaded proportionally to their values.

Degree and betweenness maps in 2013 restricted to the European countries of EEN. EEN: Enterprise Europe Network.
The cross-check between the network organization and centrality scores clearly shows the presence of three classes of members, that is, hubs, semi-peripherals and peripherals. It can therefore be inferred that some countries are more prone to enlarging their portfolio of partners through the formalization of technology transfer partnerships. Furthermore, these countries tend to maintain their role over time.
Semi-peripheral members still make a relevant contribution in getting substantial portions of the network together, as their activity in the technology transfer is effective in bridging distant parts of the network. Peripheral members are connectors only for local portions of the system since the number of partnerships is low.
The three tables highlight the presence of more than one hub since nodes such as IT, UK, DE, ES, FR and in 2012, PL has a neighbourhood value greater than 30, meaning that they are well connected to the other countries due to the high number of links. These countries also have a high rank of closeness, which signifies their relevant involvement in the network and their contribution to the technology transfer in branching out information more easily within the system. This is accomplished despite connecting different regions of the graph due to the higher betweenness values. Indeed, hubs act as gateways between the many peripheral nodes.
In the period considered, PL, Sweden (SE), TR and NL show a low value of betweenness, maintaining a high rank of eigenvector centrality. This results in a relevant influence of these countries in the network even without acting as a bridge in connecting the different regions of the graph.
There are some interesting cases as for Croatia (HR), Russia (RS) (both in 2011 and 2013), Czech Republic (in 2012), Slovenia (SI) (in 2013) and Lithuania (LT) where a high score in betweenness corresponds to relatively small values in eigenvector centrality, implying that these countries correspond to many of the technology transfer patterns but are connected mostly to low score members.
It is relevant to mention that some countries, namely PL, SE (in 2011 and 2013); TR (in 2011 and 2013); DE, NL, PL, SE and TR (in 2012); and Denmark (in 2013), have high degree with relatively low betweenness, meaning that their connections are redundant and information flow bypasses them, while high closeness and low betweenness signify that they have a relevant number of patterns around their local connections but they do not act as bridge.
The local clustering coefficient (Ci ) ranges between 0 (if no neighbour, that is connected to i, links to any other node that is connected to itself) and 1 (if every neighbour, connected to i, is also linked to every other node within the neighbourhood).
In EEN, only few members have the clustering coefficient equal to 0, resulting in a majority of nodes that tend to create groups characterized by a relatively high density of connections. In other words, countries with high clustering coefficient follow the transitivity property with their neighbours. Appendix 1 shows different behaviours among hubs, semi-peripherals and peripherals. Indeed, hubs, characterized by a large neighbourhood, are more likely be connected to nodes with small degree avoiding the transitivity closure, while semi-peripheral nodes show a high level of clustering coefficient due to a more homogeneous distribution of the neighbourhood.
Conclusion
This article set out to analyse the technology transfer environment from a network perspective. We provided a methodology based on the network science, arguing that such an approach is able to map and assess the set of entities acting in such an environment and their mutual relationships. Moreover, the theory behind the network science provides a collection of properties and measures able to give a comprehensive view of the networks, as well as offers a unique perspective on such systems in terms of technology transfer activities and connections’ effects.
We argued that a technology transfer environment involving different interacting entities could be represented as an inter-organizational innovation network composed of nodes and relationships. The presence of nodes and connections led us to confirm that the network science paradigm is an appropriate tool to model such a setting. Actually, the inherent ubiquity of this methodology lies in its ability to represent a large number of natural and man-made systems. By generalizing the presented approach, we are able to understand in more depth a wider range of real applications, thus giving a positive answer to our research issue.
Through the analysis of the case study, we observed that the scale-free organization is an adequate framework to represent the topology of real inter-organizational innovation networks. Scale-free systems have an intriguing set of common issues related to how the topology affects the function and behaviour of the networks.
Scale-free systems have certain interesting positive dynamic features, such as flexibility, autonomy and robustness, that other organizational systems lack. These qualities can all be seen as aspects of the process of self-organization that typifies scale-free networks: these systems spontaneously organize themselves so as to better cope with various internal and external factors. This allows them to evolve and adapt to a constantly changing environment.
The evidence from the network organization has also been combined with the degree distribution to detect the establishment of stable groups of concentrated interactions by transitive relationships and to show how the technology transfer pattern reaches peripheral nodes straightforwardly due to the disassortative feature of the system.
The performed SNA on the case study allowed us to identify relevant findings concerning the network members. We identified the highly scoring members in terms of centrality and we detected their influence in branching out the technology transfer patterns from one member to all the others. Furthermore, the degree distribution of the scale-free organization characterizes the different classes of members as hub, semi-peripherals and peripherals.
Summarizing the implications of this article lays on the ability to analyse interactions in a complex environment from a collective point of view rather than from the single individual. Moreover, many hidden information are available using the network science approach such as, for instance, self-organization, resilience, communication patterns, preferential attachments, structural communities and so on. Thus, our contribution can be considered as valuable in that it offers environment insights for possible decision strategies that can incorporate more effective actions.
It is important to note that such an approach is conditioned by the existence of an appropriate data set of entities and connections. In many cases, technology transfer environments are characterized by informal communities and often by inconsistent organizational architectures. Under these circumstances, the lack of information regarding the observed systems affects the effectiveness of the proposed methodology.
The results presented lay the foundations for future theoretical and practical studies. Among others, one of the relevant aspects that should be investigated is the connections’ intensity, which is related to the effects of reiterate partner’s agreements and to the importance of increasing the circulation of knowledge and in creating opportunities for a member to acquire technology outside its boundaries.
More information about the networks can be obtained using additional network science tools. Since the literature on this topic is an ongoing progress, we can foresee further advances in this field of research.
Footnotes
Acknowledgements
The authors would like to thank the Executive Agency for Small and Medium-sized Enterprises for the support to data retrieving.
Declaration of Conflicting Interests
The author(s) declared no potential conflicts of interest with respect to the research, authorship, and/or publication of this article.
Funding
The author(s) disclosed receipt of the following financial support for the research, authorship, and/or publication of this article: This article was partially supported by the European Union grants CIP-EIP Consultation ENT/CIP/12/B/N01C00 and COS-WP2014-2-1.