
Abstract
Performance management (PM) plays a vital role in the successful operation of an organization. It is essential for organizations to understand the correlations between factors, problems and solutions to enhance the efficiency of PM. Mixed method research is applied, including explanatory sequential design (Quan → Qual). By analysing findings and interviews from a cluster of small and medium enterprise (SME) high-growth sectors and high-impact sectors based on descriptive and inferential statistics, the PM finding is that these two SMEs are not different. Moreover, the factors that influence PM are recruitment, retention and retirement. Regarding PM problems, the key factors are a lack of employee participation, unclear goals, unfair evaluations, ineffectual communication and ineffective application of evaluations to improve PM. Therefore, related private and government organizations should enhance their knowledge and understanding of problem-solving procedures by attending trainings or discussing these topics with experts to raise their awareness of PM and to learn how to resolve related issues, particularly factors that directly influence PM, to ensure progress in their performance.
Introduction
One of the important processes or tools that enhance organizational efficiency is performance management (PM). PM is a key success factor for industry, as it helps organizations gain a competitive advantage. 1 PM is an essential instrument for organizations that enables them to achieve productivity in terms of quality and quantity; 2 additionally, PM can cascade and align the goals of organizations and employees in the same direction. 3 Regarding the importance of PM, several published papers focus on the principles and concepts of PM and the techniques for successfully applying PM in organizations. 4 –7 It is known that human resource management (HRM) is closely related to PM.
Based on the findings of Maley 8 and Slavić et al., 9 it is claimed that the HRM of multinational firms significantly influences PM, but few researchers have studied the correlational effect between HRM and PM. 8,9 The research on HRM focuses mainly on the systematic processes of international companies and large organizations. In other words, previous studies have not focused on local organizations and small and medium enterprises (SMEs); however, this study contributes to the research on the effect of HRM on PM by addressing these issues. While there is an intuitive link between HRM and PM, the relationship needs to be established empirically and the degree to which HRM affects PM needs to be determined. Therefore, questions regarding the correlational effect on PM should be proven in further studies.
Research objectives
To examine the use of PM in SMEs.
To investigate the correlational effect between HRM and the PM of SME high-growth sectors and high-impact sectors.
To examine PM solutions for SME high-growth sectors and high-impact sectors.
Performance management
PM is a continuous process of setting goals and objectives that align with strategic adjustments and objectives in an organization to ensure highly efficient performance.
10,11
PM can be divided into five stages.
2
(1) The prerequisite process stimulates the participation of employees and the preparation of the information required for organizational, departmental and individual operations.
12,13
(2) The performance planning stage identifies the desired outcomes of organizational, departmental and personal operations; additionally, this stage identifies the capabilities required for operation as well as capability development guidelines.
14,15
(3) The performance evaluation process measures actual versus expected performance within a specified scope based on predetermined objectives.
16,17
(4) The performance review process involves executives and employees discussing performance, strengths, weaknesses, solutions and improvement areas.
18
(5) The performance application stage refers to developing an organization’s plans, missions, strategies and HRM.
19
Watchareejirachot
20
and Kanchanopast
21
considered PM in businesses of different sizes, structures and types that demonstrated different operations. These early research findings lead to the following hypothesis:
Human resource management
Sanamthong
22
stated that HRM is divided into three main processes. First, recruitment consists of three subprocesses: human resource planning, which is related to the survey process of human resource demand and the availability of sufficient people when needed; recruitment, which is the process that attracts applicants who possess the required abilities and attitude to fit vacant positions; and selection, which is the process of qualifying people for appropriate positions.
23
Second, retention consists of three subprocesses: training and development, which is the systematic process of expanding the competencies of employees to meet the company’s expectation; performance evaluation, which is the measurement of employee performance and career development, which is the career path for each employee’s development plan.
24
Third, retirement includes retirement, dismissal, contract termination and assistance in acquiring a new job.
25
Maley
8
and Slavić et al.
9
stated that efficient HRM can lead to successful PM. Additionally, Raj Adhikari
26
concluded that HRM and HRD are closely related to PM. These findings lead to the following hypotheses:
Figure 1 illustrates the research framework based on the hypotheses. The figure consists of two independent variables (SME background and HRM) and one dependent variable (PM).

Research conceptual framework.
Research methodology
Researchers have used the sequential explanation design of Creswell 27 to conduct mixed methods research on PM. Quantitative research was conducted to test the hypothesis regarding quantitative data. Qualitative research was conducted to support the completeness and comprehension of the quantitative findings using in-depth interviews. The research processes were as follows.
Quantitative phase
The research sample was 400 business owners and top executives of SME high-growth sectors and high-impact sectors. 28 Respondents were classified based on geography by applying multistage sampling in four regions of Thailand. Respondents were divided into subgroups based on the proportion of respondents in each region and province. Simple random sampling was applied by randomly selecting respondents from regional name lists of the Office of Small and Medium Enterprises Promotion.
The research instrument was a structured questionnaire consisting of three parts. The first part, SMEs characteristics, was adapted from Cordeiro; 29 this part used ordinal scales to assess the number of employees, the years of existence, the business field and the industry sectors. The second and third parts asked respondents to rate PM and HRM; these parts were developed by researchers based on theories and concepts. A five-point Likert-type scale was used, for which ratings of 1, 2, 3, 4 and 5 denoted Strongly disagree, Disagree, Indifferent, Agree and Strongly agree, respectively.
The questionnaire was tested by a panel of five experts and met the content validity requirements which mandate that each question’s index of item-objective congruence be greater than 0.600. Additionally, the questions were trailed using a group of 30 business owners in another SME section to determine the internal consistency reliability; the item total correlation and Cronbach’s α coefficient of the questionnaire ranged from 0.565 to 0.947 and 0.865 to 0.977, respectively. Statistics for analysing the data were percentages, frequencies, standard deviations, variance, skewness and kurtosis. Hypothesis 1 was tested using analysis of variance (ANOVA) to examine the differences between group means and their associated procedures. 30 Hypotheses 2, 3 and 4 were designed to test the correlational effect of HRM variables on PM; Huberty 31 suggested that multiple regression is the analysis that helps researchers estimate the relationships and make predictions among variables.
Qualitative phase
Purposive sampling was used to select 30 informants, 6 of whom were government sector policymakers and SME academic scholars and 24 of whom were business owners, executives and employees. Researchers created the structured interview outline in accordance with the PM process, which was then verified by an expert to ensure the validity of the content that was used during the in-depth interview. In the method utilized in this stage, the researcher reviewed the data analyses to determine the problems and solutions of the PM. In the findings, the interviewees were labelled as follows: government, policymakers or academic scholars (A 1–6); business owners or executives (C 1–16) or employees (D 1–8).
Research results
Quantitative results
Among the 400 respondents, 62.50% were female and the remainder (28.50%) were male. Nearly half the respondents (39.70%) were between 21 and 30 years old, followed by 31 and 40 years old (36.50%); 4.80% were 50+ years old. Additionally, nearly half the respondents (44.20%) had bachelor’s degree, 36.00% had a diploma degree and only 1.25% had a doctoral degree. Of the respondents, 31.50% had a workforce of fewer than 25, 29.00% had 25–100 employees and the remaining 7.00% of SMEs had 100–200 employees. Regarding the respondents who completed the questionnaire, 36.50% of the SMEs had been in existence for more than 20 years, 18.00% had been in existence for 6–10 years and 13.50% had been in existence between 16 and 20 years. Regarding the industry groups, 65.00% of the sample were SME high-growth sectors and the remainder were high-impact sectors (35.00%). Regarding the SME business fields, the fields of electronic parts, automotive and spare parts, food and beverage, herb and cosmetic, agriculture, energy, construction, transportation and logistics, information technology and education service were each 5.50% of the sample; the fields of tourism, health service, machine, food industry, rubber industry, packaging and plastic, apparel and textile, jewellery and accessory and retail were each 5.00% of the sample.
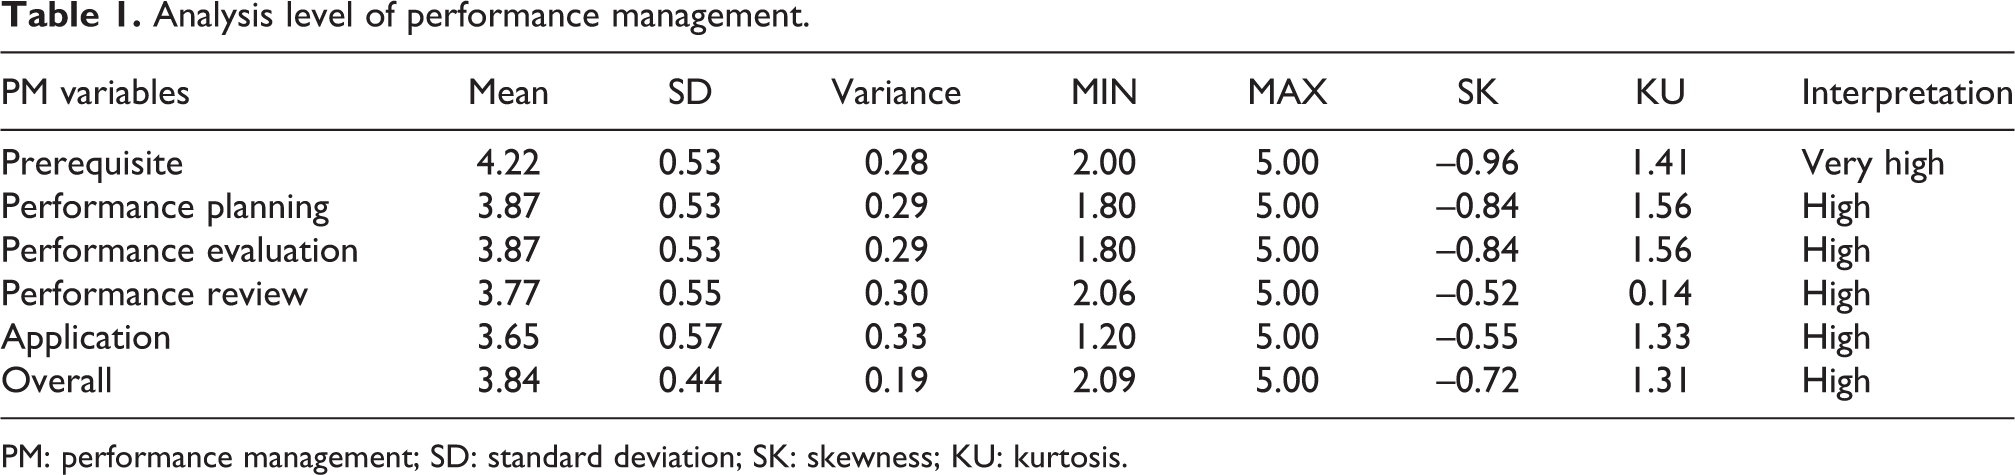
Table 1 shows the overall mean of the PM was 3.84 (on the five-point Likert-type scale), indicating that most respondents agreed with PM. The corresponding skewness value was –0.72, indicating that most respondents had a score higher than the mean. The kurtosis value of 1.31 demonstrated a similar PM. The means of the ratings for the prerequisite, the performance planning, the performance evaluation, the performance review and the application were 4.20, 3.87, 3.87, 3.77 and 3.65, respectively; these ratings indicated that most respondents agreed that the prerequisite was the most favourable stage and the application was the least favourable stage. The skewness and kurtosis ranged from –0.55 to –0.96 and 0.14 to 4.56, respectively, which shows that the respondents generally had higher scores than the means.
Analysis level of performance management.
PM: performance management; SD: standard deviation; SK: skewness; KU: kurtosis.
As shown in Table 2, the overall mean of HRM was 3.84 (on the five-point Likert-type scale), indicating that the majority of respondents agreed with the question description. The corresponding skewness value was –0.42, which suggests that most of the respondents had scores higher than the average. Furthermore, the corresponding kurtosis value was 0.36, implying that most respondents had at score higher than the mean; in other words, they had a similar opinion. The means of the recruitment, retention and retirement items were 3.90, 3.91 and 3.80, respectively, implying that most respondents agreed that retirement was their top priority and that retention was their lowest priority. The skewness and kurtosis ranged from –0.31 to –0.38 and 0.00 to 0.16, respectively, indicating that the respondents had scores higher than the mean; most scores were similar except that recruitment had a slightly different rating.
Analysis of human resource management.

SD: standard deviation; SK: skewness; KU: kurtosis.
Before testing the hypotheses, the researcher tested the normality assumption of the four variables, which was based on the Kolmogorov–Smirnov test (with an estimated population mean and variance). The results are shown in Table 3. The four variables in the one-sample Kolmogorov–Smirnov test confirmed the normality assumption, indicated by non-significant p-values (p > 0.05).
Tests of normality.

PM: performance management.
The ANOVA results in Table 4 indicate that among the four predictor variables of SME backgrounds, there were no significant differences (p > 0.05). The number of employees, years of existence, business types and industrial sectors were not significantly different within PM (p = 0.304, F = 1.214; p = 0.460, F = 0.765; p = 0.431, F = 1.024; and p = 0.329, F = 977, respectively), indicating that SME backgrounds do not affect PM. Based on these findings, hypothesis 1 was rejected.
ANOVA examining the effect of SME backgrounds on PM.

ANOVA: analysis of variance; SD: standard deviation; PM: performance management; SME: small and medium enterprise; IT: information technology.
To further confirm and understand the amount of variance in PM that is due to recruitment, retention and retirement, multiple regression was performed on the data. Prior to testing the hypotheses, the underlying assumptions and conditions of multicollinearity, linearity and normality were investigated. According to Hair et al., 32 when avoiding multicollinearity by determining the tolerance and the variance inflation factor (VIF), the tolerance is calculated by regressing the independent variable of interest onto the remaining independent variables in the multiple regression analysis; this value should be no more than 0.10. The VIF, which measures multicollinearity, assesses how much the variance of an estimated regression coefficient increases if the predictors are correlated; a VIF between 5 and 10 implies a high correlation, and a VIF above 10 indicates that the regression coefficients are poorly estimated due to multicollinearity. In this study, the tolerance and VIFs, which are shown in Table 5, met the criteria, indicating that there was no multicollinearity.
Regression analysis (enter method).

b 0: unstandardized coefficient; β 0: standardized coefficient; r: correlation coefficient; Sig: significance value; HRM: human resource management; PM: performance management; VIF: variance inflation factor.
*p < 0.050.
**p < 0.010.
***p < 0.001.
An assumption of linear regression is that there is no heteroscedasticity of residuals. The researchers checked the variance of variable errors by conducting White’s test for heteroscedasticity test including cross-terms; the p-value was greater than 0.05. Therefore, the null hypothesis was accepted. In other words, the equations tested in this study had no variance of variable errors (heteroscedasticity).
Table 5 shows the results of the multiple regression analyses (enter method). The F-value was 66.988, and the p-value was 0.001, which is less than 0.050. The table clearly shows that the model that we analysed is statistically significant. Recruitment, retention and retirement were statistically significant in this model, p < 0.050, 0.010 and 0.001, respectively. These values show statistically significant correlations with PM. The variables of HRM had a high correlation coefficient (71.200); three variables of HRM account for 49.900% (adjusted R 2 value is 0.499) of the variance in PM according to the model. The standardized coefficient values for recruitment, retention and retirement were 0.359, 0.246 and 0.186, respectively, all of which were significant at the 0.050 level. Therefore, the correlational results provide evidence to accept H2, H3 and H4.
Qualitative results
The integration of quantitative and qualitative research provides a better understanding of the research objectives and the research problems. This section describes qualitative research that provides detail and deepens understanding of the results.
Problems with PM
Problems with prerequisite
Executives primarily use their own judgement to support decisions; this decision-making does not use empirical data or employee participation in establishing organizational goals. Traditionally, most of the annual planning of the SMEs is prepared by the owners or top executives, who have their own points of views judgements, and experiences for annual planning. (key informants A1)
Problems with planning
The targets and goals of an organization, including the departments, are normally established by the marketing, sales or production departments. Furthermore, other departments establish unclear goals. Additionally, the competencies do not match the desired behaviour, which are based on successful organizational goals or targets and finally become managerial proverbs. Most SMEs are more concerned with sales and cash flow indicators, whereas PM seems to be a less important indicator. (key informants A2)
Problems with performance evaluation
The evaluations are not performance-based; instead, they are focused on behaviours. The evaluation form does not meet the organization’s objectives; this results in no improvement in the evaluation form. Additionally, no preparation or communication is provided to employees regarding the evaluation process. Finally, each evaluator uses his or her own judgement, criteria and bias to evaluate. The evaluation forms that are used to evaluate the employee’s PM have been used for a long period of years without any reform to connect with the changing world. (key informant C5)
Problems with performance review
The supervisor does not provide feedback to subordinates and does not provide employees the opportunity to appeal their performance results. For PMs, the individual improvement suggestion is the least that employees can hear from the supervisor. (key informant C11) Supervisors mostly evaluate the employees without having conversation with their subordinate regarding what and how to improve his or her PM. (key informant C3)
Problems with application
Organizations use the evaluation results mostly on compensation, promotion and training. Conversely, the evaluation results are not used for the individual, department or organization’s improvement plan. Mainly, PM is used for payroll’s appraisal only, whereas the evaluation result is very useful for HR and can be used as base information for setting an organisation’s goals. (key informant A1)
Solutions for PM
Solutions for prerequisite
An organization should analyse both internal and external data to establish the organization’s vision, goals and standards. To achieve these objectives, organizations need to encourage employees to participate in the PM process. SWOT analysis can be used as an effective tool for any organisation in order to set a TOWS matrix. The results of the TOWS matrix will set the right direction for the organisation. (key informant A5)
Solutions for planning
An organization’s goal, department and individual must relate to each other using PM as a tool. In addition to being a success set, personnel competencies must meet the organizational standard and support the organization’s competency. For the PM, planning must be based on fact finding in order to set the measurable indicators. The SMART model can be used to consider the possible outcome. (key informant A5)
Solutions for performance evaluation
The performance evaluation form needs to improve and adjust so that it relates to performance indicators using the desired competencies that are defined in previous steps. The HR department should facilitate both physical and non-physical assessments. Additionally, supervisors should be trained to clearly understand evaluation procedures. The evaluation form must indicate and measure the findings that are based on fact, and the evaluation form should be modified in order to determine the truth about PM. (key informant A6) The standard evaluation procedure should reflect the overview figure in order to set a clear understanding between the HR development and the employee. (key informant C14)
Solutions for performance review
The evaluation results should be shared with all personnel to improve their performance. Communication skills are highly important for supervisors when sharing the evaluation. Supervisors should inform their subordinates of the evaluation for overall exchange or suggestions. (key informant C11) Feedback is important for individual development, because the employee can use it to improve their skills. (key informant A6)
Solutions for application
A policy evaluation set must be shared and implemented regarding the performance results related to all HRM tasks. Therefore, the evaluation results should be established and used in planning for the upcoming year. The key and most important thing for the evaluator to keep in mind is that the evaluation is for improving HR development, not just for payroll appraisal. (key informant A5)
Conclusions and implications
The research revealed three main results. First, different SME backgrounds did not have a statically significant (p > 0.050) effect on PM. This finding implies that both SME high-growth sectors and high-impact sectors have similar outcomes when using the PM process, which consists of performance prerequisites, planning, evaluation, review and application, 2 because these two sectors also garner continuous support regarding management training, funds and business mentoring from private and government sectors. This result is similar to the work of Kanchanopast, 21 which found that different sizes and types of organizations operate by different means based on their structures and styles of management and operations.
Second, the researchers found that recruitment, retention and retirement have a correlational effect on PM with statistical significance (p < 0.050) because HRM is closely associated with PM. If the organization is able to execute on recruitment, retention and retirement, there will be an increase in employee morale and an increased in organizational goal achievement. 26 These results are similar to those of Slavić et al., 9 who found that the PM process is highly correlated with HRM. If an organization has an effective HRM process, it should have a positive influence on PM.
Finally, the problems with PM are amplified by a lack of employee participation, unclear goal setting, unfair evaluation, ineffective communication and ineffective applications of evaluation results in both SME types. Therefore, one solution to these problems is that organizations should encourage participation in the PM process and should manage based on clear indicators that the organization wants to measure. Regarding an unfair evaluation, the evaluation process requires empirical data that are impartial and verifiable; the feedback process requires communication skills and provides advice and development plans. The evaluation results should be applied to HRM and organizational development to maximize operational efficiency. The results of the mixed methods research show that PM is affected by PM problems and by HRM. PM solutions can help to solve the problems and support effective PM, as shown in Figure 2.

The correlational effect of HRM on PM, problems with PM and solutions for PM. HRM: human resource management; PM: performance management.
This research increases the awareness and importance of PM for both private and government sectors. Therefore, public and private sectors must focus on knowledge sharing and training for entrepreneurs or executives to understand the creation of a flexible organizational structure, strategies and HRM. Proper training and development will support a clear understanding of PM. Furthermore, the government should establish an award policy for the private sectors, such as the Total Quality Management (TQM) award, to improve or create benchmarks for PM.
This research examined two SME sectors (high-growth and high-impact sectors, which combine to include 19 types of businesses in Thailand); therefore, future research should explore the varieties of businesses and industries for multilevel comparison. Furthermore, this research utilized the sequential Quan → Qual method; subsequent research could adopt the sequential Qual → Quan method to examine the problems, solutions and correlational effects between the factors that correlate with PM.
Limitations
Although the research achieved its objectives, there were certain unavoidable limitations. First, because of time constraints, this research was conducted with high-growth and high-impact sectors of SME businesses in Thailand. Therefore, to generalize the results for a larger group of SMEs, the research should include more SME businesses at different levels. Second, there was little existing research to support the findings because this research is a new topic; therefore, to describe an appropriate follow-up statement, researchers should build a stronger overall evidence base.
Footnotes
Acknowledgements
The authors acknowledge and deeply express their appreciation for the support provided by the Office of Small and Medium Enterprises Promotion, the Dean of faculty business administration, Rajamangala University of Technology Thanyaburi and co-researchers during the data collection and verification of research work.
Declaration of Conflicting Interests
The author(s) declared no potential conflicts of interest with respect to the research, authorship, and/or publication of this article.
Funding
The author(s) received no financial support for the research, authorship, and/or publication of this article.