
Abstract
In general, European Union Member States attribute great importance to the building sector in reducing their greenhouse gas emissions as part of their climate policy strategies. The present study is aimed at studying what happens if decision-makers do not take any prominent measures to ensure that the building sector realizes more efficient performance. The current European tendencies indicate that the most common approach is to attempt to renovate the existing building stock. However, this is not always the best solution. In Central and Eastern European countries, such as Hungary, the greatest problem encountered in renovations is the outdated heating and electricity supply of the old buildings. Many experts are convinced that these buildings should be demolished now and replaced with new ones in order to achieve more effective performance. This study, besides the environmental matters presents a climate policy-related economic evaluation which strengthens the latter opinion. The purpose of this novel cost effectiveness analysis is to examine the long-term viability of these two approaches (retrofitting strategy vs. the building of new houses) from the aspect of both environmental conformity (climate friendliness) and sustainable economics between 2020 and 2030.
Keywords
Introduction
From the aspect of climate policy and despite not being part of the EU Emissions Trading System (EU ETS), the building sector is in the unusual situation among industries subject to the European Union’s environmental regulations as it is the focus of most national development plans. This is due to its inherent cost-effective possibilities for decreasing greenhouse gas (GHG) emissions. 1,2
The sector’s developments in the past decades have shown positive trends which can be attributed to several quickly changing aspects (e.g. technological development, social demand). Even though these patterns induced fundamental reductions in GHG emission, 3 the major problem was the lack of intentional regulatory tools. It means that the prosperous tendencies have only been incremental benefits rather than results of climate-oriented legislations. In case of Central and Eastern Europe, the outdated buildings—which passed their lifecycles—provide advantageous possibilities as well. These facilities are much cheaper to develop than the more advanced Western European infrastructure. 4 Present concepts all point toward the direction of modernizing old buildings which results in effective carbon dioxide (CO2) emission reductions in a relatively short period of time. 5,6 However, what is generally not considered in these calculations is that installing heat insulation on these buildings does not provide a solution to the use of their outdated technologies (pipes, conduits, reinforcements, etc.). They could easily end up being inoperable within 4–5 years and could fail to meet the requirements of relevant standards. Eventually, they would be replaced by new, safe buildings anyway. 7,8
This development controversy forms the basis for the present study: The discussion of this dilemma is a main priority not only in Hungary, but also in other Eastern European countries. The present analysis argues that these buildings must be torn down anyway, even if they are still within the return period of their investments. This statement has been also indicated by other international researches which examined different infrastructural environments. 9,10
The assumption is therefore that the correct approach is to start building new, modern buildings as soon as possible. Meanwhile, the social deadweight resulting from existing renovation initiations would stay as small as possible. The study was therefore aimed at assessing the following development possibilities: One scenario analyses the amount of GHG reductions that can be achieved by renovations and the related cost-benefit analysis (CBA) factors. While the other scenario evaluates the economic viability and the climate-oriented sustainability of an alternate strategy, based on the construction of new buildings instead of retrofitting old ones.
Materials and methods
The traditional CBA
Today, the CBA has become a fundamental tool in business for examining the financial returns of investments. A prerequisite for starting any project is that decision-makers must be aware of how profitable an investment will be in the long run. Its principle is to monetize all effects regarding the project that could be a result of implementation. This makes it easier for upper management to make the right decisions by weighing the finance-based factors not only in advance to the project, but during the execution as well. However, over time this feature of the method has also become its greatest weakness: It has become apparent that the effects which cannot be expressed in monetary terms are not validated to the same degree during the initial decision-making process.
The term “externality” was already being used in the world of business: It refers to features that cannot be validated under market conditions. Thus, people who work on modern CBA strive to include these externalities into their systems as best as possible. 11 The current models aim to enable the influencing factors to be expressed as monetary amounts as accurately as possible. This is called internalizing. This has become one of the most important aspects of modern CBAs. Since it is not enough to recognize these factors during the course of project implementation; they also have to be included in calculations before the projects are started. In lack of doing so, programs aimed at developments can easily be misled in directions that do not serve the development of the system which makes them detrimental initiatives. Thus, the task when performing an accurate CBA is to develop a structure that can provide a comprehensive picture of the surrounding business environment and its changes by assigning indicators to it. The methodological part of this article presents an applicable CBA methodology regarding the involvement of environmental externalities and elaborates on its interpretation to climate policy terms.
The basis of modern CBAs
When developing the methodological bases of the analysis, the present study mainly relied on an International Environmental Consultation Group’s (The COWI group) CBA methodology, 12 which was deemed to introduce the best solution to internalize the externalities. Since they basically developed their cost-benefit model to evaluate EU funded initiatives, their method is widely accepted for interpreting the implementation costs and benefits of a project. It mainly deviates from traditional financial analyses because its core objective is not to maximize profits from a corporate approach. It rather focuses on integrating the indirect effects from a social and environmental perspective.
The method defines external effects as quantifiably manageable characteristics that have ratios and prices which can be estimated even though they are quite difficult to express in monetary terms. It is precisely for this reason that a fiscal correction naturally must be applied in a later phase of the analysis to improve the accuracy of this estimate. Otherwise, it can end up leading toward unrealistic directions. This primarily applies to correctly dealing with factors such as taxes, state support, and correcting market prices. By focusing on the proper consideration of externalities, the analysis in the present study also applied the COWI methodology logic. 12 However, since this article deals with both climate and cost efficiency, the study system had to be augmented with factors suitable to measure the impact of the projects on the GHG balance. 13 As a result, the study used two versions in every scenario. Of these, the first was to use present regulations to define the direction future processes would take by following the recent trends. This was referred to as business as usual (BAU) since it contained no new tools for climate regulation. 14 In the second version, a climate-oriented project was run, including environmental regulations which are currently under consideration by policy makers. This made it possible to differentiate sector GHG emissions in lack of any climate policy interventions and changes from emissions due to the implementation of various climate policy measures. During the financial calculations of the apparent (positive and negative) externalities, the influence on GHG emissions of both the BAU and the “Project” scenarios was taken into account.
The effect on the GHG balance was measured by converting all GHGs in the sector to CO2 equivalent (CO2e) 15 according to the global practice.
The characteristics of the newly developed climate policy cost-benefit model
When developing the new climate policy CBA model, the goal was to create a structure that provides a suitable picture of the changes regarding the examined system and its effects on macro level. In addition to a cost-benefit-based method, the other principle was multi-targeting. This pattern was tailored to the EU’s climate policy goals, which are “increasing energy efficiency,” “the intensive expansion of renewable energy systems,” and “achieving the greatest possible GHG reduction.”
There are several schools for handling multi-targeting, although situations such as this are generally handled as single-targeted. The correction mostly comes later by taking each target into account one after the other. Contrary to this approach, the present study model included the implementation of various targets in its calculations. In certain cases, the mechanism even considered them as having been met by the given time in the future. To each of these, only one factor was assigned that would later be influenced. During the research, the obtained results were stored. Then, the study was repeated for every single case by modifying only one target at a time, ensuring the remainder stayed constant. The end of the analysis resulted in a set of solutions. Eventually, the outcome the measures that influenced the implementation of the best scenarios were chosen.
Based on the above, the study developed the following CBA equation (1) 12 :
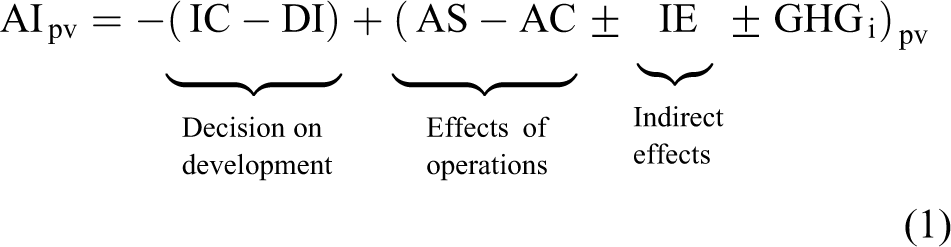
where:
AIpv = the present value of additional income. IC = the additional investment cost of the equipment to be purchased (EUR). DI = possible support and discounts (EUR). AS = the additional sales revenue resulting from the additional yield or increase in quality attributed to using the given technology (EUR/year). AC = the balance of the given technology’s additional costs and its possible savings (EUR/year). IE = the indirect economic impacts (environmental effects, effects on society) of using the given technology and the value of GHG reduction (EUR/year). GHGi = the indirect effects on emissions of using the given technology, based on the value of the decrease in GHGs as per the EU ETS quota forecast (EUR/year). pv = present value.
The essence of the new CBA model is the “GHGi” at the end of the equation, as it monetizes those externalities that the climate-oriented project created in the system. Since one of the targets of the analysis is measuring the success of projects that reduce GHGs, the accompanying benefits and disadvantages are also included in this point. The implementation of the three-tiered climate policy target system between 2020 and 2030 is also internalized mainly through this indicator. The importance of this time interval comes from its match with the next EU programming period and the next phase of the EU ETS. Considering the proximity of the starting date, it is quite urgent to conduct researches which would contribute to the strategic planning process. The next subsection therefore will present the way how the essential data have been gathered for the accurate analysis.
The data used
The National Building Energy Strategy 16 and the research conducted by the Central European University 17 provided us with a database for the environmental aspects of the study. Data pertaining to the ratio of the various building types in Hungary and the GHG emissions of these housing types were obtained from this database. Trends for the quantitative changes in time of these buildings were calculated on the basis of the Central Statistical Office’s chronological database.
The values of changes in GHG emissions were defined based on the emission units of allowance (EUA) quota values forecasted by the EU ETS. It is expedient to use the future EUA trend values provided by the EU Commission because they form a definitive development point for the EU’s climate policy, meaning that they also form the basis for climate policy interventions.
The model comprises the following main units: Historical datasets Scenarios Forecasts Cost-benefit tables Results, vulnerability study
Results and recommendations
Scenario 1: The renovation of the building stock
The authors assumed two fundamental cases in Scenario 1: First, processes continue as per the present political and support systems, which literature refers to as “BAU.” In the other case (“Project version”), significant financial resources were allocated to the building sector in the interest of achieving robust decreases in building CO2 emissions. The total area of the housing units changes at the same rate in both cases. According to the Project version, the energy use of old buildings (e.g. prefabricated apartment buildings) is rationalized. The ratio of renovated buildings that are however at the end of their life cycles increases significantly. This version follows the attributes of the deep retrofitting building strategy which is trending currently among European countries.
Carbon efficiency indices in Scenario 1
Figure 1 clearly shows that the building sector’s CO2 balance is barely reduced as a result of the project implemented by the study. The outcome does not significantly deviate from the BAU variant that takes place on the basis of present tendencies. This measure is the most important of the carbon efficiency indices since this includes all GHG emissions that are related to the fulfillment of the sectoral climate targets. The poor performance of the illustrated indicator means that the present renovation strategy for the building sector does not lead to substantially beneficial climatic impacts.

Developments in the building sector’s CO2e emissions until 2030. CO2e: carbon dioxide equivalent.
Figure 2 illustrates the process of changes in GHG emissions per square meter of housing unit until 2030. This also makes it apparent that merely renovating the buildings did not significantly contribute to the BAU version’s development, which in itself already resulted in a reduction.

Developments in the sector’s average CO2e efficiency until 2030. CO2e: carbon dioxide equivalent.
Figure 3 illustrates the spreading of low-carbon technologies within the building sector. The essence of these technologies is that they are based on low environmental loads and GHG emissions. The building sector is basically a passive emitter, meaning that it uses energy generated by other sectors. This is the reason why this value stagnates; the case is the same for new buildings, as well. 18 –20 The main problem was posed by the previous two figures, which show that despite its success, the project was unable to greatly improve GHG emission reductions. Especially in comparison to the processes that are expected to take place anyway. The building renovation projects basically stabilize the old disadvantageous systems and thus impede the modernization of buildings.

Changes in low-carbon technology ratios in the sector until 2030.
After examining carbon efficiency, the performance of the project’s finances should also be reviewed: Is the renovation of outdated buildings an investment that provides a return?
Financial return indices in Scenario 1
Figure 4 takes not only the investment’s net present value (NPV) into account; it also compares the cost-benefit elements of the BAU and Project variants. In the case of a project of this magnitude, it is well known beforehand that a return can only be expected in the long term, for which reason the duration of the analysis was extended until 2040. However, Figure 5 shows that in case of implementing the project, the tendency of providing a return is quite slow and would only be realized in the distant future (far exceeding the life cycle of the investment, which thus ends up being a negative externality).
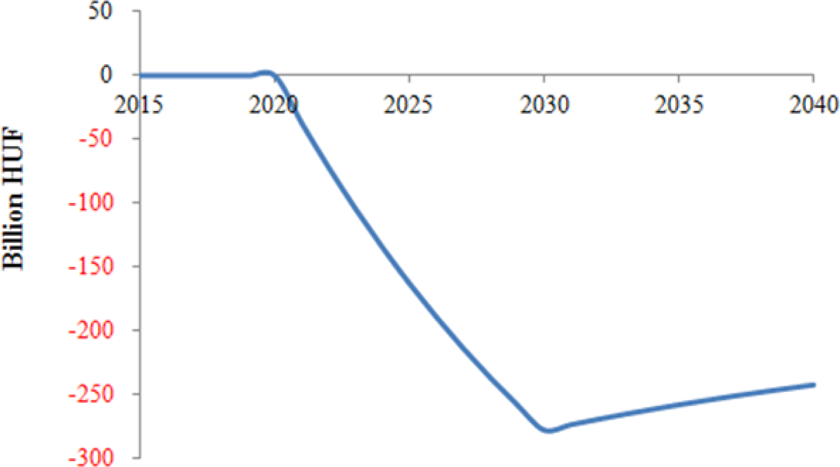
Calculation of the project’s cost-benefit additional income.

The project’s internal rate of return.
Figure 5 illustrates the internal rate of return (IRR), where the negative results are not necessarily bad, since the value is between 0% and −10%. If all other indices produce good values, the IRR value indicates that the social losses resulting from project implementation are acceptable. Thus, the project can be financed from EU funds.
However, the benefit-cost ratio (BCR) indicated in Figure 6 unequivocally suggests that the project should be cancelled. BCR1 shows the ratio of the project’s total costs to its total benefits and BCR2 shows how many times over the investment will provide a return during the program life cycle. In the best case, both values are over 1.0. The implementation should be taken into consideration if the value is between 0.5 and 1.0. However, if the value is less than 0.5, project implementation can result in serious deadweight losses for the society.

The project’s benefit-cost ratios.
Evaluation of Scenario 1
The carbon orientation matrix (Figure 7) presents a summary of the study performed in the first scenario. It shows the processes that took place within the sector after project implementation during the studied period (in the present case: until 2040). Project characteristics are indicated by the blue bubble, depending on whether the investment ended up starting to give a return and whether the results led to a decrease (−) or to a surplus (+) regarding the sector’s emissions. Although the GHG reduction was not significant and the investment provided a return only very slowly, both factors are characterized by a slow improvement over the long term (NPV, carbon balance). This is the reason why the project was placed in the bottom right in the study matrix. It means that the building retrofitting strategy proved to be acceptable, even if only by weak numbers.

Scenario 1 carbon orientation matrix.
Thus, if the subsequent scenario (concerning the construction of new buildings instead of renovating old ones) also shows similar tendencies, the difference between the efficiency of the two will determine which is preferred for implementation.
Explanation
Scenario 2: Updating the building stock with new buildings
In the second scenario, the number of housing units and the change in their area is entirely the same as the indices in the previous scenario. The difference between the two cases is merely that the renovation of the buildings is not considered at all. Instead, this scenario assumes a process in which only new building units are constructed instead of renovating existing buildings.
Carbon efficiency indices in Scenario 2
Contrary to the first scenario, the improvement in the GHG emission indices is unequivocal in the case of the construction of new buildings (Figures 8 and 9). Figure 10 remained the same only because of the previously mentioned passive nature of the sector. In addition, although the project is already effective in short term, it will result in even greater reductions after 2030. Even though its CO2e efficiency improvement per square meter is not that significant, this index is still more advantageous than in the previous scenario.

Developments in the sector’s CO2e emissions until 2030. CO2e: carbon dioxide equivalent.

Developments in the industry’s average CO2e efficiency until 2030. CO2e: carbon dioxide equivalent.

Changes in low-carbon technology ratios in the industry until 2030.
Financial return indices in Scenario 2
With regard to finances (Figures 11 to 13), this project clearly provides the best results among the studied projects. It has already been discussed above that an initiative of such magnitude cannot provide positive NPV results while the investments are still under way (until 2030). But, if we examine the return processes that take place subsequently, the picture is much more positive.

The additional income present value in the project’s cost-benefit calculation.

The project’s internal rate of return.

The project’s benefit-cost ratios.
The IRR diagram is naturally still negative since it does not assume a return within the studied period. Still, the BCR values indicate that more beneficial financial processes could take place in the long term (Figures 12 and 13).
Evaluation of Scenario 2
Although the results (blue bubble) of the summary figure (Figure 14) are similar in the present scenario as in the previous one (+−), the rate of the processes (return, emission reductions) also must be taken into account. Apparently, it is significantly more advantageous this time around. It has already been noted that in the case of a project of this magnitude (1.746 billion Hungarian Forints (HUF)), a long-term return is natural due to the high investment costs. However, the fact is that tendencies are much more positive in this case than in the scenario realizing the simple retrofitting strategy. Since the return time is shorter and the GHG reduction rate is also significantly more efficient, it can be stated that relying on newly built buildings leads to a more viable decision in the terms of economy and environment.

Scenario 2 carbon orientation matrix.
Conclusions
The present analysis was based on the question of whether the present trend of mainstream business management is worth continuing (which is equal to the reconstruction of already outdated 30–40-year-old buildings), or whether the construction of new buildings in their stead would be a better option. The question may arise why the mixture of both has not been assessed as well. The answer is that the practical implementation will probably follow this mixture concept if the latter scenario proves to be superior. Still, the clear visualization of the differences requires an analysis which examines the extreme cases. The issue is naturally complicated by factors such as the questionability of developing old buildings over the long term and the high costs of new construction projects. The present study aimed to provide an answer to the climate policy question of which version could be more advantageous for reducing GHG emissions and what financial factors are connected to that. The “carbon orientation matrices” introduced before, fundamentally aimed at presenting the financial and carbon reduction aspects of various developments. The “relative carbon cost” figure (Figure 15) was created in order to compare the different scenarios. The two scenarios can be visually compared to each other based on their economic and environmental performances. The logic of their placement essentially remained unchanged; however, the sizes of the bubbles play an important role in this figure. Bubble size indicates the resource requirements of the given project: What amount is equal to a savings of 1 t of CO2e in the period between 2020 and 2030 (if the carbon change is negative) or to the emission of 1 t of CO2e in the same period (if the carbon change is positive)? This also makes it possible to see what the previous equations have failed to show (and were included only in various financial indices): The more beneficial climatic effects of “Newly built” developments. Figure 15 illustrates that the Newly built program requires a smaller nominal investment and its return is much more beneficial than the “Renovated” version—that so many people prefer. The sizes of the balls also show that the carbon efficiency rate of the Newly built program is almost twice the size.

The relative carbon costs of the scenarios included in the analysis.
Based on the study, it can be stated that the strategy of Newly built systems also determines additional target mechanisms and directions for development. In the future, one of the most important paths for development is the construction of “smart metering” and “smart grid” systems, which are keys to the future “low-carbon” society. The excessive preference of short-term solutions and social satisfaction in this field may lead to serious deadweight loss. If the upcoming EU funds are used in a manner concentrating building renovation programs, the development of systems supporting modern (low-carbon) consumption can end up being delayed for up to 8–10 years. This will result in irrecoverable disadvantages for Eastern European countries compared to Western European consumption systems.
Footnotes
Declaration of Conflicting Interests
The author(s) declared no potential conflicts of interest with respect to the research, authorship, and/or publication of this article.
Funding
The author(s) received no financial support for the research, authorship, and/or publication of this article.