
Abstract
The Intergovernmental Panel on Climate Change (IPCC) indicates that the waste sector is a potential emitter of methane gas (CH4), which has a greenhouse effect up to 28 times greater than that of carbon dioxide (CO2). The management of municipal solid waste (MSW) generates greenhouse gases (GHG) directly through emissions from the process itself as well as indirectly through transportation and energy consumption. The objective of this study was to evaluate the GHG emissions contributed by the waste sector in the Recife metropolitan region (RMR) and to define mitigation scenarios to comply with the Brazilian Nationally Determined Contribution (NDC), a result of the Paris Agreement. To achieve this, an exploratory study was carried out, including a literature review, collection of data, estimation of emissions using the IPCC model (2006), and comparison between the values assumed by the country in 2015 and those estimated in the adopted mitigation scenarios. The RMR is composed of 15 municipalities, has an area of 3,216,262 km2 and a population of 4,054,866 inhabitants (2018), generating approximality 1.4 million t-year of MSW. It was estimated that, in the period from 2006 to 2018, 25.4 million tCO2e were emitted. The comparative analysis between the absolute values defined in the Brazilian NDC and the results from the mitigation scenarios showed that approximately 36 million tCO2e could be avoided through the disposal of MSW in the RMR, equivalent to a 52% reduction in emissions estimated for 2030, a percentage greater than the 47% reduction assumed in the Paris Agreement.
Introduction
Since the Stockholm Conference in 1972, the environment has become a truly global concern and a definitive part of international negotiations (Gama, 2003). More than 178 countries, 102 heads of state and around 4000 non-governmental organizations participated in the United Nations Conference on Environment and Development, held in Rio de Janeiro, Brazil in 1992 and known as Eco 92. This conference sought to develop strategies to control environmental degradation and promote sustainable development. Among the results from this event was the convention on climate change, known as the United Nations Framework Convention on Climate Change (UNFCCC).
Literary review
The UNFCCC came into force in March 1994 and in December 2015, with 197 countries adhering, with the aim of stabilizing the concentration of greenhouse gases (GHG) in the atmosphere at a level that would avoid dangerous anthropogenic interference with the climate (BRAZIL, 2010). On the other hand, more than half of the world’s population (3.6 billion) lives in cities (PBMC, 2016).
In terms of growth, an increase in urban population of 5.6 to 7.1 billion people is expected between 2018 and 2050, or 64 to 68% of the world population (UN, 2018). As a result, the production of materials necessary to support this urban growth will alone generate 10 billion tons of carbon emissions, that is, about half the total allowed in order to meet the goal of limiting the average temperature increase of the planet to 2°C by 2100 (PBMC, 2016).
GHG emissions have been the subject of studies by the Intergovernmental Panel on Climate Change (IPCC), created in 1988 at the initiative of the United Nations Environment Programme (UNEP) and by the World Meteorological Organization, with the purpose of providing comprehensive assessments with scientific, technical and socioeconomic knowledge on climate change, its causes, repercussions and response strategies.
The guidelines of the IPCC have been adopted worldwide for quantifying the national emission inventories, which include wastewater treatment plants as a key category (Paredes et al., 2019). The method distinguishes between the categories of disposal and the waste treatment in accordance with the physical nature of the residue responsible for the generation of GHG (i.e. landfill, incineration, composting, etc.) (Loureiro et al., 2013).
The IPCC (2016) presents evidence that the planet has been warming up since the pre-industrial era, that human action is one of the most relevant factors in this process (PBMC, 2016), and that the principal contributions to emissions come from cities. Urban centres are responsible for 70% of the available energy consumption and 40% of GHG emissions (European Climate Foundation, 2014; Rosenzweig et al., 2011).
According to the IPCC (2016), the Convention on Climate Change and the Kyoto Protocol regulate several GHG, of which the principal GHGs are methane (CH4) and carbon dioxide (CO2).
One of the most important by-products of urban living is solid waste, which stands out as a principal cause of environmental impacts and generation of GHG, especially methane (CH4) and carbon dioxide (CO2), derived from industrialization and urbanization (IPCC, 2014). In addition, all waste management practices generate GHG, either directly through emissions from the process itself or indirectly through transportation and energy consumption, for example (UNEP/ISWA, 2015). GHG emissions from methane are 28 times more damaging in terms of a global warming potential (GWP), considering a 100-year time horizon, than those from CO2 (Seeg, 2017).
According to the IPCC (2014), in global terms, emissions related to transportation and energy consumption are those that contribute most to climate change, with values equivalent to 26 and 30% of total global emissions, respectively. The IPCC also points out that the waste sector contributes about 3 to 5% of total global anthropogenic GHG emissions (IPCC, 2014, 2016).
It is noteworthy that, although globally the contribution of solid waste emissions is 3 to 5%, GHG inventories carried out locally showed that this percentage is much more representative. Solid waste emissions in the state of Pernambuco, for example, progressively increased from 5.5 to 6.1 million tCO2e between the period 2015 and 2018 (PERNAMBUCO, 2019), and successively representing approximately 28%, second in the ranking of total emissions in the state, when compared to the sectors of transport 32%, land use 25% and energy 15%. In the same way, Loureiro et al. (2013) stated that in Rio de Janeiro city, the waste sector was the second largest source of GHG emissions, representing 21.0% of total municipal emissions. Solid waste subsector accounted for the second largest source of emissions of subsectors in Rio de Janeiro city, corresponding to 14.1% of total emissions, behind only emissions from light road transport, part of energy use sector, corresponding to 26.2% of total emissions in the city. Both cases are very high when compared to the representativeness of this sector in Brazil, which is around 3% (Brazil, 2016).
Organic waste disposed in landfills is one of the main sources of methane (CH4) emissions (IPCC, 2014). The landfill sites contain nearly 50–60% of organic contents, and they undergo anaerobic decomposition with a help of microbes in the waste dumps and contribute to a higher percent of methane emissions (Ramprasad et al., 2022). These emissions are projected to potentially increase fourfold from 2010 to 2050, due to population growth and economic development in low- and middle-income countries (UNEP, 2011).
This sector, however, has the greatest mitigation potential, with repercussions in other sectors, such as energy and agriculture.
A holistic approach to waste management has positive consequences for emissions from the energy, forestry, agriculture, mining, transportation and manufacturing sectors (UNEP, 2011).
Pursuing the prioritization of waste prevention and recovery as secondary materials or energy is fundamental, because a significant increase in waste management practices in anaerobic conditions in landfills means an increase in the generation of methane gas emission. In recent decades, waste disposal occurred in sanitary landfills, controlled landfills and dumps, which according to (Brazilian Association of Cleaning Companies Public and Special Waste (ABRELPE) 2016), Seeg (2017), Paz and Firmo (2015) and Jucá et al. (2013) contribute differently to the generation of GHG. The sanitary landfills, through anaerobic biodigestion, generate more methane than controlled landfills or dumps, if the biogas is not collected and do not have beneficially used.
Anaerobic digestion is a biological process that decomposes organic waste, producing biogas. According to Santos et al. (2020), anaerobic digestion is a viable alternative to treat solid waste, because some of the waste generates renewable energy, produces biofertilizers and mitigates emissions.
Oliveira et al. (2018) adds that anaerobic digestion, as a treatment for the organic fraction of solid and semi-solid residues and to produce methane, is a technology used worldwide.
According to Costa and Dias (2019), the use of biogas, besides being a renewable source of energy, also contributes to the reduction of methane and carbon dioxide emissions in the atmosphere, gases that aggravate the greenhouse effect.
Sustainable waste management is relevant for the reduction of GHG emissions, with the sector having the potential to become a mitigation option instead of an emissions source in a circular economy approach that includes the elimination of waste through the reuse of materials and components and the extension of product life (GIZ, 2017). The efficiency of basic management processes such as collection, transportation and disposal is directly related to the reduction of GHG emissions (Caetano et al., 2019).
The disposal and treatment of solid waste is the third more important emission source requiring education campaigns to sustainable consumption and technologies to avoid GHG emissions during solid waste treatment (Baltar et al., 2021).
Global GHG emissions from the waste sector amounted to around 1.5 GtCO2e in 2010, of which approximately 0.6 GtCO2e were due to the disposal of solid waste, 0.75 GtCO2e were from effluents, and the remainder was from incineration and other waste treatments (IPCC, 2014). In 2016, there were 1.6 GtCO2e (Seeg, 2017).
According to (UNEP, 2018), in order to limit warming to 2° Celsius by 2100, it will be necessary to reduce GHG emissions in 2030 to 20% less than 2010 levels and to reach zero emissions by 2075.
The state of Pernambuco in Brazil is one of the most vulnerable regions in the world to the effects of climate change, especially the Recife metropolitan region (RMR). De fact, IPCC (IPCC, 2016) recognized Recife, capital of Pernambuco as one of the most vulnerable cities to climate change in the world, due to geographical characteristics and the process of historic urban occupation (Baltar et al., 2021).
The legal framework for solid waste management in Brazil was defined by the National Policy for Basic Sanitation, Law no. 11,445/2007 (BRAZIL, 2007), and the National Policy for Solid Waste (PNRS), Law no. 12.305/2010 (BRAZIL, 2010), which defines principles, guidelines, and obligatory waste plans, which are the most significant management instruments. In a complementary way, creates the entire legal framework for the establishment of public-private partnerships, promoting necessary private sector participation. In 2015, Law no. 13.089 (BRAZIL, 2015b), instituted the Metropolitan Statute, which defines public functions of common interest for metropolitan regions and considers solid waste to be a public concern, whose generation constitutes a high potential for emission of GHG.
Costa et al. (2019) observed that even with almost a decade since the approval of the PNRS, the garbage collection process is still not contemplated throughout the country. According to the ABRELPE (2019), in 2017, approximately 7 million tons of waste generated had unidentified destination.
In 2009, Law no. 12.187/2009 of the National Policy on Climate Change defined voluntary targets for reducing GHG of between 36.1 and 38.9% of projected emissions by 2020.
The Paris Agreement (BRAZIL, 2015) came into force at the international level in November 2016. Brazil committed to adopt measures to reduce GHG through a nationally determined contribution (NDC).
The Brazilian NDC applies to the economy as a whole in order to achieve the 2025 and 2030 goals (BRAZIL, 2017). Despite challenges such as eradication of poverty, education, public health, employment, housing, infrastructure and access to energy, according to (Kässmayer and Fraxe Neto, 2016), Brazil reduced its emissions by more than 41% in 2012, compared to 2005 levels, although currently the trend is for emissions to increase by around 18%.
The Brazilian NDC is committed to reducing GHG emissions by 37% by 2025 and 43% by 2030, compared to 2005 levels, in several sectors of the economy, including the sector responsible for treatment and final disposal of solid waste. This is equivalent to an emissions ceiling of 1.300 and 1.200 MtCO2e in 2025 and 2030, respectively (BRAZIL, 2017).
Research objectives
The general objective of this study is to evaluate the contribution of the urban solid waste sector in the RMR to GHG emissions and to define mitigation scenarios that comply with the nationally determined contribution (NDC), a result of the Paris Agreement in 2015. Specific objectives were as follows:
(a) To gather primary and secondary data related to the management of solid waste and climate change;
(b) To characterize the management of household solid urban waste in the RMR during the period from 2006 to 2018;
(c) To estimate the GHG emissions from the disposal of MSW in the RMR from 2006 to 2030, based on the year 2005;
(d) To define scenarios for mitigation GHG emissions and
(e) To determine emissions that must be avoided in order to comply with the Brazilian NDC in 2025 and 2030.
Materials and methods
This study, began with an exploratory research based on a literary and legal review of the themes involved, followed by a collection of primary and secondary data from municipalities and waste treatment centres in the RMR.
Municipal solid waste (MSW) disposal sites of the municipalities in the RMR were studied and visited, taking into consideration the various categories of landfills, which went through a transition from dumps (09) to controlled landfills (03) and sanitary landfills (02), from 2006 to 2018.
Inventory of GHG emissions
To evaluate GHG theoretically, there are different mathematical methods, such as the Mexican model, the LandGEM model of the Environmental Protection Agency (EPA), the Corenostos model and the first-order decay (FOD) model of the IPCC (2006), among others.
In this study, the method chosen to carry out the GHG emission inventory was the IPCC (2006), which prioritizes the disposal of solid waste in the soil in its various categories (dumps controlled landfills and sanitary landfills) and assigns operational standards and specific local parameters, such as gravimetric composition. This method also considers the temperature and precipitation conditions in which the organic matter is disposed.
The model used was Tier2, which considers the FOD model to estimate GHG, using data from specific activities and years of the RMR and standard factors (default), represented in equations (1) and (2) as follows:

Where:
Q(t) – CH4 emitted
A – Sum normalization factor (dimensionless)
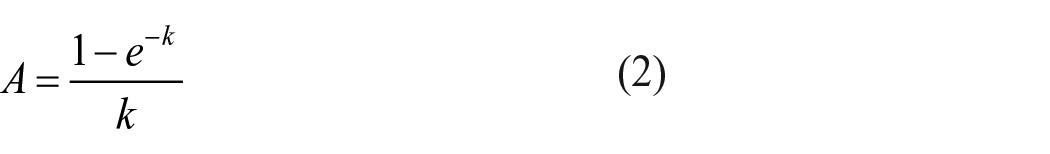
K – CH4 generation/decay constant (year – 1) year−1
X – Category of material (disposition)
t – Year to make inventory
MSW(t) – Total amount of waste generated in the year under study
MSW(f) – Fraction of waste destined for landfill in the year (dimensionless)
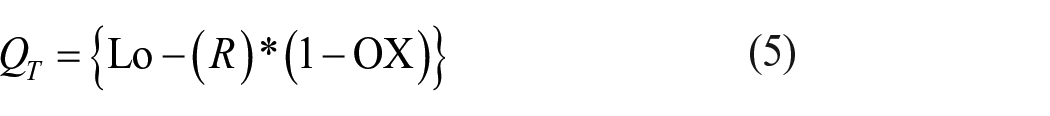
Lo(x,t) – CH4 generation potential (tCH4/tMSW)
R – CH4 recovery (tCH4.–year)
OX – Oxidation factor (dimensionless)
For the calculation K, the default values recommended by the IPCC (2006) were taken into account, considering the rainfall for tropical climate, RMR rating.
According to the IPCC (2006), CH4 (Lo) is the potential generated throughout the year and can be estimated based on the determination values of the data collected without soil and as waste management practices at the collection sites. Considering a conversion of amount of degradable organic carbon (DDOCm) in the methane generation potential (Lo), which assumes an equation (3).

In which
Lo – methane generation potential (tCH4/tMSW)
DDOCm – amount of degradable organic carbon able to decompose
F – fraction of methane in biogas (dimensional)
12/16 – Stoichiometric ratio of conversion between methane (CH4) and carbon (C) (dimensionless)
In turn, equation (4) calculates DDOCm:

Where
MSW T – total amount disposed in the year in type ‘x’ grounding [t]
DOC – degradable organic carbon (tC/tMSW)
DOC f – fraction of DOC converted into gas at the landfill (dimensional)
MCF – methane correction factor related to the management of disposal sites (dimensionless)
From equations (1) to (3), the amount of methane emitted (QT) will be determined by equation (5):
From equations (1) and (4), equation (6) will calculate the amount of CH4 emissions, below:

The object of this study is a RMR, composed of 15 municipalities, and it took as reference the 30 National Inventory Brazil, BRAZIL (2016), in which for the forecast of emission it used a municipal breakdown. In this way, sum total is given as follows:
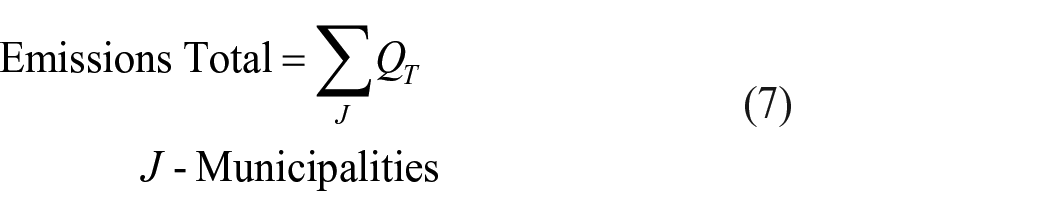
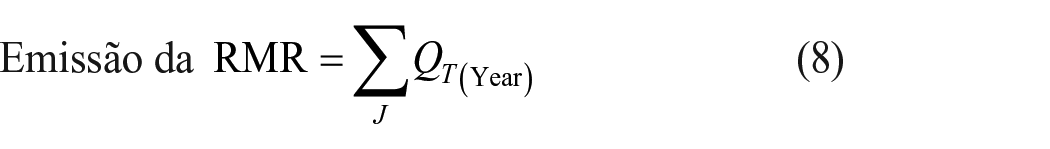
Therefore, the total emission corresponds to the sum of emissions from all 15 municipalities, for the years 2005–2030. Equation (8), adapted for RMR, per year, is
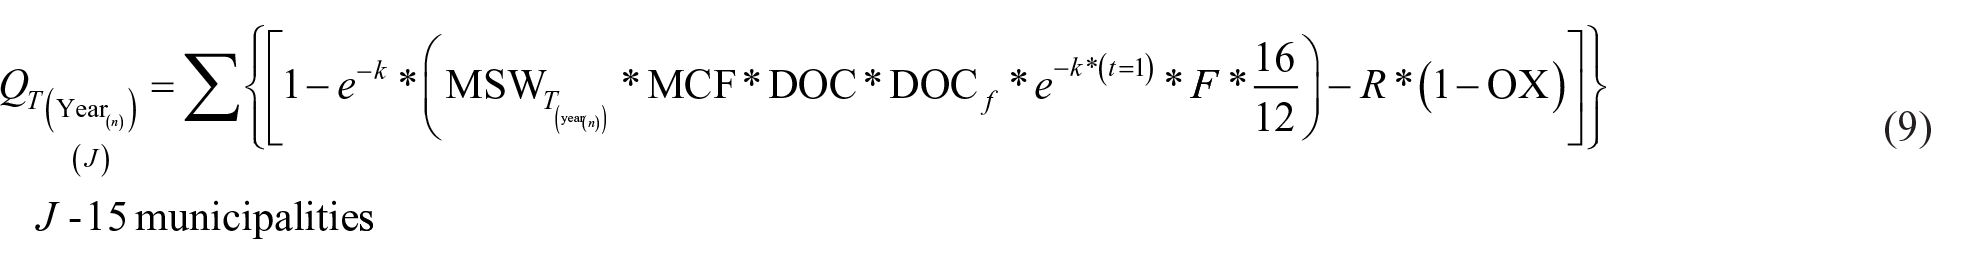
By equation (10), DOC is
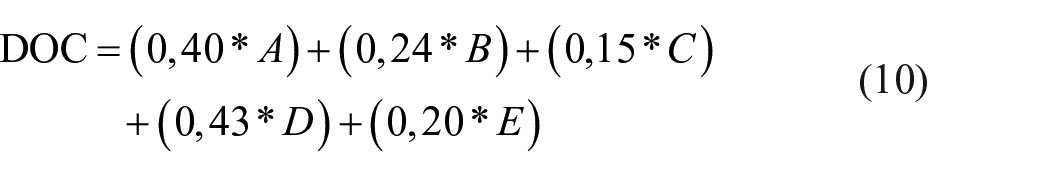
Where A, B, C, D and E corresponds to the fraction of degradable carbon in the disposed waste, obtained from the gravimetric composition.
Finally, equation (11) estimated the amount of methane emitted during the period from 2005 to 2030.
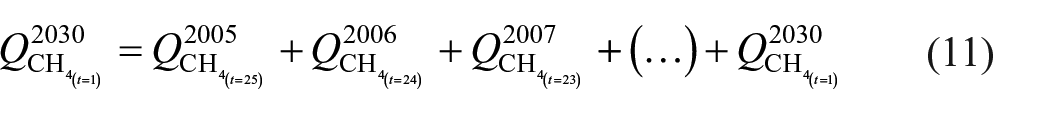
The estimated methane, converted into

Where
Adopted scenarios
The scenarios were conceived taking as a reference the definition of the IPCC (2000), according to which scenarios are alternative images of how in the future appropriate tools for analysis can be developed and how driving forces can influence the future results of emissions and assess uncertainties.
The mitigation scenarios have been built on the guidelines for national inventories of GHG emissions (IPCC, 2006), adapted to Brazilian states and municipalities boundaries.
The GHG mitigation scenarios in the RMR, also, considered the evolution of treatment processes and the ATEPE/GRS/GIZ Study (2018) for the inclusion of GHG reduction in the National Basic Sanitation Plan, whose percentages were as follows:
(a) For conventional sanitary landfills with individual flare burning – 25%;
(b) For sanitary landfills with centralized burning, with forced extraction – 50%;
(c) For sanitary landfills with gas capture for energy purposes (electricity and biofuels) 75%;
(d) For landfills sustainable energy projects, designed and operated with a view to using gas – 90%.
In this context, considering the GRS/UFPE study, a 75% reduction in emissions was defined for 02 landfills (with energy generation) and 50% (with gas capture) in 01 in the scenarios.
The period of scenarios is from 2006 to 2030, with the objective of implementing the National Solid Waste Policy and reducing GHG emissions in order to reach the Brazilian NDC (Table 1).
Scenarios built to mitigate GHGs in the RMR.
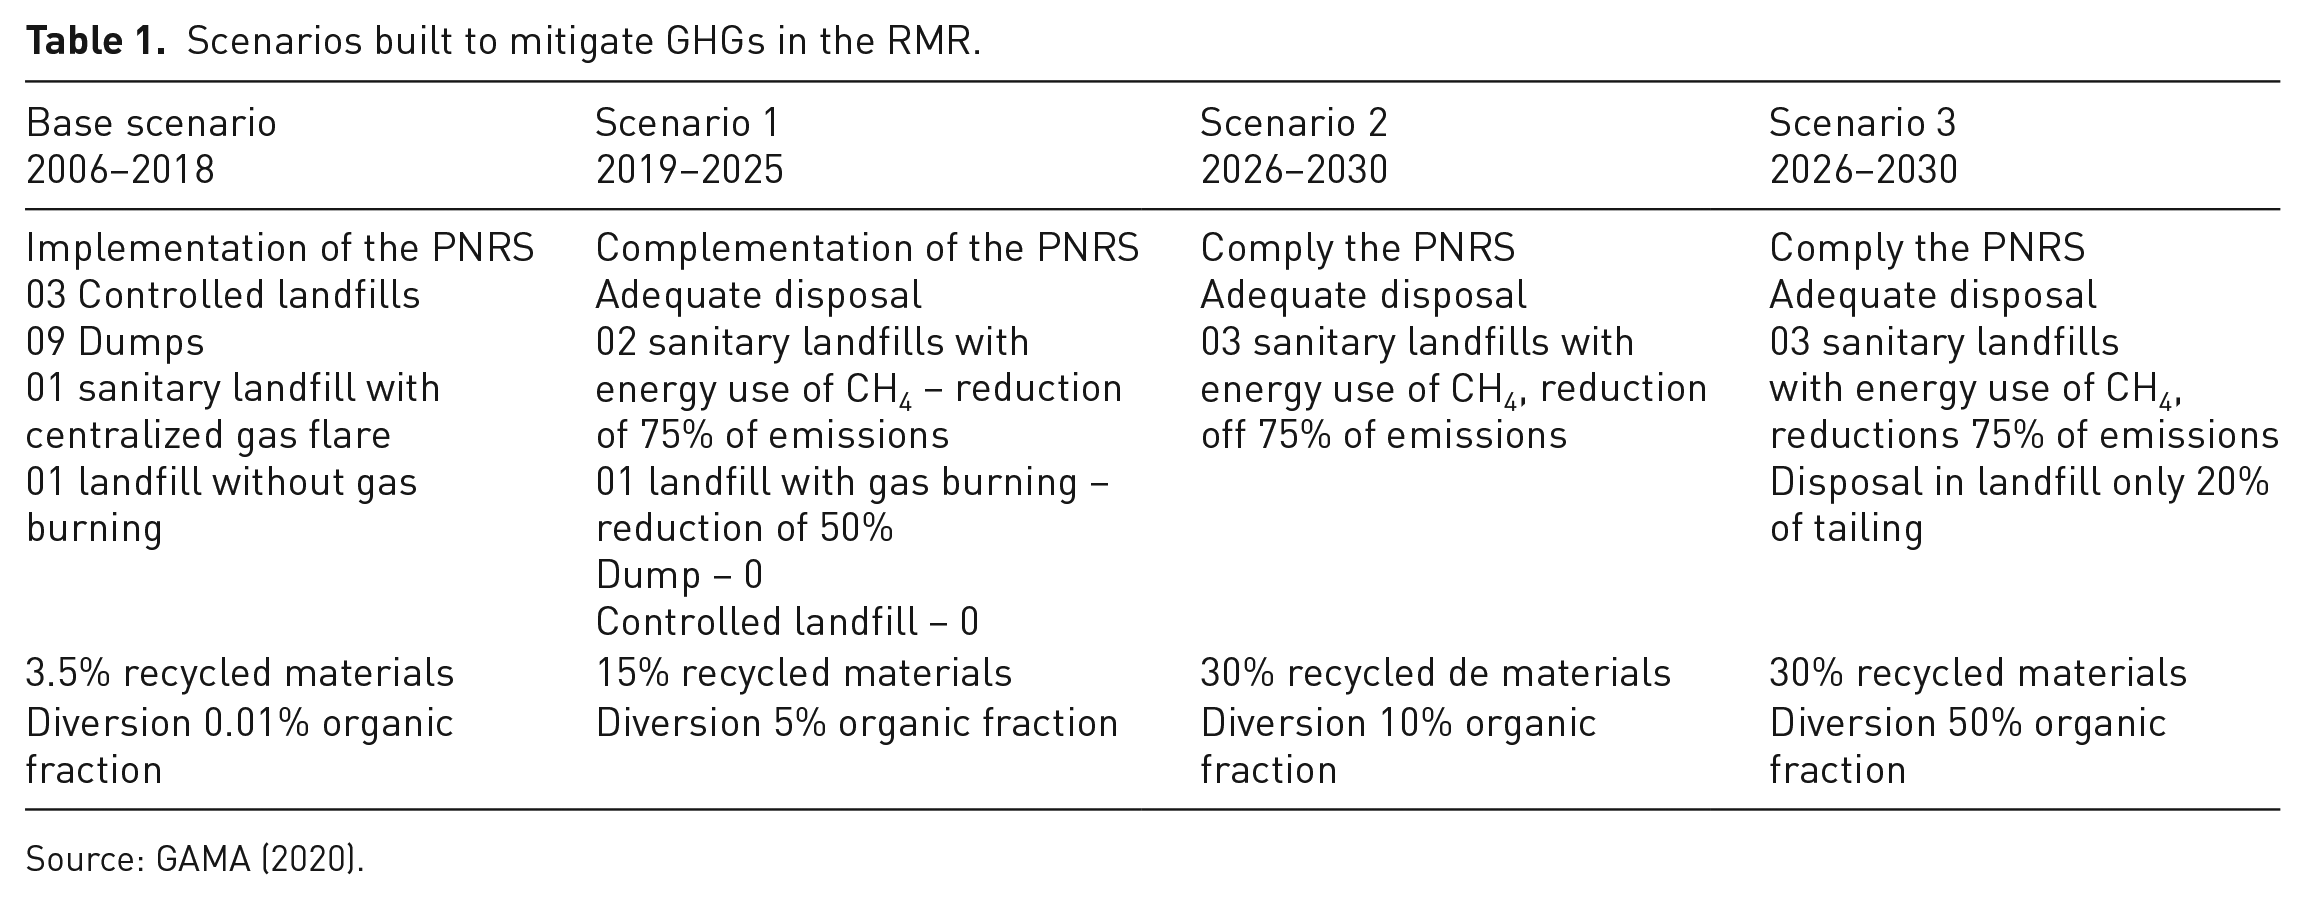
Source: GAMA (2020).
In the Base Scenario, it took into consideration the solid waste management situation in the RMR during the period from 2006 until 2018, the population growth rate from IBGE (2000 to 2010 and 2010 to 2019), and the per capita generation of waste (BRAZIL 2006 to 2017). The initially infrastructure consisted of nine dumps and three controlled landfills. It was before undergoing a transition process so that in 2018 there was one landfill with centralized gas burning and other with capture but without burning of gas, one municipal landfill without capture of the gas generated, and one dump. Only 3.5% of the recycled materials were selectively collected and 0.001% of the organic fraction was diverted from landfill.
Scenario 1, from 2019 to 2025, predicts the deactivation of dumps and controlled landfills, with a projection of having two sanitary landfills that utilize energy from the methane generated. Assuming a reduction in emissions of 75% in 02 sanitary landfills with energy use and a 50% in which that use flare gas burning. Additionally, an increase of 15% in recyclables materials and 5% in organic matter were diverted to the landfills.
Scenario 2, from 2026 to 2030, differs from Scenario 1 in that it assumes that all three landfills will make use the methane generated to produce energy, and that there will be an increase in a selective collection of 30% of recyclable materials and 10% of the organic fraction diverted from the landfills.
In Scenario 3, covering the same period as Scenario 2, assumes that, in addition to the policies adopted in the previous scenarios, there will be a 50% reduction in organic matter in landfills, as provided for in the Preliminary National Solid Waste Policy (BRAZIL, 2011).
Inputs used
Inputs included the population growth rate from the IBGE (2010/2019), the per capita generation of waste defined by the National Sanitation Information System (SNIS) (2006 to 2017) for RMR municipalities.
For the purpose of gas generation calculations, three input conditions were analysed in the IPCC (2006) model, considering the DOC and k – kinetic decay constant for the gravimetric components assigned by the IPCC (2006). Conditions: (a) maximum values of the recommended range, (b) the IPCC default (2006) and (c) the optimized values, obtained by Firmo (2013) in a survey carried out at the Muribeca controlled landfill, located in the RMR.
According to Firmo (2013), the relative error obtained between the optimized data in the RMR landfill experiment and the IPCC defaults (2006) was 12.6%. Acceptable error, if compared with the results obtained of 18% by Oonk et al. (1994) using the multicomponent first-order model in 08 MSW landfills in the Netherlands. As well, Ogor and Guerbois (2005) stated that it was not possible to obtain estimates with relative errors of less than 10%, even with the optimization of the parameters, in an experiment in 05 sanitary landfills in France.
Choosing to use the values obtained in the optimized model by (FIRMO 2013; FIRMO et al., 2011) considering that, in addition to the data having been experimentally generated in a controlled landfill in the RMR, such values are relevant when compared with the default and maximum default of the IPCC, for presenting an acceptable deviation of approximately 10%. Figure 1 shows the behaviour of the 03 situations studied.
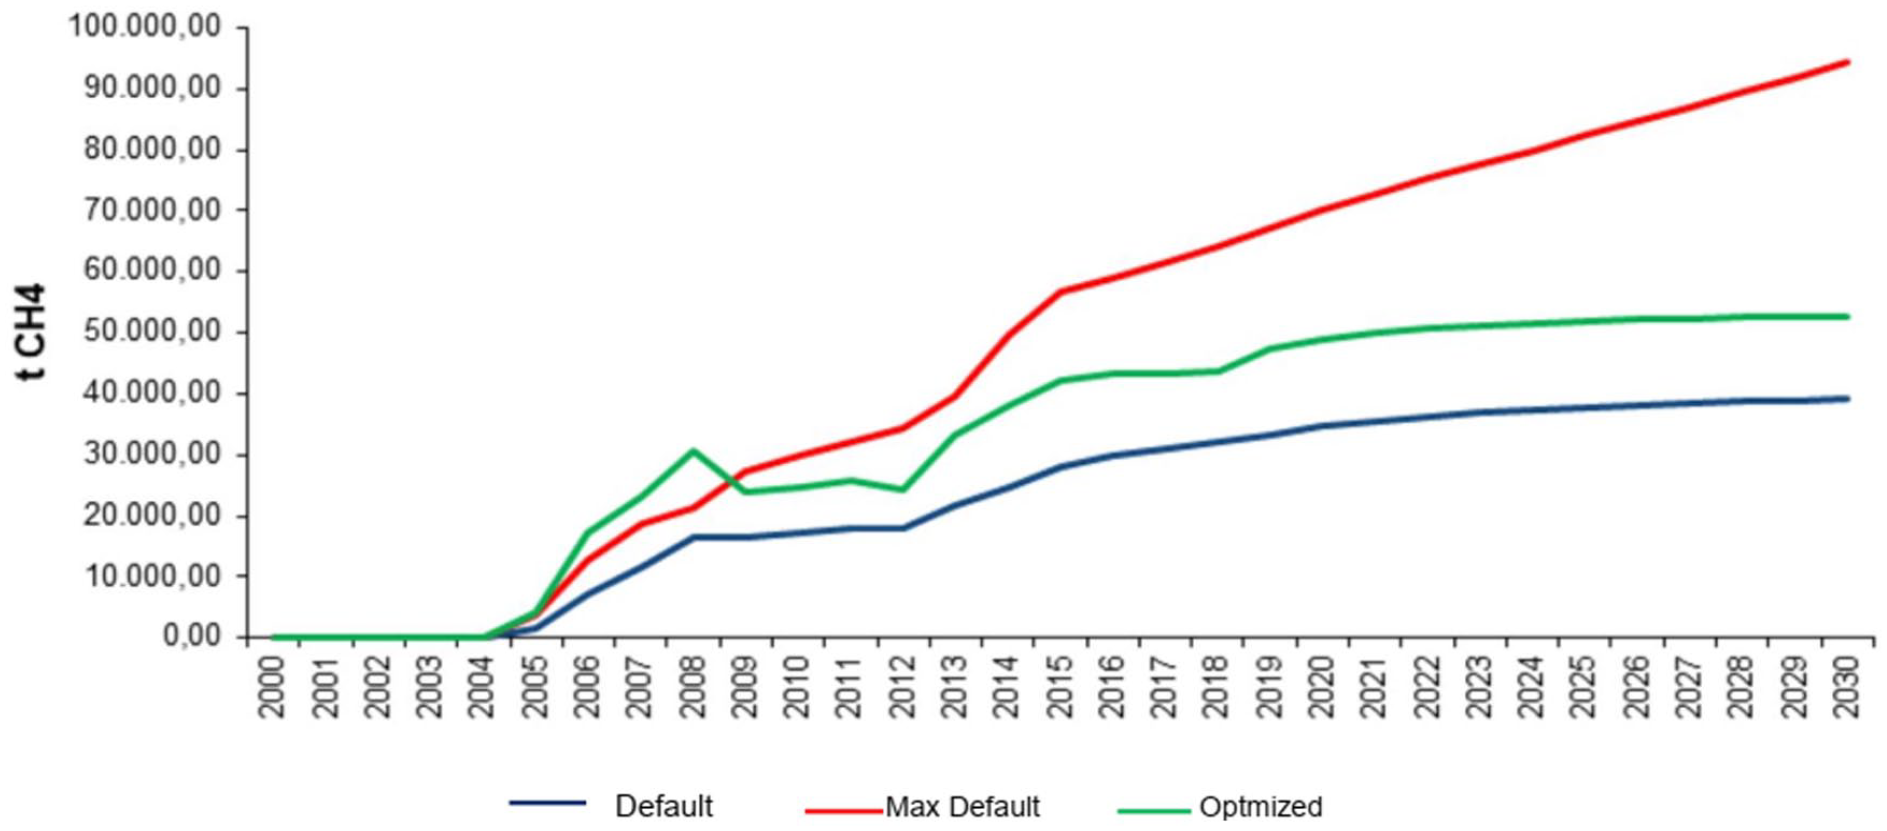
Behaviour of input values in the IPCC model – RM.
Parameters changed – variants
Parameters modified to estimate the scenarios were the following: MCF and gravimetric composition.
The MCF, a factor referring to the management of disposal sites, in function the evolution of technological process for treatment and disposal of MSW, which modify the MCF. In this study, there is an operational transition in the destination of dumps and controlled landfills to sanitary landfills between the scenarios.
The gravimetric composition was other altered parameters according to the percentages of reduction of recyclable and organic material attributed for each scenario.
In Table 2 are the inputs: variants and constants used in the IPCC, 2006 model, considering the operational process and gravimetric component.
Inputs: (a) MCF, (b) gravimetric composition and (c) constant by gravimetric composition.
(a) Recommended values for the MCF.
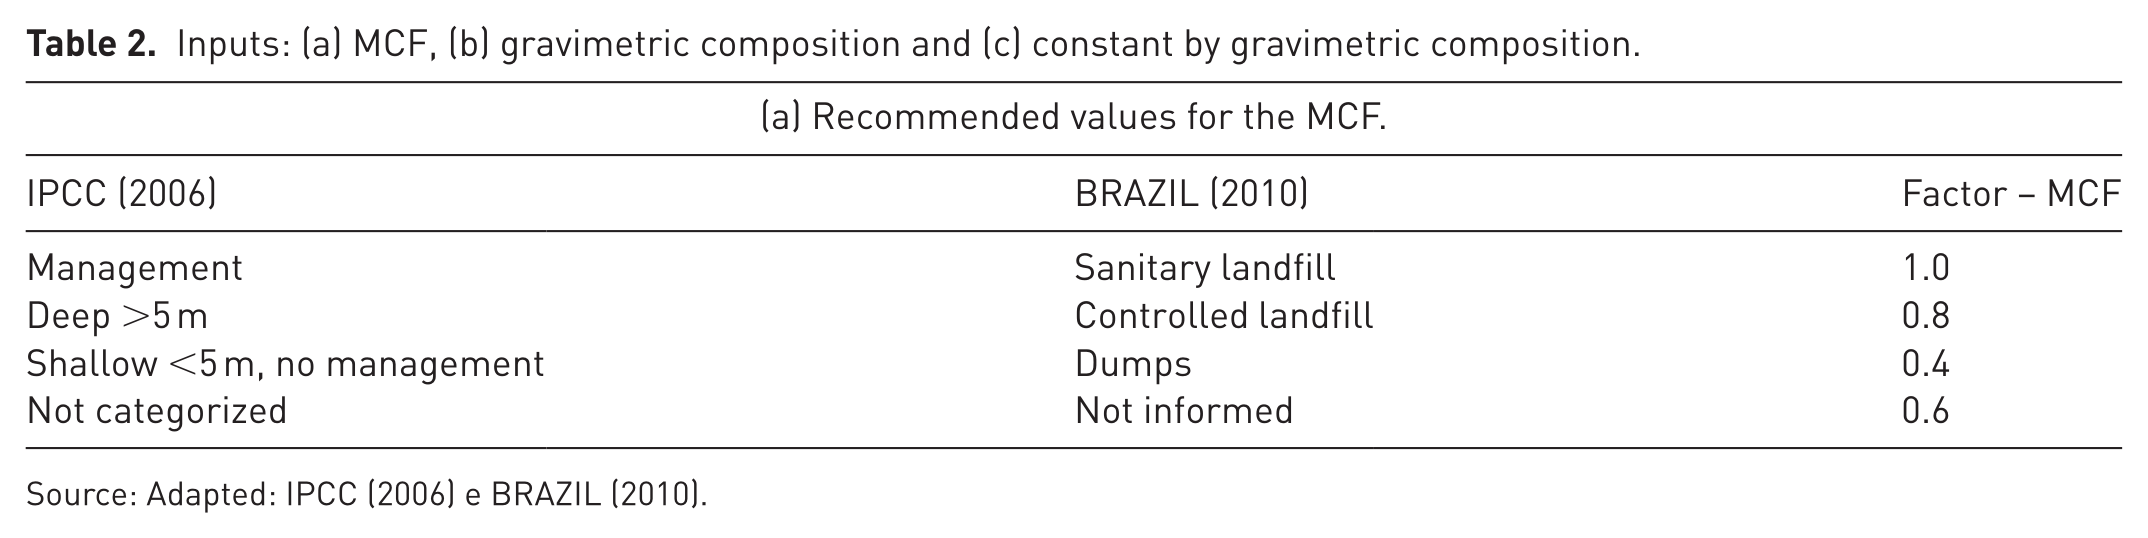
Source: Adapted: IPCC (2006) e BRAZIL (2010).
(b) Gravimetric composition according to scenarios (%).
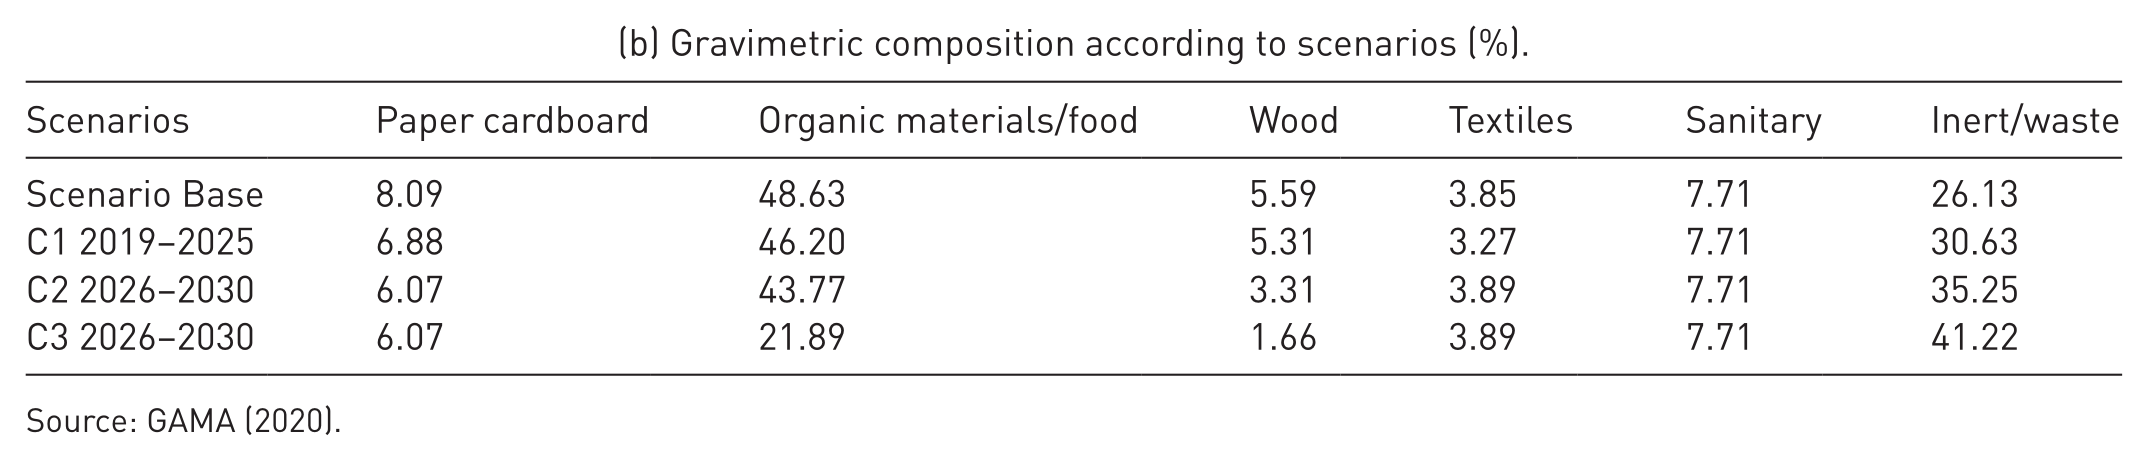
Source: GAMA (2020).
(c) Constants used by gravimetric component.
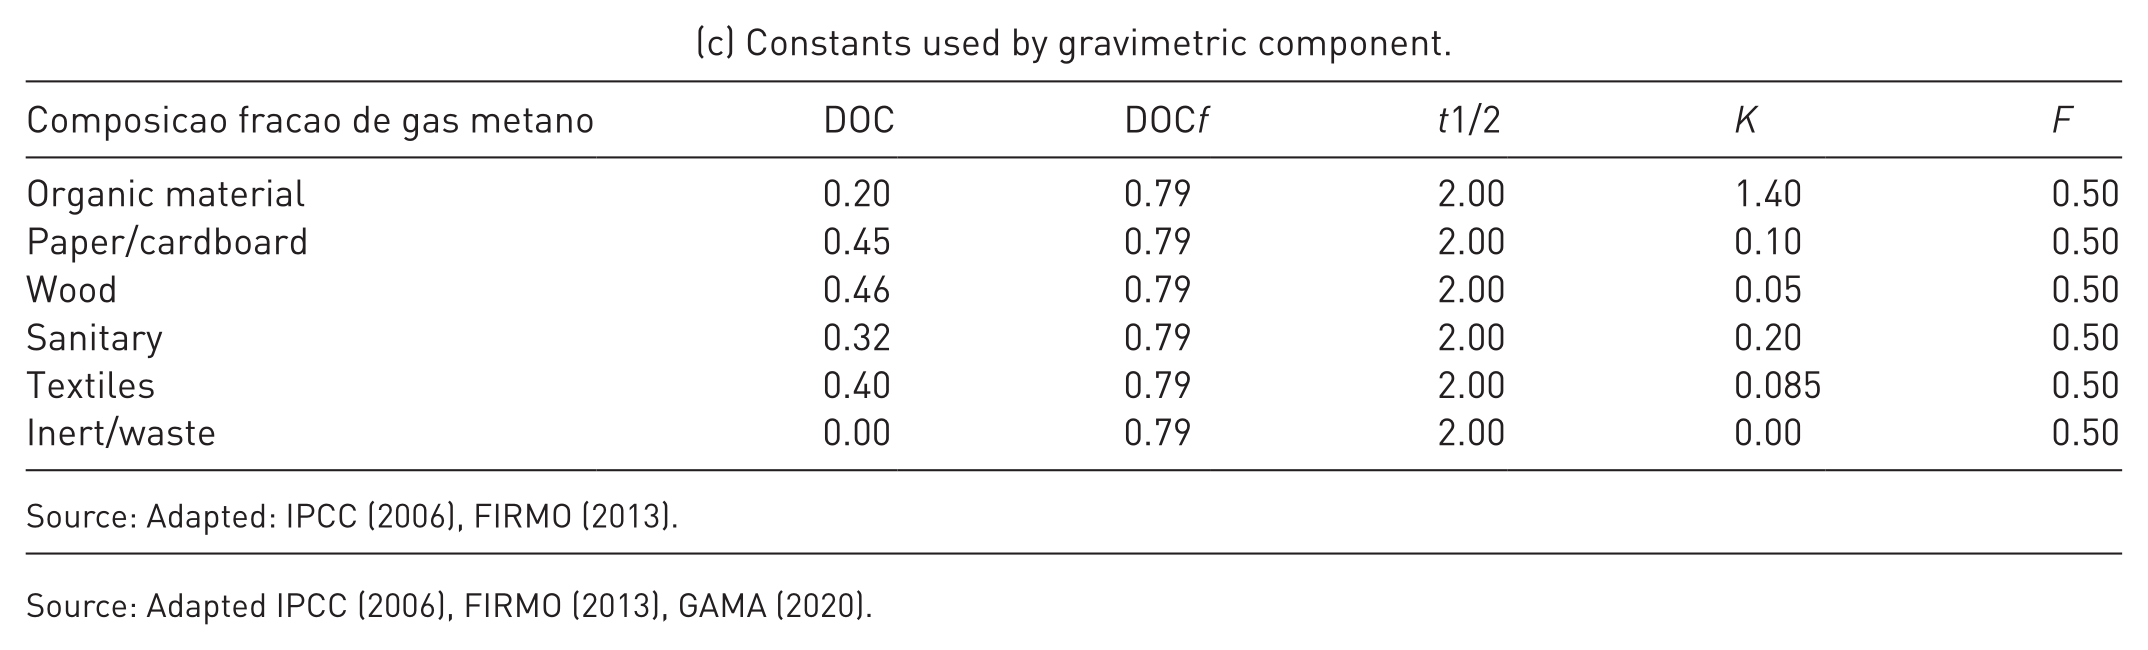
Source: Adapted: IPCC (2006), FIRMO (2013).
Source: Adapted IPCC (2006), FIRMO (2013), GAMA (2020).
Permissible emission limits from the Brazilian NDC
To calculate the permissible values for the emissions ceiling, the targets were set out in the Brazilian NDC (BRAZIL, 2015a), of which 37% was in 2025 and 43% was in 2030, applied against the absolute value of emissions estimated in 2005 and corrected by the GWP metric of 28, in accordance with the Paris Agreement. These are the limits necessary in order to keep the global average temperature increase below 2°C in relation to pre-industrial levels both to guarantee efforts and to limit the temperature rise up to 1.5°C (BRAZIL, 2017).
The 2005 CO2e emissions were reported from Reference Report of the Waste Sector in Pernambuco as part of the Brazilian Inventory of Anthropogenic Emissions and Greenhouse Gas Removal (Firmo and Rodrigues, 2009).
Established emission targets
The emission targets for the scenarios were established by taking into consideration the National Solid Waste Police and proposals from the Brazilian Climate Forum, which provide actions to the expansion of selective collection, segregation of recyclable materials and organic, as well the capture of methane (CH4) emitted from landfills that generate energy for the implementation of the Brazilian NDC.
Concluding with a comparative analysis between the CO2e values obtained from the scenarios and the limits allowed for the period 2025–2030 by the Brazilian NDC.
The worksheets were prepared in Excel: The model (IPCC, 2006). The maps were prepared using ArcGIS, versions 10.3 (2013) and 10.7 (2019) of ESRI. (https://www.esri.com/en-us/arcgis/about-arcgis/overview).
Coverage area and population
The RMR is located on the coast in the northeast of Brazil, in the state of Pernambuco and includes 15 municipalities. In Figure 2 are maps, the estimates of the urban population of the RMR and the total and per capita waste generated in 2018.
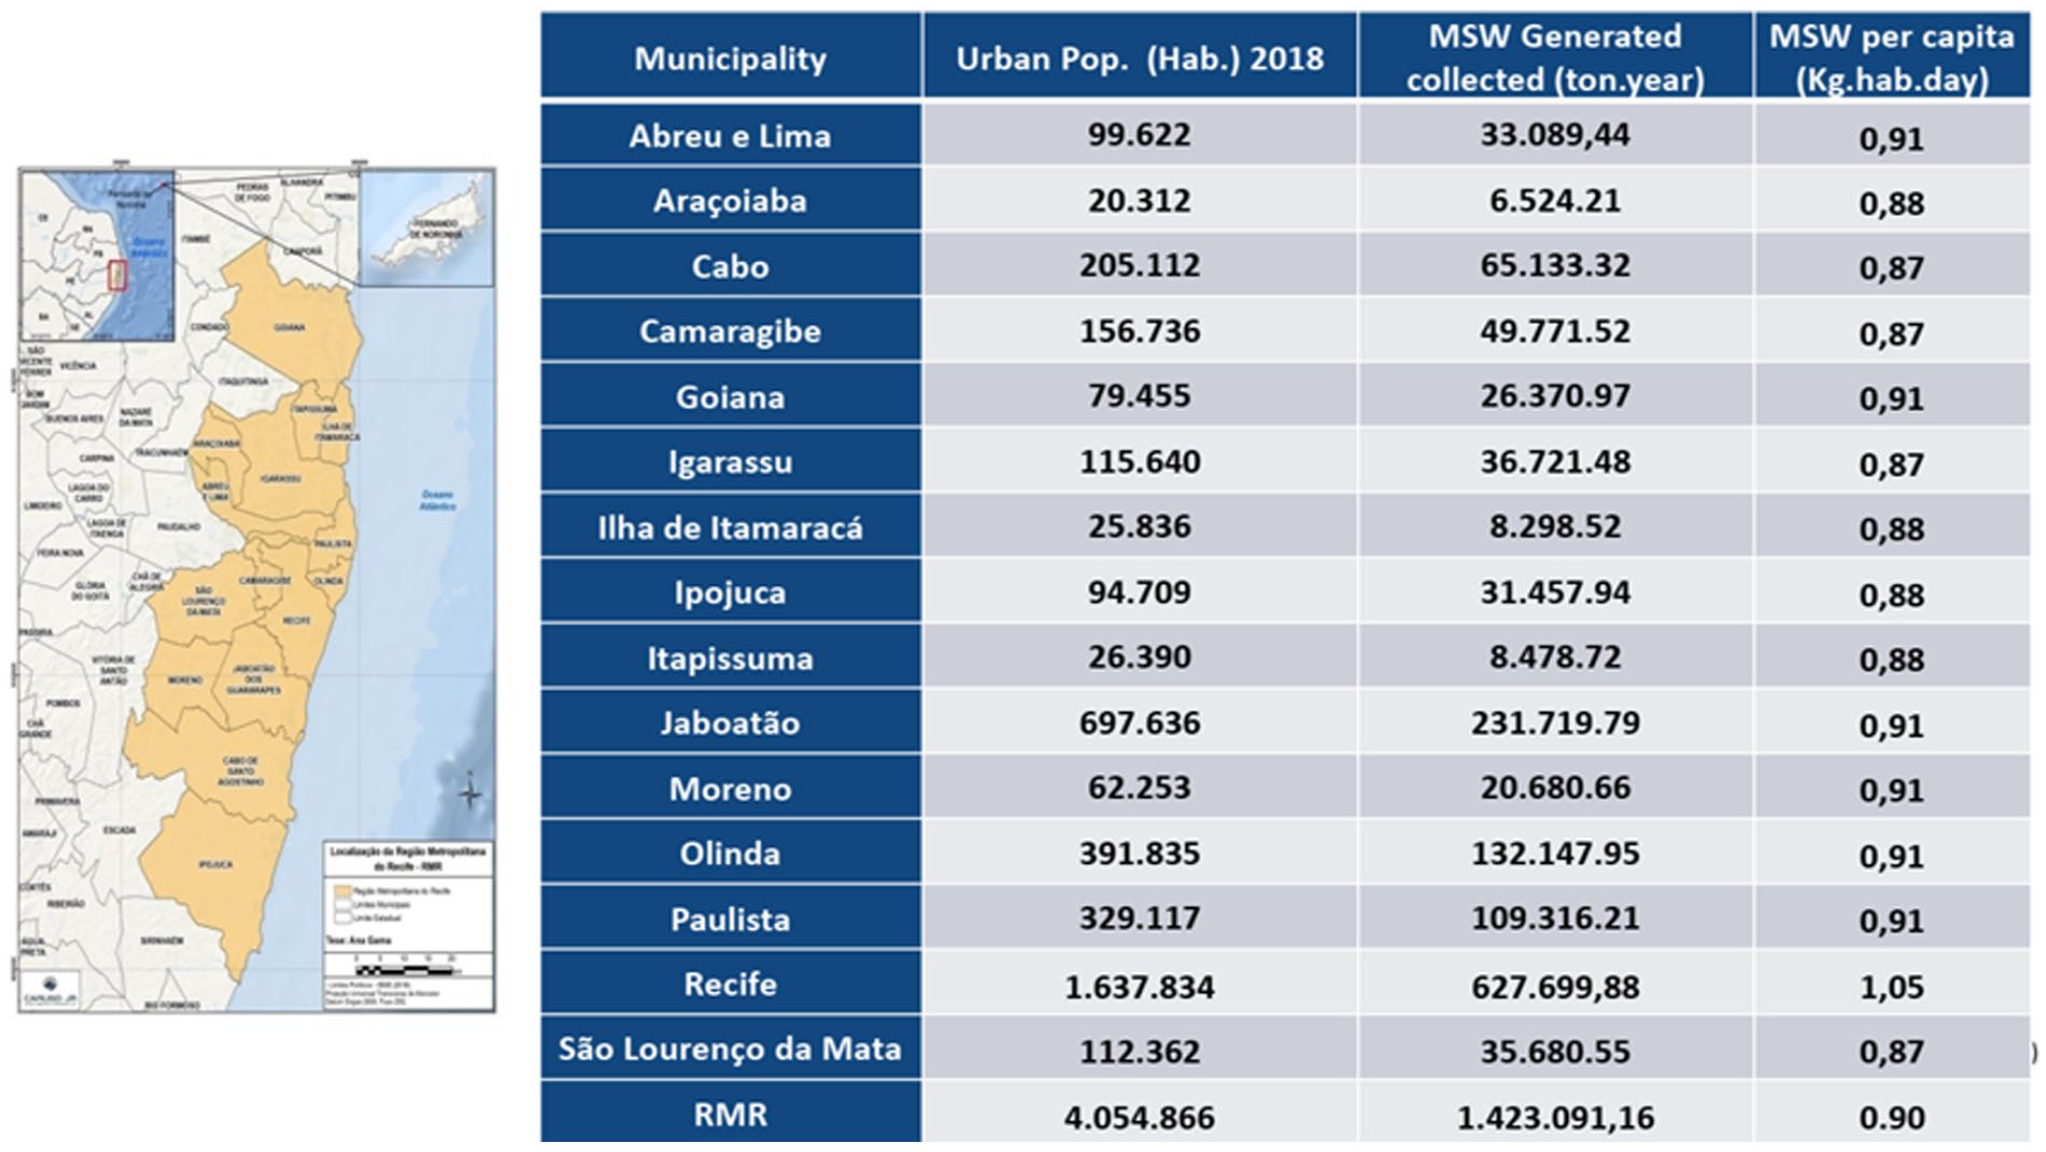
Map, population and total and per capita waste generated – RMR (2018).
Results and discussion
Situational diagnosis
The integrated management of solid waste in the RMR seeks to implement the three Rs: Reduce, Reuse and Recycle, defined in the Metropolitan Solid Waste Plan. The metropolitan MSW integrate management structure in the base year, 2018, consisted of two private waste treatment centres and a public sanitary landfill, one transfer station and two composting units, as its principal management units. One municipality disposed of waste in dump.
Municipalities have a public service management body in their organizational structure. However, most of them outsource transport and conventional collection operations, which reach an average coverage of 92% (BRAZIL, 2017; Tavares, 2018).
Supporting the system, 27 organizations of recycled material collectors carry out selective collection, and there are several voluntary delivery points for the community.
Treatment centres
The Pernambuco Treatment Centre, located in Igarassu, with an estimated useful live until 2032, serves 9 of the 15 municipalities in the RMR and is configured as an Ecopark, with mechanized treatment for sorting, production of fuel derived from waste (FDW), a compositing unit and a landfill biogas power generation unit that will soon be installed.
The Candeias Treatment Centre, located in Jaboatão dos Guararapes, with an estimated useful life until 2033, serves 05 municipalities in the RMR and produces energy from the landfill’s biogas. The Ipojuca Municipal Landfill uses gas capture.
Gravimetric composition
The gravimetric composition is in accordance to the parameters attributed to the IPCC model (2006) and using the Quartering Method – Brazilian Norma – NBR 10.007 (ABNT, 2004).
The average percentages obtained in the gravimetric study from samples weighing 110 to 150 kg, for each municipality, carried out at the disposal sites in the RMR, were the following food waste (48.63%), paper and cardboard (8.09%), textiles waste (3.85%), sanitary waste (7.10%) and wood (5.59%).
Waste disposed
In the RMR, approximately 1.22 × 10⁶ t-years were deposited, of which 0.77 × 10⁶ were deposited in the Candeias CTR Waste Treatment Centre; 63% of the total waste disposed; 0.34 × 10⁶ t-year (28%) in the Pernambuco CTR; 0.04 × 10⁶ t-year (4%) at the public landfill and 0.07 × 10⁴ t-year (5%) in dumps (Figure 3).
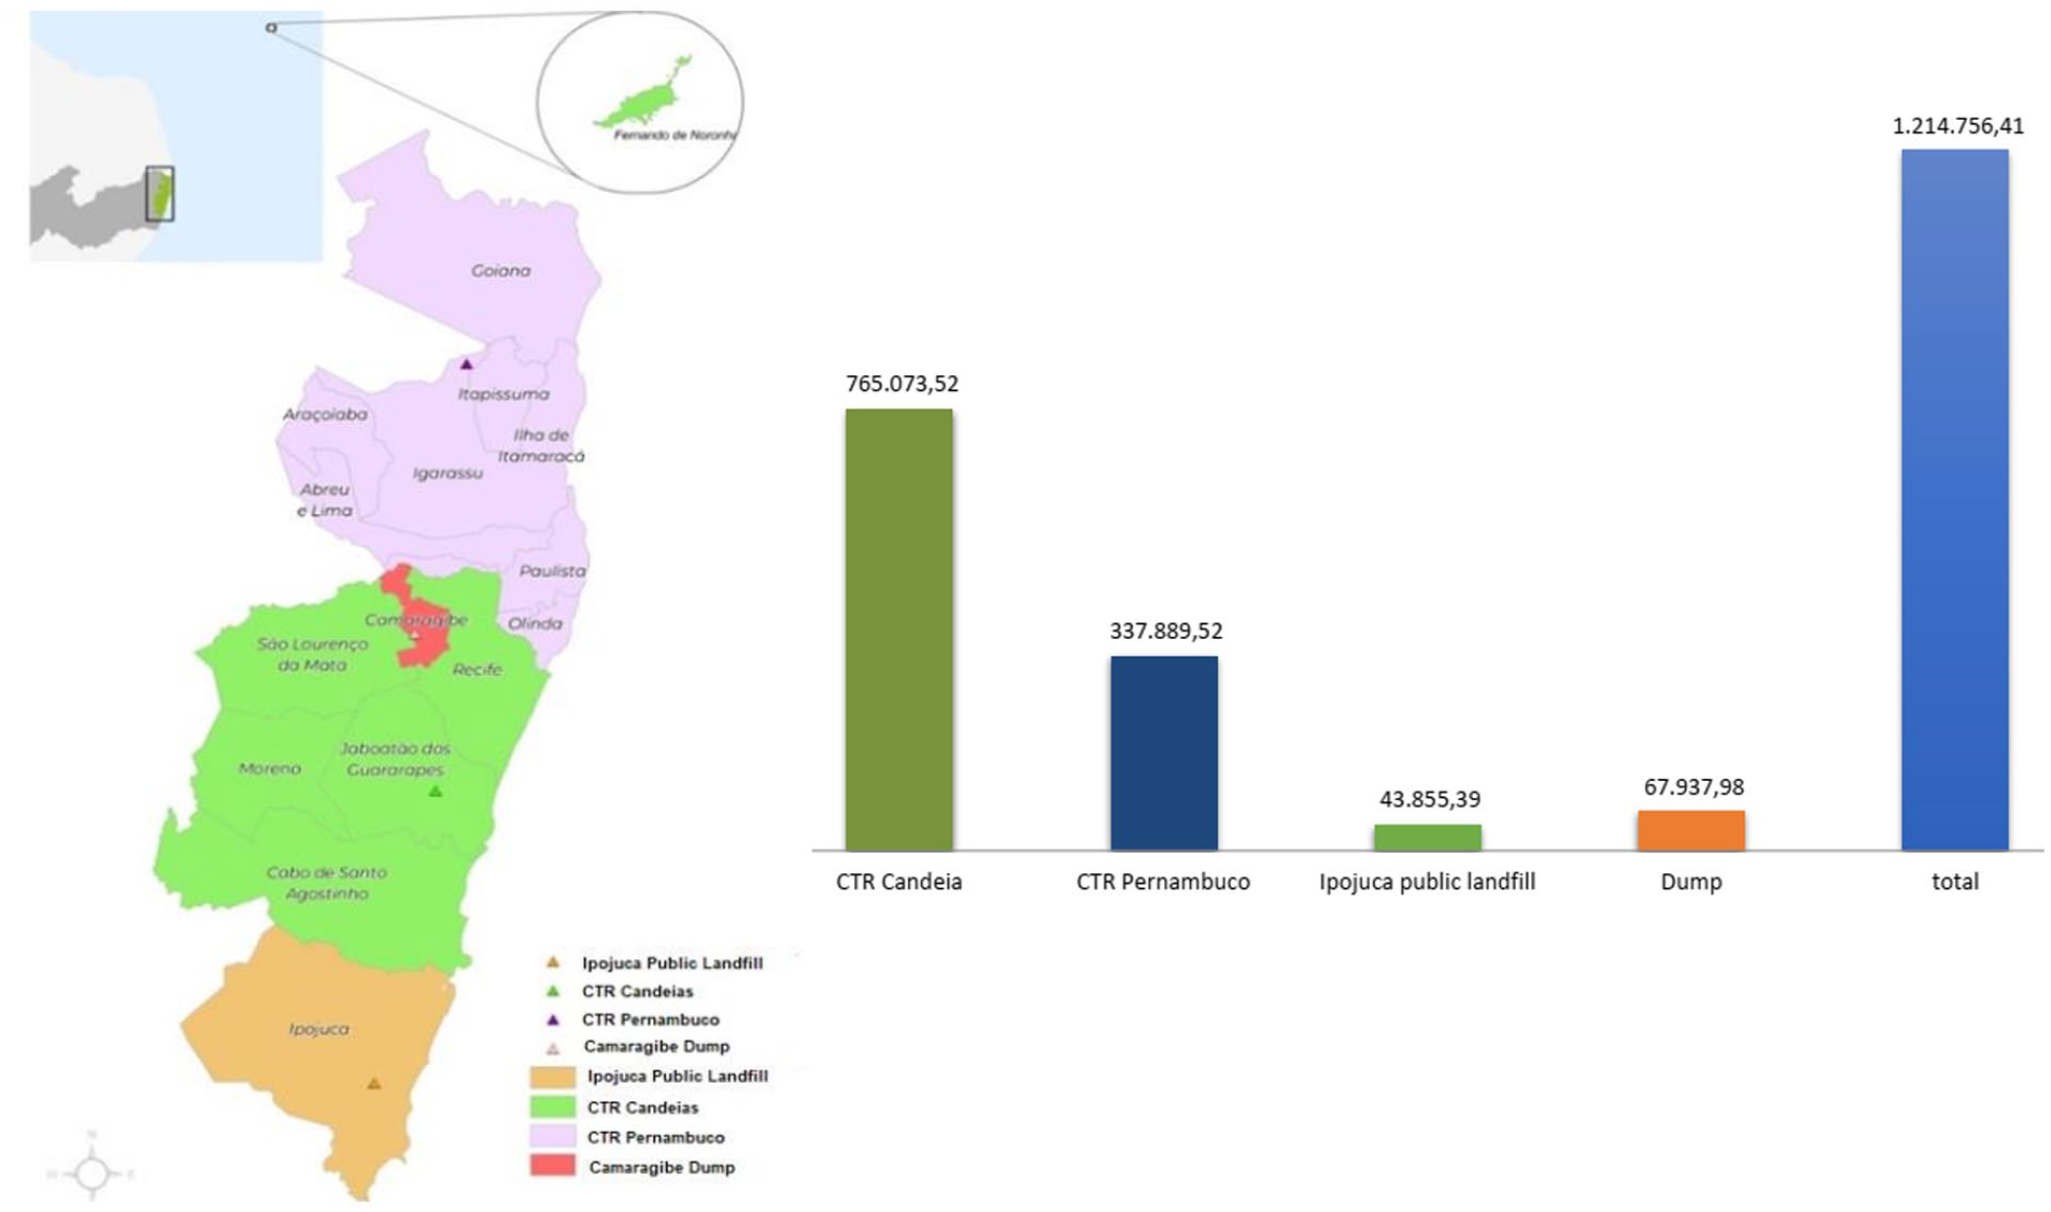
Location and amount of waste disposed in the RMR (2018).
Figure 3 shows the location of central treatment and the amount of waste deposited in each site of disposal in the RMR.
It is important to note that the municipality of Recife, which has the largest population within the RMR, deposits its MSW in the Candeias CTR.
There is a deficit of approximately 15% between the amounts of waste generated 1.42 × 10⁶ t-years (Figure 2) and the amounts disposed reported by the treatment centres and municipalities 1.22 × 10⁶ t-years, which, if collected, was in locations different from those studied or disposed of randomly on the ground by the population.
GHG emission estimates by municipalities
The results from the Inventory of Anthropogenic GHG Emissions and Removal for the period from 2006 to 2018 point out that, in their entirety, the municipalities of the RMR generated 9.04 × 10⁵ t of CH4, corresponding to 2.53 × 10⁷ tCO2e, based on the GWP metric of 28.
The municipality of Recife is the largest emitter and contributed 1.22 × 10⁷ tCO2e, approximately four times more than the municipalities in the second and third places, Jaboatão dos Guararapes with 0.38 × 10⁷ tCO2e and Olinda with 0.33 × 10⁷ tCO2e which add up to 76% of total emissions, the other 13 municipalities add up to 24%.
Comparing the data obtained from the GHG Emissions Inventory in Pernambuco, in the period between 2015 and 2018 (PERNAMBUCO, 2019), and those obtained in this study, it appears that of the 1.61 × 10⁷ tCO2e emitted by the state, 65.8% comes from the RMR, totalling 1.06 × 10⁷ tCO2e in the 4-year period studied.
Emission estimates by disposal sites
Estimates of emissions by solid waste disposal sites in the RMR, in the period from 2005 to 2018, were approximately 2.53 × 10⁷, of which 0.01 × 10⁷ from dumps, 0.37v× 107 controlled landfills and in sanitary landfills 2.10 × 10⁷ that receive most of the waste generated.
The evolution of carbon dioxide emissions from dumps over the period from 2005 to 2018, by municipalities, showed that the dumps of Ipojuca, Paulista, Cabo de Santo Agostinho and Abreu e Lima were the ones that contributed and those of São Lourenço and Camaragibe continue with the same pattern of contribution.
From 2009, there was an increase in the disposal of waste in landfills and between 2011 and 2018, most municipalities began to dispose of their waste at RMR treatment centres to meet the National Solid Waste Policy - PNRS and then, the consequent gradual deactivation of dumps. In fact, in 2017, there were 02 active dumps and in 2019 only one, closed in 2020.
Controlled landfills – AC contributed approximately 0.37 × 10⁷ tCO2e. These were Muribeca in Jaboatão dos Guararapes and Aguazinha in Olinda, which contributed to the generation of approximately 0.30 × 10⁷ tCO2e and 0.06 × 10⁷ tCO2e, respectively, over the period from 2006 to 2018. These two controlled landfills received waste from the most populous municipalities, such as Recife, Jaboatão dos Guararapes and Olinda. In 2013, the municipality of Ipojuca transformed its dump into a controlled landfill, which operated in this manner until 2018 and generated approximately 0.01 × 10⁷ tCO2e.
Figure 4 shows the emission estimated by disposal sites.
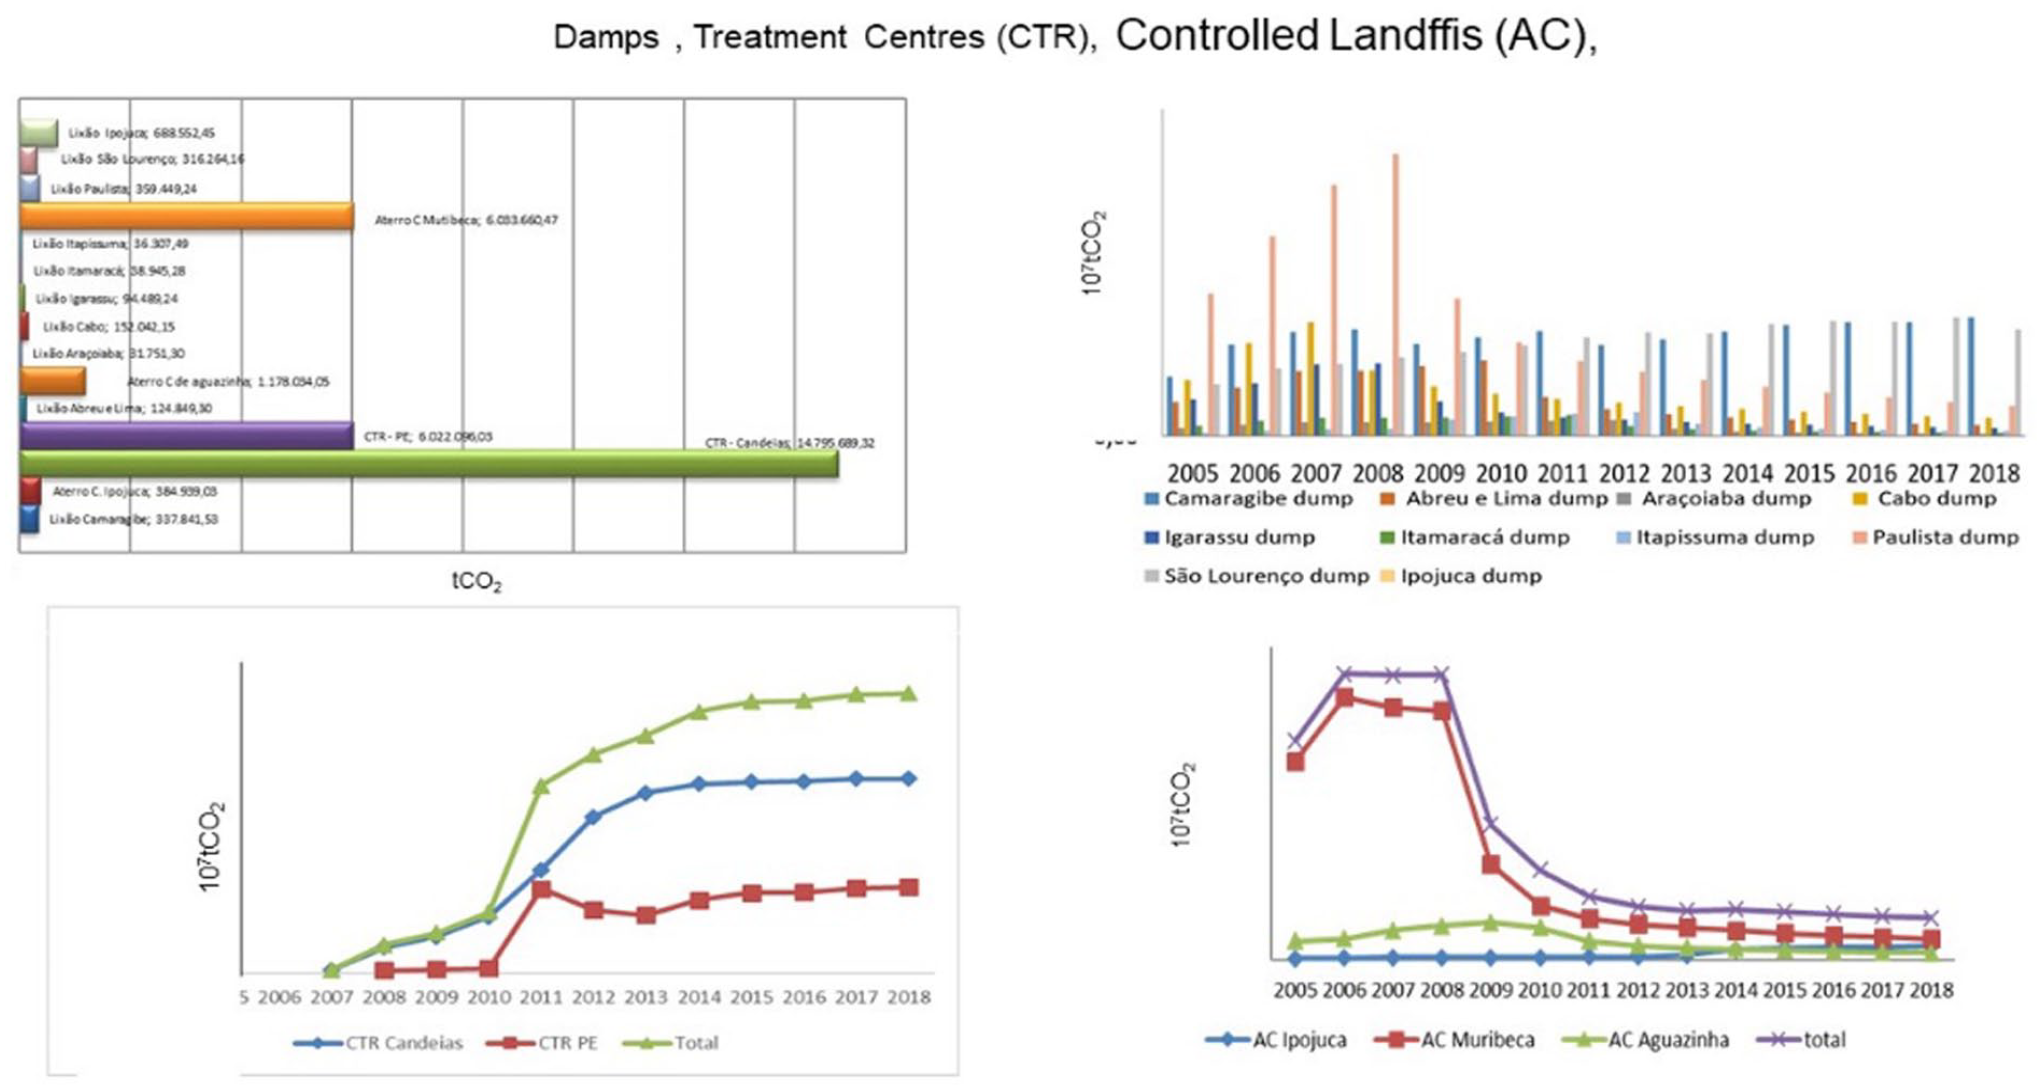
CO2e emitted by disposal sites in the RMR.
The waste treatment centres emitted approximately 2.10 × 10⁷ tCO2e over the period from 2006 to 2018, with CTR Candeias responsible for 1.47 × 10⁷ tCO2e and CTR Pernambuco responsible for 0.60 × 10⁷ tCO2e.
Scenarios
Comparative analysis of emissions scenarios
The behaviour of the projected emissions, according to the scenarios considered, is in Figure 5. The growth trend of emissions in the Base Scenario if the interventions foreseen in the other scenarios do not occur can be observed, as well as the decrease that occurs with the implementation of the scenarios, which shows an already sharp drop in Scenario 1, from 2019 to 2022.
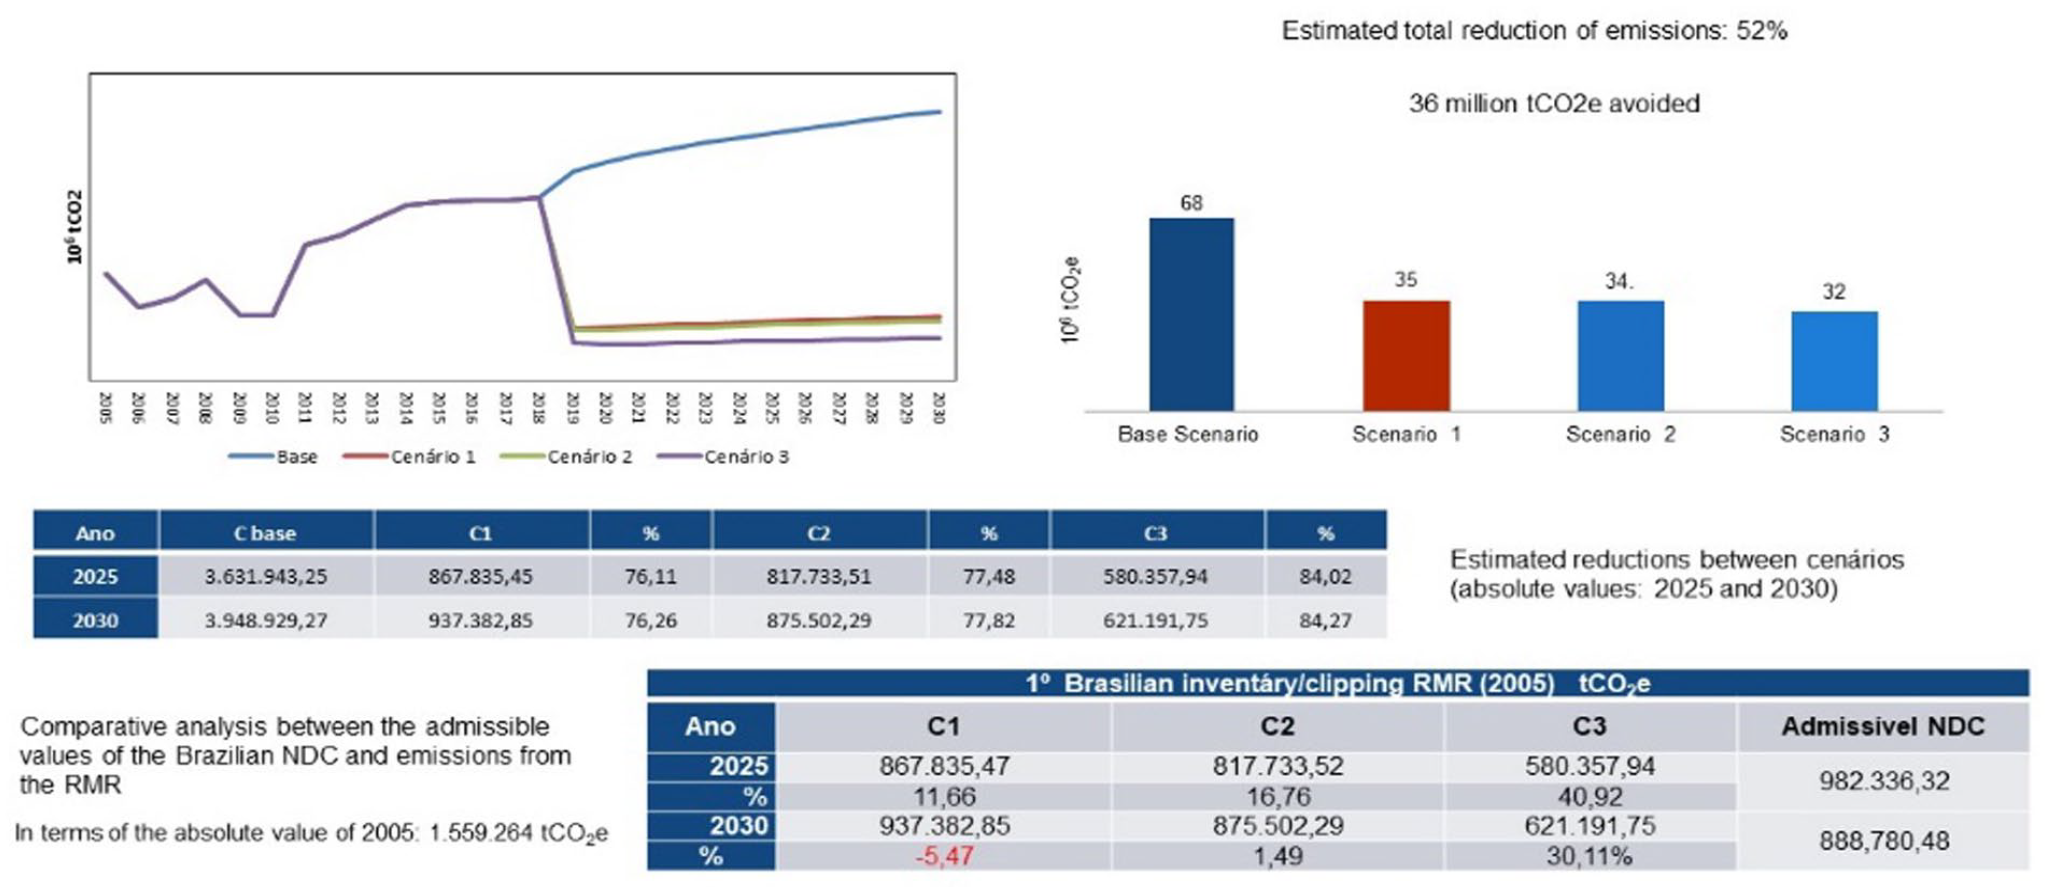
Comparative analysis between scenarios and the NDC values.
As a result of the projections made in the study, it was determined that about 68 million tCO2e would be emitted in the Base Scenario, 35 million tCO2e in Scenarios 1 and 2 and 32 million tCO2e in Scenario 3.
Comparing the Base Scenario and Senario 3, the emissions avoided due to solid waste disposal in the RMR would be approximately 36 million tCO2 in the period from 2006 to 2030 (Figure 5).
Comparative analysis of scenarios with the NDC
The allowable emissions limits, as shown in Figure 5, due to the reductions assumed by the country in 2015, compared to the value from 2005 (1,559,254.00 tCO2e), for the years 2025 (37%) and 2030 (47%), were 982,336.32 tCO2e and 888,780.48 tCO2e, respectively.
The comparative analysis between the permissible limits and the results from the scenarios studied with the Brazilian NDC can be seen in Figure 5.
The values obtained show that the Brazilian NDC requirements would be met in 2025 for all scenarios and in 2030 for all except Scenario 1, where emissions would be 5.47% higher than the value permitted for that year.
Conclusion
The application of the mathematical model of FOD of the IPCC fed with the local data of the RMR allowed calculating the inventories with estimation of municipalities annual and cumulative CO2e emissions in the studied period 2006 to 2030, thus making it possible to know the values to reach the Brazilian NDC.
In order to comply with the Brazilian NDC, it is necessary to implement public policies and investments foreseen in the mitigation scenarios.
The implementation of the scenarios will avoid approximately 36 million tCO2e of emissions from the disposal of MSW in the RMR, equivalent to a reduction of 52% by 2030, higher than the 47% promised by the country in the Paris Agreement in 2015. However, it is necessary for the municipalities to make efforts to implement a selective collection programme in order to achieve the goals of reducing recyclable materials and organic materials.
In addition, the functioning of the processing units must be strictly controlled by the regulatory bodies, in order to maintain the current operational quality standards.
This study contributes to the improvement of the management of solid waste and supports the formulation of public policies in partnership with the municipalities and the private sector.
For continuity of this study, it is recommended:
An additional study carried out to assess the emissions by mechanized treatment, by FDW production and energy use, with an analysis of the life cycle of the MSW production chain in the context of a circular economy and to study the conditions of the areas degraded by the deactivated dumps and ways to remedy them.
Footnotes
Acknowledgements
The authors would like to thank the Federal University of Pernambuco, through the Department of Civil Engineering/Waste Group and the Government of the State of Pernambuco, through the Secretariat for Urban Development and Housing, for supporting the development of this study.
Declaration of conflicting interests
The authors declared no potential conflicts of interest with respect to the research, authorship, and/or publication of this article.
Funding
The authors received no financial support for the research, authorship, and/or publication of this article.