
Abstract
Mergers and acquisitions (M&A) are an internationally adopted expansion strategy, but not every case can be successfully executed nor achieved the intended post-expansion results. Most studies focus on M&A wave or post-M&A integration, yet this article focuses on pre-M&A analysis and planning. An M&A evaluation and prioritization model (MAEPM) is proposed to assist decision makers in a more objective and effective manner so that to implement and execute each M&A deal with the aim of maximizing the success rate rather than any other irrelevant reasons. Risk analysis, fuzzy critical path analysis, cost–benefit evaluation, as well as decision rule and prioritization were developed and integrated, which provide insight into M&A evaluation and serve as indicators. Eleven case studies were conducted to verify the MAEPM and the results generated from the MAEPM were compared with the actual results that confirmed the MAEPM is significant and plausible. The novel MAEPM is confirmed to be reliable that enables firms to select the most winning M&A deal(s) to be made according to the availability of resources and capital and thus enhance the success rate of M&A.
Keywords
Introduction
Mergers and acquisitions (M&A) have been widespread in the global regime and have emerged as crucial corporate strategies and important financial investment decision for rapid business growth and development in the recent decade. 1,2 M&A are the combination of the assets and liabilities of two companies to form a single but larger business entity, which could be similar sized as merging or a larger or more resourceful firm absorbs a smaller or weaker one as acquiring.
Owing to the influence of globalization and economic integration, businesses nowadays are exposed to a great deal of uncertainty and riskiness from both the internal competition and external threats. In order to survive and expand rapidly, they have turned to the value adding corporate M&A to obtain external resources and gain market expansion. There are numerous M&A cases, such as the acquisition of Jaguar Land Rover by the Tata, the Lenovo Group’s acquisition of IBM personal computing division, the M&A of Volvo Car Corporation by Geely Automobile, and the merger between Yahoo! and Microsoft. M&A examples can be found in different industries.
As stated by Carney, the main strategic motivations to M&A are due to the results it brought, such as economies of scale, and synergies effects in the area of administrative, sales, reputation, and market share. 3
Despite the significant achievements and prevalence of M&A, not every M&A case successfully achieves its strategic nor financial objectives. According to Mitchell et al., three of four M&A deals fail and produce disappointing results. 4 To date, most research still pointed out that the overall success rate of M&A deals is about 50%, in other words, half of all M&A deals fail. 5 The failure is mainly caused by the improper attention paid to the integration process and a lack of rational tools for analysis to manage deals. Overestimating the synergy effect and benefits as well as overlooking the risks involved in M&A are other reasons for M&A failure. There are four major challenges faced by many companies while doing M&S businesses, including limited research attention paid to pre-M&A analysis, inadequate emphasis on risk aspect in M&A, 6,7 lack of preparation for M&A critical time, 7 and lack of rational tools for M&S analysis to manage deals. 8 –11
In this article, an M&A evaluation and prioritization model (MAEPM) supporting early stage M&A decision-making is proposed, aiming to improve the success rate of M&A deals. The proposed model is not only to evaluate the worthiness of M&A deals with risk involvement but also to prioritize M&A deals. Fuzzy set theory and Monte Carlo simulation will be incorporated into the development of the proposed model to reduce the noises that arise in the course of pre-M&A analysis, thereby building the model with greater precision. Evaluating the cost and benefit of M&A deal by taking risks into account through Monte Carlo analysis for prioritization. Hence, by managing the foreseeable risks and following the critical path, firms can even increase the efficiency and success rate of M&A.
This article is structured into five sections. The second section provides a literature review on theoretical aspects of M&A and relevant techniques, including fuzzy critical path analysis, cause-and-effect analysis, and Monte Carlo simulation. Research methodology and model development are described in the third section. A detailed discussion of the model and key findings are found in the fourth section. Finally, the fifth section provides a concluding remark and suggests further research directions polish and extend this research.
Literature review
In order to develop an M&A evaluation and prioritization model for better M&A decision-making and enhancing the success rate of M&A, it is important to identify and understand how the key factors influencing the M&A process and decision-making. The relative literature on motivations for M&A, M&A process, factors affecting M&A, and M&A decision-making were thus reviewed and discussed in this section, so as to ensure that those significant elements are incorporated into the proposed model.
Mergers and acquisitions
M&A are regarded as aspects of corporate finance, management, and strategy involved with the purchase and combination of companies. Companies always take advantages of M&A to expand their businesses with the best opportunities and better positioned for growth and profit. The strategic motivations can be divided into two categories: financial and non-financial motives. As for the financial motives to M&A, Eun and Resnick stated that the synergistic gains created are the primary factor for companies to start M&A. 12 Apart from this, Carney further indicated two key financial motives, which are economies of scale and possession of a leading market share. 3 The non-financial motives include CEOs’ power domination, overconfidence, and ego. As CEOs are often rewarded through M&A to increase their power over a larger firm, some CEOs may take over another firm in order to show their ability or eliminate their enemies and hated persons. From another point of view, the needs of M&A are classified into three major drivers, including resource-driven, market-driven, and risk-driven. 13
The process of M&A generally triggers by realizing the needs of M&A or recognizing opportunities for business growth by identifying a target company. 14 Generally, there are eight major steps, namely M&A needs recognition, M&A formation, 15 capital structuring and negotiations, 16 documentation, Due Diligence, 17 ownership rights protection, 18 and dispute resolution. 19
Although M&A is a distinctive mean for accessing external resources, there are people for and against the motions of M&A. 20 For those people who support M&A, as mentioned above, the reasons are due to the benefits brought by M&A, such as economies of scale, synergetic gains, better capacity utilization, better market position, overcoming entry barriers, and wider market reach. 21 –24 However, reasons against M&A could also be found in the literature. In some cases, excess cash flows were used for the transaction costs in the M&A deals, managerial entrenchment (by which managers make deals to increase their value and power to shareholders but not shareholder value itself), and managerial hubris or ego (that managers are overconfidence to make decisions on the deals). 22,25,26
Fuzzy critical path analysis
Project scheduling is growingly important to obtain competitive priorities, but, in many situations, it is challenging and complicated, particularly in this dynamic and cut-throat business environment. To deal with this matter, the concept of fuzzy critical path analysis is often useful and significant.
Fuzzy set theory has been commonly used to deal with vague and subjective human judgments, which influence the outcomes, for better decision-making. 8,27,28 Indeed, there are several studies investigating the extension of critical path analysis using fuzzy logic in the literature. 29 –35 The approach to fuzzy critical path analysis proposed by Chen is adopted in this study to determine the critical path of a project, in this case, projects, represent M&A deals. 34 It integrated the concept of α-cut, Zadeh’s extension principle, 32 Yager’s ranking method, 32 and linear programming. The application of fuzzy logic to determine critical path is widely acknowledged and it is claimed that the fuzzy logic approach is more accurate, compared to the purely probabilistic ones, like PERT. 29,35 –39 In general, fuzzy sets are used to describe activity times of each project task to cope with vague duration estimations based on human judgment and the approach of critical path analysis with fuzzy activity times has been well-established and validated. 9,33,36,39 –42 In this regard, fuzzy set theory is therefore employed in this study to analyze critical path in a more precise manner.
Cause-and-effect analysis
Cause-and-effect analysis, also called fishbone diagram or Ishikawa diagram, is a problem-solving tool for quality management. It can identify the possible causes of a problem in an organized manner. Researchers agreed that cause-and-effect analysis is effective and useful in identifying the causes and ensure comprehensive coverage related to a problem. 42 –46 In the fishbone diagram, the head of the fish is denoted as the summative effect while the fish ribs represent causes contributing to the final effect. 47 The effect is identified, followed by thoroughly recognizing the main causes. Park et al. stated that the fishbone diagram is useful to identify the causes and ensure comprehensive coverage related to a problem. 46 In addition, the fishbone diagram is effective, handy, and easily implemented. 43
The cause-and-effect analysis is useful particularly in studying complex systems. In Karnaukhov’s finding, this approach can provide advisable information at the preliminary stage for subsequent analysis and help integrate knowledge and information from different sources on the phenomenon in a concise cause-and-effect diagram. 42
Monte Carlo simulation
Monte Carlo simulation is handy and useful particularly in decision-making and risk analysis as it suits for all kinds of distribution of activities. 48,49 Carl and James stated that Monte Carlo simulation is “a fast, flexible, easy and accurate method” for estimation. 50 Lutfi et al. further emphasized that Monte Carlo simulation can deal with a combination of all of the special conditions easily without any negative impacts on accuracy. 51 It can also achieve a highly accurate result by performing a large number of simulations.
In general, Monte Carlo simulation is commonly applied to quantify and visualize risk and uncertainty associated with project costs, 10,11 to perform a risk analysis of critical path method scheduling, 52 to simulate project networks, 48,53,54 and to determine the probability of the project completion. 55–56 Other than these, the use of Monte Carlo simulation can also be found for supply chain model, a forecast of hotel arrivals and occupancy, 57 electricity market models, investment, and financial portfolio. 58 –60 In regard to its features and wide applications, Monte Carlo simulation is deemed appropriate and significant to determine the M&A cost with a consideration of risk analysis. 61,62
Methodology
With the support of the discussions in the first and second sections, it is confirmed that pre-M&A analysis, as a vital and primary action in the very early stage of M&A process, could steer M&A deals toward success; failing to assess risk associated with M&A deals could cause M&A failure; doing M&A deals at critical time can reduce uncertainties associated with M&A deals and take full advantage of potential benefits of the M&A opportunities. Nonetheless, a limited study focusing on these aspects was found in the literature beforehand. Besides, it is the fact that M&A is complicated and its decision-making is never easy to senior management in the industry. Firms eager to seek rational tools to effectively lessen the fuzziness of human judgements and manage M&A deals, in particular taking pre-M&A analysis, critical time, and risk associated with M&A deals into account. However, no such practical tools, especially for M&A analysis, exists in the market. To fill the gap and satisfy the need, the proposed model is therefore formulated and used to schedule M&A activities, to identify risks associated with the M&A process, as well as to judge the returns and risks arising from the M&A deals so as to maximize the probability of success in M&A.
Risk analysis, fuzzy critical path analysis, cost–benefit evaluation, as well as decision rule and prioritization were developed and integrated with the support of the MAEPM development. M&A is highly uncertain and for that reason, four risk factors (i.e. schedule, estimation, process, and external risks) were identified and mapped every task in the M&A process for assessment and management. Time is one of the critical success factors in M&A. To enhance the accuracy of the MAEPM and ensure an effective M&A project delivery, fuzzy critical path analysis was employed to deal with subjective and vague human judgment for M&A project scheduling. Risk-bearing budget percentage and adjusted rate of return (ARR) were calculated based on the cost–benefit evaluation of the model particularly with an inclusion of manpower cost, which is regarded as the essential and second largest cost in M&A. All of these forming the MAEPM can provide insight into M&A evaluation and serve as indicators. In order to further facilitate firms to screen and select potential M&A projects in an effective manner, decision rule and prioritization were created in this research as two decision gates to support M&A decision-making. The proposed model development is shown in Figure 1, followed by the construction of all chosen components.
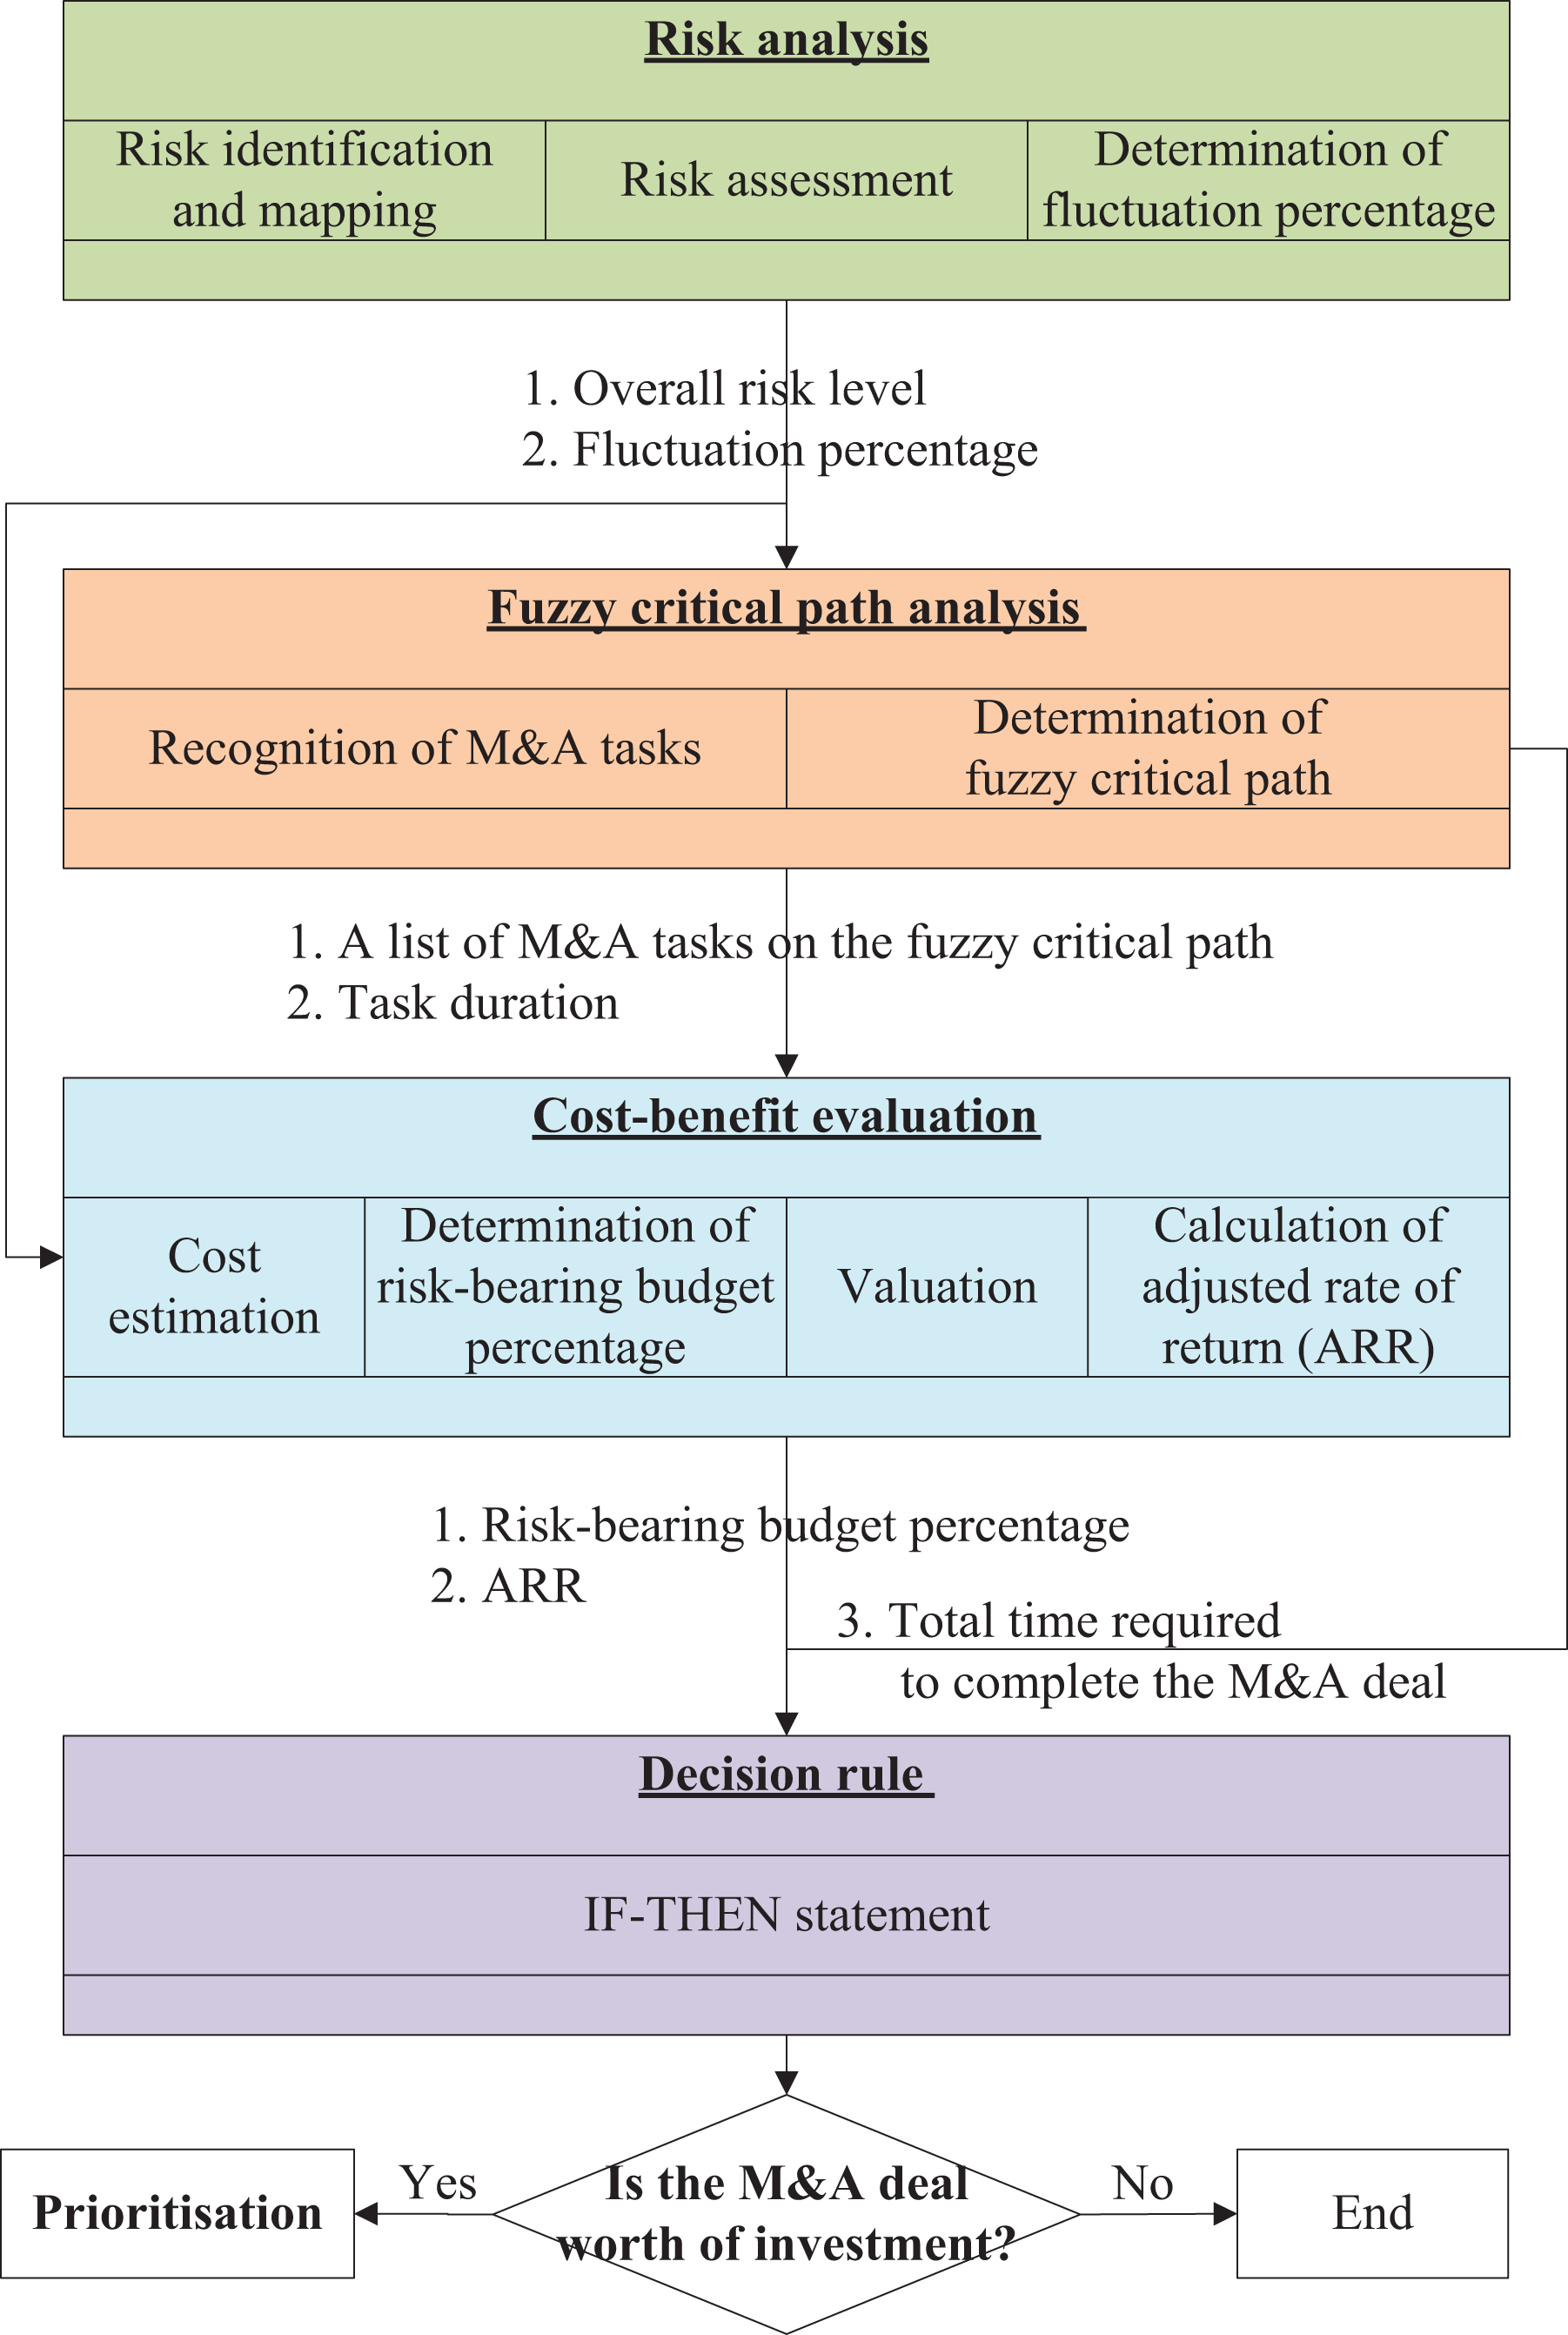
The M&A evaluation and prioritization model. M&A: mergers and acquisitions.
Risk analysis
Risk identification is to identify the risk factors that exist in the M&A activities. 63 In the risk identification of the proposed model, the cause-and-effect analysis, also known as fishbone method, is adopted to identify possible risks. The main goal of the fishbone diagram in this research is not only to link potential risk factors with activities in the M&A process but also to illustrate in a graphical way the relationship between a given effect (i.e. completion of the M&A deal) and all the M&A activities and risk factors that influence this effect. It also provides an overall picture to the effect.
As M&A activities are often risky and costly, it is necessary and critical to take risk factors into account for the sake of M&A. In order to assess and manage potential risks in M&A deals, identifying risk factors and associating them to each M&A activity are required in the development of the fishbone diagram of the proposed model.
Four kinds of risks, including schedule, estimation, process, and external risks, associated with M&A process are identified. Schedule risk refers to any potential delays on each critical task in M&A deals. The delay would mainly inflict unnecessary increment in project cost and uncertainty impacts on other risks as mentioned earlier. Thus, it will lead to improper allocation of resources to specifically planned areas or cause the project team to drift away from the original plan. One possible solution to diminish the risk is to perform a dose–response relationship on each critical task and keep consistent monitoring. Estimation risk would incur at the time of each task completion and refers to the uncertainty of the outcome of each task. This leads to overconfidence in the potential outcome of each task or underestimation of M&A requirements, which eventually cultivates emotional situations and cognitively affects the near future M&A arrangement and planning.
Process risk denotes a series of repercussion effects or butterfly effects on the result of each descendant task in the step-by-step M&A process, for the tasks in M&A process, are closely linked with each other. Any faulty coordination between tasks would threaten the planned M&A duration and resource input. Causing a delay of the subsequent tasks in the M&A process is inevitable in many cases. External influences include third parties, government intervention, legal barriers, and competitors on the M&A deals. Both direct and indirect intervention would influence the amount of input and output of the M&A.
The risk level for each M&A task in quantified value is the ratio of the sum of risk levels for each risk factor to the number of risk factors involved. If the value is less than one-thirds, it is defined as low risk; if higher than two-thirds, it is considered as high risk; otherwise, it should be moderate. The overall risk level is determined accordingly. To estimate resources and costs required for the M&A process, it is assumed that there are three degrees of risk attitudes when making decisions, provided that M&A is a risky business activity. The three degrees of risk attitudes are risk-averse, risk-neutral, and risk-taking. These risk attitudes are taken into consideration in generating the fluctuation level of cost in relation to the M&A process based on the overall risk level to be assessed.
Fuzzy critical path analysis
To determine the fuzzy critical path of M&A activities in the deal, the following steps are required: specify the individual activities in the M&A deal; determine the sequence of those activities; draw an activity-on-arrow network diagram; and determine the fuzzy critical path
Activities involved in the M&A deal and their sequence need to be identified so as to estimate the duration of the M&A deal and arrange resources required for those activities for better planning and scheduling. Afterward, an activity-on-arrow network diagram can be drawn according to the list of activities and sequence. The network diagram visualizes the M&A process for better understanding and is helpful in determining the fuzzy critical path. Activities with the time required for completion are stated on arrows and connected by nodes.
To set up the fuzzy critical path, a set of general equation for critical path method with n nodes is implemented, which based on the approach proposed by Chen in M&A aspect instead. It is considered that an M&A project network Sf = {O, A,

where i and j are elements of the set A, that is, (i, j) ∈ A;


After that, the α-cut level should be identified and each α-cut value is set into a separate scenario for the analytical performance. A table of α-cut set duration is derived using formula (3). With the use of the α-cut method, there would be two values per each α-cut level unless it is at the α-cut level 1

Therefore, formula (4), which provides the lower and upper boundary of the crisp values of those fuzzy sets, is formed:

Assume that the problem of each fuzzy set is a linear function, the angle calculation of tangent is implemented for the α-cut calculation. Equations (5) and (6) are used for the calculation of the lower boundary, while equations (7) and (8) are for that of the upper boundary:


After obtaining the table of fuzzy activity time, dealing with the fuzzy total duration is embarked using Zadeh’s extension principle. It is used to denote the shortest duration of the potential fuzzy critical path, which membership function can be defined (see equation (9)):

Since there are upper and lower boundaries of the crisp sets, two different sets of fuzzy duration at different α-cut values can be obtained.


Through the dual-level mathematical program, equations (12) and (13) are obtained, at which at least one tij, (i, j) ∈ A would touch the boundary of each site of α-cut to satisfy the equation of
Dual-level fuzzy mathematical program:


In order to solve the dual-level mathematical program formulas, we are assuming that the predecessors and its corresponding dual problem have the same objective durations. Thus, yj is denoted as the dual variable that corresponds to the jth general constraint of the second-level problem in equation (12), which would transform the above lower level boundary as the following (see equation (14)), likewise the upper boundary
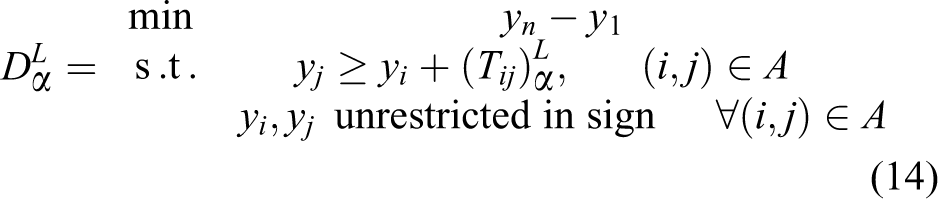
where Yj represents the occurrence time of the node j, and the value of yn − y1 represents the duration of the project. By solving the problem, a set of total fuzzy duration time and their set of a potential fuzzy critical path can be achieved. Some of them might have been duplicated owning to a different level of α-cut values under situation whereby a clear route had been defined. If there is any different route appearing on that table, we move on the defuzzy step whereby those fuzzy set of numbers are defuzzify into crisp time using Yager’s ranking index defined by the following equation

where

Let Pcg be the relative degree of criticality from point c (start of the project) to point g (end of the project), the ratio of the Yager ranking index can be derived by using the following equation

The set of ratio would conclude which most critical path is the final fuzzy critical path that we are looking for. The ratio would be from one to zero, whereby
Cost–benefit evaluation
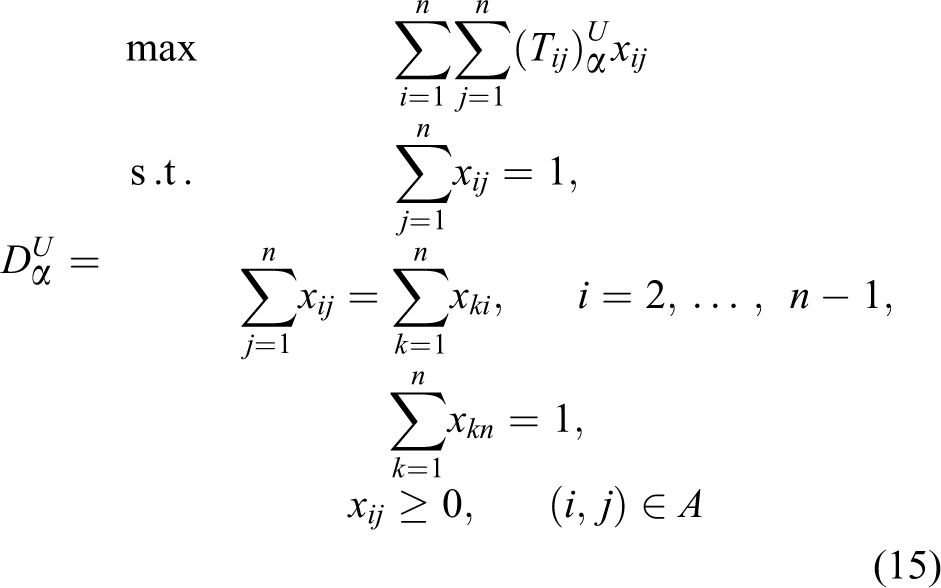
To maximize the probability of M&A success, the prediction of resources to be allocated, costs, and benefits are inevitable before making any decisions on the deals. The component of cost–benefit evaluation is, therefore, essential by providing the evidence in terms of costs of managing the deal and value of the target company to support M&A decision-making. Apart from the fixed amount of acquisition cost, manpower cost is another essential expenditure used in managing M&A deals. Such an expenditure generally is the second largest cost, following the acquisition cost, the company has to bear. In light of this, the manpower cost is influential in determining the final cost of the M&A deal or in making the final M&A decision. In order to evaluate the attractiveness of M&A investments in a more precise manner, the manpower cost is carried out using Monte Carlo simulation when judging the cost of M&A deals.
The cost evaluation element is composed of the input section, simulation section, and the output section which are shown, respectively, in Tables 1, 2, and 3.
Input section of the cost estimation sheet.
M&A: mergers and acquisitions.
Output section of the cost estimation sheet.

Simulation section of the cost estimation sheet.

M&A: mergers and acquisitions.
Discounted cash flow (DCF) analysis, being popular in investment finance and corporate financial management, is used to estimate the value of the target as a whole in this research. 64 It determines the amount of money investor has to pay today in order to receive the anticipated earnings in the future. The use of DCF analysis is encouraged in most capital budgeting situations to account for the time value of money. 65 If the value obtained from the DCF analysis is higher than the estimated investment cost, there is a good opportunity, or in other words, it is acceptable, to make the M&A deal, and vice versa.
DCF analysis is adopted in this research to predict the value of the target in M&A deals by discounting all future cash flows of the target to their present values. DCFs are then added up together to obtain the net present value (NPV) of the target. The equation of NPV is illustrated below:
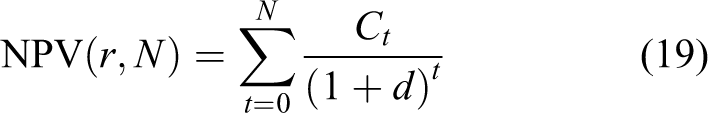
where t is the time of the cash flow, d is the discount rate, and Ct is the net cash flow at time t. In this research, the discount rate used to determine NPV is assumed to be 15%.
The internal rate of return (IRR) is a well-known method used in capital budgeting and is the interest rate that makes the NPV equal to zero. It is used to evaluate the desirability of a project or investment. The higher an IRR of a project, the more desirable it is to undertake the project. The calculation of IRR is as follows:

where t is the time of the cash flow, i is the IRR, and Ct are the net cash flow at time t.
In general, companies only include the acquisition cost in the calculation of IRR but not the manpower cost. In order to calculate the expected returns on M&A investment in a more precise manner, an ARR taken account of both acquisition cost and manpower cost with risk involvement is therefore proposed in this research. 65 ARR is an enhanced method for capital budgeting. It can be used in the comparative assessment of potential M&A investments to evaluate their desirability. The calculation is expressed in the following equation:

where t is the time of the cash flow, R is the ARR, Ct is the net cash flow at time t, AC is the acquisition cost, and MC is the manpower cost that is determined by and derived from the cost estimation element of the proposed model.
Decision rule and prioritization
To support companies in making M&A decision in an effective manner, a decision rule is established on the grounds of the estimated ARR, the time required for the completion of M&A, and risk-bearing budget percentage. A consensus on the decision rule was reached that IF the time required completing an M&A deal is less than 180 days, a risk-bearing budget percentage is smaller than 18%, and ARR is greater than 25%, THEN the M&A deal is worth of investment and thus recommended to be undertaken.
In case, there are more than one M&A deals which are worth of investment but firms have limited resources to process the deals concurrently, prioritization of the deals will be undertaken by calculating a finalized rating of the deals using the following equation:

where f is the result of fuzzy duration, b is the result of risk-bearing budget percentage, and a is the result of ARR of a particular M&A deal. By comparing the ratings, M&A deals can be prioritized. The higher the rating is, the worthier the M&A deal is among those. In this case, firms can evaluate its capacity to decide which deals should be handled and which should be given up for better resources management and strategic planning.
Case study and result
This section describes and illustrates the proposed model using a case study. The case study was a real case of Sage International Group Limited (SAGE)’s previous M&A deal. It was used to demonstrate how the proposed model supports M&A investment decision and was helpful to enhance decision makers’ understanding of the operation of the proposed model and how the model supports them to make M&A decisions in an effective way.
Due to the financial tsunami in 2008, SAGE’s exhibition business faced extreme market pressures and cut-throat competition. In order to broaden SAGE’s income sources and to further improve its financial position, SAGE divested the exhibition business and sought opportunities in death care sector on account of the rapidly aging population in China driving the demand for death care services and products in the foreseeable future. SAGE found that with the existing available land and expected demand increase, burial land capacity in Shanghai would be fully utilized within 10 years. With a favorable supply/demand relationship, rising earnings of residents, aging trends, and robust growth, Shanghai funeral market was expected to thrive in the coming years. Besides, SAGE discovered that the death care industry’s largely recession-proof nature and high-profit margins make it a good business to venture into during the global financial downturn. After all, SAGE decided to develop its death care services business through M&A.
SAGE acquired Suzhou Universal Chinese Memorial in 2010 in view of the landscaping design of the cemetery offering a scenic array of interment options with excellent Fung Shui. The cemetery situates on Xishan Island, the essence of Tai Hu lake scenic areas, in Suzhou, China, and is built alongside hills and girdled by water. The acquisition process took about 3 months to complete and its total consideration is HK$110 million. With this 60,000 m2 cemetery, SAGE can offer 30,000 burial plots and three columbaria.
Risk analysis
Based on the investigation result, a fishbone diagram linking risk factors to respective M&A tasks for the case of Suzhou Universal Chinese Memorial is demonstrated in Figure 2, while a Gantt chart shown in Figure 3 is created to schedule for the M&A of Suzhou Universal Chinese Memorial. It helps visualize the relationship between risk factors and M&S tasks and draw decision makers’ attention to the risks at each step in the M&A process. Risk assessment can then be conducted to evaluate the risk level of this M&A project.

Fishbone diagram.

Activity-on-arrow network diagram for case 1.
The risk level (i.e. low, moderate, or high) of risk factors (including schedule, estimation, process, and external) against the list of tasks (totally 17 tasks) is evaluated one by one. The assessment results generated by the group of experts were presented on the risk assessment sheet illustrated in Table 4. The overall risk level for case 1 is determined as moderate and thus the cost fluctuation percentage is between 90% and 125%. This cost fluctuation percentage will be used for the determination of fuzzy critical path and cost–benefit assessment afterward to take the risk attitude into account.
The risk assessment results for case 1.a

aShadow cell means the risk factor is not applicable to the task.
Fuzzy critical path analysis
The M&A project network of this case study can be defined as S1 = {O, A,
Crispy activity time and fuzzy activity time for case 1.

Given the predetermined α-cut level ranging from one to zero with 0.1 for each interval, the α-cut of Tij (i.e.
The upper and lower values of fuzzy activity time required for each activity at different α-cut levels for case 1.

The α-cut of the total duration time and the fuzzy critical paths at 11 distinct α values for the upper bound (i.e.
The α-cuts of the total duration of corresponding critical paths for case 1.

Cost–benefit evaluation
To estimate the costs of this M&A deal, the manpower required and relevant costs were collected from the company and showed in input section demonstrated in Table 8. To complete the M&A deal, two lawyers, an external consultant, a project director, three accountants, and an investment expert were involved.
Manpower required and relevant costs.

M&A: mergers and acquisitions.
By performing the simulation, the results for this simulation section were obtained and shown in Table 9. From the results, for instance, SAGE normally needed 30 days and HKD$1,188,000 as manpower costs for the completion of the task—legitimacy of assessment. In the optimistic situation, the time required could be reduced to 27 days and the manpower cost was calculated at HKD$1,069,200. On the other hand, in the pessimistic scenario, the time required could be increased to 37.5 days and the manpower cost was HKD$1,485,000. These figures draw the company’s attention to the availability of manpower resources, the length of the time required, and the change in operation costs in optimistic, normal, and pessimistic scenarios. This not only helps the company plan and prepare for different situations comprehensively but also support the company to decide if it will have sufficient resources for the deal if necessary.
Simulation section for the manpower cost analysis.

M&A: mergers and acquisitions.
To further understand the manpower budget required for the deal and the percentage of additional resources which should be standby for emergency purpose or for a higher confidence level, the output section is generated and shown in Table 10 to demonstrate the calculation results. The output section makes use of the data generated from the simulation section to estimate a forecasted budget and contingency budget for the deal with a consideration of the potential risk involved. It is estimated that in normal situation HKD$5,220,400 is required for the deal and the confidence level is 82.8%. There are always obstacles in the process of M&A deal, such as time delay, manpower shortage, time-consuming negotiations, and so on. For the sake of a successful deal with a higher confidence level (i.e. 95% with reference to the simulation result), it is suggested that the company should prepare for a contingency with additional operation costs at HKD$342,957 in a normal situation. In other words, it is predicted that the manpower cost required for the deal at the 95% confidence level is HKD$5,563,357. Such a cost estimation with a consideration of risk analysis would be useful for the company to predict the operation costs in a more precise manner and take the contingency budget into account before starting the deal, for better planning. According to Table 10, the risk-bearing budget percentage is determined as 6.57%. The higher the risk-bearing budget is, the riskier the deal is, and the higher opportunity costs the company has to pay for. This risk-bearing budget percentage would be considered under the decision rule, which will be discussed afterward, to assess the worthiness of the M&A deal.
Output section of the model.

M&A: mergers and acquisitions.
After determining the fuzzy critical path, manpower costs with the consideration of risk and risk-bearing budget percentage, it is necessary to calculate the ARR for capital budgeting before making the final decision on the M&A deal. Due to the data confidentiality, the calculations of the net cash flow over time (Ct ) and acquisition cost (AC) will not be shown in this study, while the discount rate used is 15% for the case of Suzhou Universal Chinese Memorial. The result of ARR is 38.95% will be used to assess the worthiness of the deal under the decision rule to be discussed later.
Decision rule and prioritization
With the results of the fuzzy duration (i.e. 73.66 days), risk-bearing budget percentage (i.e. 6.57%), and ARR (i.e. 38.95%), SAGE can make use of the decision rule to support its decision-making on the M&A deal for the case of Suzhou Universal Chinese Memorial. In this case, the results fit the IF–THEN decision rule, that is the time required to complete an M&A deal is less than 180 days, risk-bearing budget percentage is smaller than 18% and ARR is greater than 25%, it is therefore suggested that such an M&A deal is worth of investment and recommended to be undertaken. Furthermore, when selecting an M&A deal with the highest potential of money return from other ones, decision makers can make use of the equation of priority rating to rank all cases for assessment. Accordingly, the priority rating for the case of Suzhou Universal Chinese Memorial is 0.64.
Overall, for the success of the M&A deal, the model developed in this study can help the company ensure that resources are wisely spent, particularly on those critical tasks. Besides, it could become a key evaluating tool considering risk assessment for cost evaluation and monitoring over the M&A process and support the company to assess the worthiness of the potential M&A deal and its potential risk-bearing level for better decision-making.
Model verification
The previous sections discussed and demonstrated how to apply the proposed model through a case study. In this section, 10 more case studies conducted are described by adopting the same approach, followed by discussing their results. In order to expand its cemetery and funeral service portfolio, which is consistent with its growth strategies, SAGE has explored many M&A opportunities, including the case of Suzhou Universal Chinese Memorial (case 1) discussed in the previous sections, and 10 cases (cases 2–11) studied for model applications:
Case 2: Jiugongshan cemetery is located in greater Beijing economic region. It is the largest cemetery in China occupying 8 million m2 of land and serves the market over 20 million population with annual deaths of 115,000.
Case 3: Bijie cemetery is a newly setup cemetery in Guizhou province of China. It occupies of 133,000 m2 of land and being the only cemetery in Bijie, it serves the market over 500,000 population with annual deaths of 5000.
Case 4: Chongqing cemetery is in Chongqing of China. It occupies of 333,000 m2 of land and it serves the market over 18 million population with annual deaths of 110,000.
Case 5: Fangchenggang cemetery is in Guangxi province of China. It occupies of 185,000 m2 of land and it serves the market over 400,000 population with annual deaths of 2000.
Case 6: Huaiji Luck Mountain Funeral Parlour Limited was established in July 2000 to provide one-stop funeral services for Hauiji, China. Being the only cemetery in Huaiji, this property comprises approximately 133,000 m2 of land and has a monopoly over the 1.1 million population county with annual deaths of 7000–8000.
Case 7: Panzhihua cemetery is in Szechuan province of China. It occupies of 133,000 m2 of land and it serves the market over 1.2 million population with annual deaths of 5500.
Case 8: Qinzhou cemetery is in Guangxi province of China. It occupies of 45,000 m2 of land and it serves the market over 1.4 million population with annual deaths of 8000.
Case 9: Sai Sing Funeral Parlour is one of the seven funeral parlours in Hong Kong, it has 24 rooms, and it serves the 7.2 million population with annual deaths of 40,000.
Case 10: Tungchung is a columbarium in Hong Kong, it offers 10,000 niches and it serves the 7.2 million population with annual deaths of 40,000.
Case 11: Yinchuan cemetery is in Ningxia Hui Autonomous Region of China. It occupies of 400,000 m2 of land and it serves the market over 2 million population with annual deaths of 8500.
According to the model development approach discussed in the third section and model illustration in the fourth section, the additional nine case studies were conducted and their results were explained in the following sections.
Cause-and-effect analysis and risk analysis
As mentioned in the section “Risk analysis,” identifying M&A activities is the first necessary step for cause-and-effect analysis and risk analysis. Similar to the M&A of Suzhou Universal Chinese Memorial (i.e. case 1), cases 2–11 follow the same fishbone diagram but have different risk assessment results. The overall risk assessment results were generated by M&A experts and summarized in Table 11. It is observed that there is usually more than one risk factor involved in every task of the M&A process. This explains the necessity of constructing the fishbone diagram and the importance of the four risk factors identified. Besides, based on the results showing in Table 11, M&A deals seldom involve a low level of risk, resulting in a high possibility of M&A failure. Identifying and assessing the risks arising from the M&A process is, therefore, the primary step when evaluating M&A deals and of paramount importance.
The overall risk assessment results for cases 2–11.

H: high; M: moderate; L: low.
Fuzzy critical path analysis
By adopting the proposed approach and equations (1) to (21) explained in earlier sections, the corresponding fuzzy critical paths and path lengths of completing the M&A cases 2–11 were determined and summarized in Table 12. Their corresponding relative degrees of criticality equivalent to one confirmed that the fuzzy critical paths and path lengths determined are critical and meaningful. From the results revealed in Table 12, it is discovered that the fuzzy critical paths for cases 2–11 are the same even though the time required to complete each task varies from case to case. This is mainly because that M&A often involves complicated and diversified legal and accounting issues which are inevitable and obligatory. Table 12 further depicted that this fuzzy critical path analysis not only indicates the fuzzy critical path and calculates the path length for each case under a normal condition but also generates the path length in both optimistic and pessimistic conditions. For example, the normal path length for case 2 is 151.58 days provided that the resources allocated and time used to complete each M&A task are sufficient as projected. However, unexpected issues, such as due diligence issues, financial accounting issues, legal, and compliance issues, always occur in M&A deals that could probably hinder the entire M&A process. Case 2 was in this pessimistic situation that the tasks of “feasibility assessment,” “negotiation,” “signed sales and purchase agreement,” as well as “legal documentation of M&A” were affected; the projected pessimistic path length is 176.25 days. In fact, these figures can provide concrete evidence to support decision-making in terms of resources allocation and risk management. This makes the fuzzy critical path distinct from the normal critical path analysis.
The results of fuzzy critical path analysis for cases 2–11.

Cost–benefit evaluation
To simulate the input data in terms of time, risk, and resources for cases 2–11 individually, estimated operation cost, contingency cost required at 95% confidence, the total cost required at 95% confidence, and risk-bearing budget percentage for each case can be determined. Case 6 has the highest risk-bearing budget percentage among cases 2–11. This indicates that the company will have to pay higher opportunity cost to complete the M&A process for case 6. The risk-bearing budget percentage can serve as one of the indicators of M&A assessment. Return in monetary term is always the ultimate goal of making M&A deals from the perspective of a company. Calculating ARR of each M&A is, therefore, necessary to assess the worthiness of the deal. The ARR of each case can be calculated and shown in Table 13.
Results of ARR for cases 2–11.

ARR: adjusted rate of return.
Decision rule and prioritization
The results for cases 2–11 obtained from the risk analysis, fuzzy critical path analysis, and cost–benefit analysis are independent indicators to evaluate the particular M&A deals. In this proposed model, there are two gates of M&A decision-making; one is the IF–THEN decision rule and another is the prioritization. Following the IF–THEN decision rule—IF the time required completing a M&A deal is less than 180 days, the risk-bearing budget percentage is smaller than 18% and ARR is greater than 25%, THEN the M&A deal is worth of investment and thus recommended to be undertaken. Those M&A cases worthy of investment will go through gate 1 under decision rule (i.e. pass) to gate 2, that is, cases 1, 2, 4, 6, and 8–11. For those fail to go through gate 1 are considered not worthy of investment and thus will not be taken into account at gate 2, that is, cases 3, 5, and 7. The priority rating can be calculated, followed by the ranking of each case, and the results are illustrated in Table 14.
Results of decision rule and prioritization for cases 1–11.

NA: Not acceptable.
The proposed model suggested that case 6 is the most profitable M&A deal, while case 2 is the least. This model supports the company to select the most winning M&A deals for investment among all potential deals, thereby facilitating the decision-making process and maximizing the success rate of M&A.
Verification of the proposed model
To validate if the proposed model’s results are meaningful and significant, a comparison of it with the actual M&A results was conducted, which is shown in Table 15. The proposed model’s results match with the actual results and facts. SAGE made two profitable M&A deals (i.e. cases 1 and 6) which were ranked 1 and 2 in the proposal model. Suggested by the proposed model, SAGE should not engage with the M&A deals of cases 2 and 3 due to lower ranking and failure to pass gate 1, respectively. This indicates that the decisions suggested by the proposed model were convincing. Overall, it is evident that the proposed model is feasible and valuable.
Comparison of the model’s results with actual results for cases 1–11.

Model limitation
Firms usually keep M&A data and results, especially those of unfinished deals and failed deals, highly confidential and are reluctant to disclose any sensitive information to outsiders to carry out research. This limits the number of case studies conducted in the research. Furthermore, due to the difficulty in data collection, the case studies conducted in this research are all pertaining to land acquisitions. To improve and extend this research, data of M&A deals excluding land acquisitions from other industries and/or countries could be used to test the applicability and capability of the M&A evaluation and prioritization model. A comparative study could be further undertaken to investigate the differences in the pre-M&A analysis so as to extend the applicability of this model to a wider range.
Conclusion
MAEPM is confirmed to be reliable for supporting M&A decision-making as its results are obviously consistent with the actual ones. The case company SAGE used this tool to re-evaluate some of its past M&A cases to better understand their post-M&A issues and to also evaluate all its future possible M&As to be more effective and objective. Making use of the MAEPM, SAGE not only reduced the turnaround time for each M&A deal screening by around 33% to wisely compete for more favorable M&A deals, which were less uncertain and had a higher value in return but also reduced pre- and post-M&A costs significantly, that is, around HK$5M–10M yearly. Another profound impact on the case company should be the improved success chances of completing M&A deals by generated their expected value. The novel MAEPM is confirmed to be reliable and add a significant contribution to the field of M&A. The extension of its applicability to a much wider spectrum should be built to recognize a better understanding of such holistic methodology and its contributions in diverse M&A deals of other sectors.
Footnotes
Declaration of Conflicting Interests
The author(s) declared no potential conflicts of interest with respect to the research, authorship, and/or publication of this article.
Funding
The author(s) received no financial support for the research, authorship, and/or publication of this article.