
Abstract
This article proposes a bees algorithm for solving a mathematical model of strategic supply chains planning and design in the globalization context. The model, taken from the literature, involves a multi-echelon, multi-facility and multi-product supply chain in a dynamic environment. Our bees algorithm, the first to be applied to this kind of problem, was adapted specifically to the optimization problem, and its performance was benchmarked against the genetic algorithm (GA) provided by commercial optimization software MATLAB R2011b. This is in order to test its effectiveness in an already known supply chain design problem, which has not been solved yet in optimized way. Several configurations of the algorithm were tested and analysed; the bees algorithm performs better of 10% in quality of solution respect to the GA with equivalent calculation time. The better quality of their solutions and the good calculation time performances have encouraged towards more accurate studies on tuning parameters and an extended utilization of the methodology on problems of logistic systems configuration and supply chain design.
Introduction
A supply chain is a complex network from suppliers to customers involving people, technologies, activities, information and resources whose purpose is to acquire raw materials and convert them into finished products to distribute to the market. Its design and management are aimed at obtaining the best global performance in order to achieve the best for each element of the chain. 1 Given operations globalization, new models and tools for improving forecasting, replenishment and production plans along supply chains are required. 2 In this context, system modelling is used to forecast supply chain behaviours as functions of network configurations. Owing to their features, supply chain models can be investigated through mathematics or simulation. 3 The aim of this work is to propose a nature-inspired bees algorithm to solve a mathematical model for strategic planning and design of supply chains developed by the authors in previous work. 4 The bees algorithm, introduced by Pham et al., 5 has proved to be suitable in various optimization problems. Pham et al. 6 applied the bees algorithm to manufacturing cell formation, obtaining very good results for a set of problems already studied in the literature. In the study by Pham and Castellani, 7 the authors tested it on 12 continuous functions, obtaining good results in term of accuracy, learning speed and robustness. The application of a bees algorithm to a complex supply chain model is based on two primary considerations. First, this algorithm has proved to be more effective than existing techniques in job shop scheduling problems. 8 Therefore, the fact that job shop scheduling and supply chain planning and design problems are highly analogous suggests that bees algorithm could yield good results for this work. Second, to our knowledge, no one has yet developed a bees algorithm for strategic planning and design of supply chains.
The remainder of the article is organized as follows. Section ‘Literature review’ describes techniques used for planning models of supply chains. Section ‘The bees algorithm’ describes our algorithm’s operation in its conceptual formulation. In section ‘Problem statement’, the model for supply chain planning, presented in previous work, 4 is described. Section ‘Methodology and results’ defines the methodological approach and the results of an experimental investigation aimed at benchmarking the bees algorithm’s applicability and performance. The final section draws conclusions and suggests future directions.
Literature review
Problems of supply chain planning can be grouped into three principal categories, strategic planning, in which long-term decisions (3–10 years) are considered; tactical planning that concerns midterm decisions (1–2 years); and operational planning, 9 in which short-term programming problems are evaluated. Moreover, according to the studies by Lambiase et al., 4,10 supply chain models can be clustered by the function of model objectives, such as capacity sizing, technology selection, sourcing, facility location, cost savings, revenue and profit growth. Most of these models are based on objective functions involving cost minimization or profit maximization and usually take into account economic parameters tailored to the purpose of the models themselves.
Mula et al. 2 clustered the principal approaches for solving mathematical models for supply chain planning and design. These methods can be categorized as linear programming, non-linear programming, fuzzy programming, heuristic algorithms, hybrid methods and others. Jayaraman and Pirkul 11 proposed a production–distribution model for coordination of supply chains. The objective function is a cost minimization in which sourcing and facility location decisions are accounted for. The model was solved using a mixed integer linear programming (MILP) method. Another case of MILP applied to a supply chain production–distribution problem was developed by Yang et al., 12 addressing facility location issues using a cost minimization function. Meijboom and Obel 13 presented a supply chain coordination model integrating capacity sizing, sourcing and facility location decisions for a real case in the pharmaceutical industry. The objective function, based on profit maximization, was optimized using linear programming. Chen and Lee 14 addressed tactical planning for multi-echelon, multi-product, multi-period supply chains under demand and price uncertainty. A multi-objective non-linear integer programming method used by the authors permitted them to create a model whose outputs are the production and distribution plans, inventories and service level in each period. Chen et al. 15 presented work on the design of distribution networks involving capacity sizing and facility location problems. A relative cost minimization function was handled using both a MILP methodology and a two-phase fuzzy decision-making method. Another fuzzy approach was discussed by Mitra et al. 16 involving technology selection and location/allocation problems. Their objective function was a cost minimization that takes into account fixed and variable costs in a dynamic environment.
Pishvaee and Razmi 17 proposed a multi-objective fuzzy programming method for minimizing the cost of forward and reverse supply chains. Their model optimizes facility location, transportation policies and environmental impacts. Mahnam et al. 18 designed a supply chain model for operational planning involving inventory policy issues. Their bi-objective function was aimed at minimizing inventory costs while fulfilling customer demand. To solve this model, the authors implemented a particle swarm algorithm. Altiparmak et al. 19 studied strategic planning of supply chains using a model that integrates capacity sizing, sourcing and facility location decisions. Their cost minimization function was optimized using a steady-state genetic algorithm (GA). Another example of a nature-inspired algorithm applied in this field was presented by Moncayo-Martinez and Zhang. 20 In particular, they used an ant colony method to solve a cost minimization function for strategic planning of multi-echelon, multi-product and multi-period supply chains. Georgiadis et al. 21 proposed a model for strategic design of global supply chains in a dynamic environment under uncertainty. Its mathematical formulation includes capacity sizing, facility location and transfer pricing decisions. A branch and bound method was used to minimize the objective function. Lau et al. 22 addressed transportation problems integrating vehicle routing and facility location decisions. They developed a hybrid solution method ‘fuzzy logic non-dominated sorting genetic algorithm II’. This multi-objective evolutionary algorithm was used to minimize total distance travelled by transports. Vahdani et al. 23 developed a model for forward–reverse logistics networks under uncertainty. Decisions about sourcing and facility location are taken using a cost minimization function. A hybrid solution methodology is presented to solve the model by combining robust optimization, queuing theory and fuzzy multi-objective programming.
The bees algorithm
Bees foraging in nature
The bees algorithm was inspired by the foraging behaviour of honeybees in nature. Indeed, this animal species has a highly efficient method for searching for high-quality food sources in terms of abundance, easiness of extractability and sugar content. 24 The foraging process begins with a relatively small number of bees, called scouts, which move randomly around the hive looking for high-quality food sites. Once a site has been found, the scouts return to the hive with collected pollen or nectar. Then, they point out the site position through a dance, ‘waggle dance’. 25 This dance is performed in a particular area of the hive, the ‘dance floor’, and provides information regarding the direction, distance and quality of the site identified during the searching phase. 26 In particular, it is a figure eight in which the centerline represents site direction, the number of circles represents site distance and the speed represents site quality (Figure 1).

Representation of the ‘waggle dance’.
After the waggle dance, the scouts recruit other bees and return to the pre-identified site to look for better food sources in its proximity. The neighbourhood of a site is called a ‘flower patch’. A higher quality flower patch attracts a greater number of recruited bees. Consequently, the largest number of foragers is allocated to patches in which nectar is rich and easily available. 27 Then, all foragers involved in food search return to the hive with collected pollen and perform the waggle dance. Iterating this process several times optimizes the food collection process because the highest quality sites attract the largest number of bees. 28
The bees algorithm
As mentioned earlier, the bees algorithm takes inspiration from the food foraging strategy of bees. Given an optimization problem, a parallel between nature and mathematics can be drawn. In particular, each food site corresponds to a point in the solution domain of a function. Bees in charge of site search correspond to function evaluation at the respective points of the function domain. Food quality corresponds to function fitness, and the waggle dance can be thought as a ranking of evaluated solutions. In this manner, a predefined number of points can be deeply investigated with a neighbourhood search by recruited bees. The number of recruited bees depends on the quality of the flower patch. 7 Figure 2 shows the flow chart of the bees algorithm, and Table 1 lists the parameters that drive algorithm convergence.

Flow chart of the bees algorithm.
Driving parameters of the bees algorithm.

Initialization
The first step of the bees algorithm is a population initialization, where ns scout bees are randomly spread on the solution domain using extraction from a uniform distribution. Each bee evaluates its pertinent site, calculating its objective function value at related points. Then, the algorithm enters its main loop and continues until its stopping criterion is satisfied.
Waggle dance
The ns evaluated points are ranked to identify the ‘best sites’ (i.e. ascending solutions for minimization problems). The first nb sites of the ranking are selected for a local search. The number of foragers is deterministically assigned for each of the best sites as follows. Scout bees that visited ‘elite sites’ (the first ne sites of the ranking) recruit nre nestmates for local exploration, while the remaining nb − ne sites are evaluated by nrb ≤ nre bees. In this manner, more bees are recruited for the flower patches with the highest quality, in accordance with the natural process.
Local search
Points of the solution domain that are to be further evaluated by the recruited bees are selected randomly from a uniform distribution whose value range is contained in a neighbourhood of the site pre-identified by the scouts. If one of the recruited bees lands at a higher quality point, it is selected to be a new scout. This bee is the only one selected as a dancer once it returns to the hive. In nature, all bees involved in exploring flower patches perform the waggle dance, but this restriction is introduced in our algorithm to reduce the number of evaluations points and the consequent calculation time.
Global search
For global search, ns − nb scout bees are distributed randomly over the solution domain to evaluate new points that could be eligible as best sites.
Population update
At the end of each iteration, new populations are formed by the nb scout bees selected during the local search phase, along with their relative function value and flower patch, and by the ns − nb bees extracted during global search along with their relative function value and flower patch.
Stopping criterion
The stopping criterion depends on the nature of the problem. It can be either the reaching of a predefined solution quality or the conclusion of a predefined number of iterations.
Problem statement
The bees algorithm was tested on a model presented by the authors in previous work.
29
–32
This model addresses strategic planning and design of supply chains in hypotheses of delocalization. Using an activity-based approach,
33
it identifies best strategies for facility location, market fulfilment and sourcing problems. The model is based on an objective function that maximizes total supply chain profits at the end of planning horizon. The principal aspects taken into account in the model are as follows: Hypotheses: the model was developed for decentralized purchasing delocalization in which low labour and low material costs can be achieved through a transfer of production/logistics activities from developed to developing countries. Further hypotheses include dynamicity of demand and cost over a planning period; use of multi-echelon, multi-country, multi-facility and multi-product supply chains and the possibility of allocating an activity in a single facility. Decisions: model decisions concern opening and closing of supply chain facilities; allocation of each production/logistic activity in a set of existent or potential facilities of the supply chain; sizing of the output capacity of each activity; quantification of goods to produce in each period; quantification of raw materials to acquire in each period and supplier selection and number of items purchased by each supplier in each period. Economic parameters: the objective function is based on six categories of economic parameters. Investments are aimed at evaluating amortization impacts for activity relocation, facility opening and facility closing. Labour and energy are targeted to identify which cost drivers are more effective at accessing low costs provided by developing countries. Sourcing concerns costs for raw material and supplier integration. Logistics accounts for transportation costs for raw materials, semi-finished products and finished goods. Revenues estimate firms’ incomes as a function of production quantities and prices of goods over the planning horizon. The exchange rate imposes a geographical variability of costs and prices that nowadays represents an important leverage factor for global firm profits. Constraints: in addition to typical flow conservation constraints in supply chain modelling, the authors also considered constraints on suppliers, activities and market capacity and on maximum admitted expansion for activity capacities.
The complete model has been described in a previous work and mathematical formalization is available in the study by Lambiase et al. 4
Methodology and results
Bees algorithm customization
Owing to the problem’s complexity, the bees algorithm described in section ‘The bees algorithm’ has been tailored to the proposed model. In particular, a substantial emphasis has been placed on local search. Indeed, while global search is simply the evaluation of the objective function at random points of the solution domain, local search must be driven by several methodologies to obtain algorithm convergence. Addressing demand fulfilment issues during the local search phase required relatively little effort. In fact, as this variable is continuous, we considered a range of ± 10% as the solution neighbourhood. This value has been chosen considering a trade-off between the solution’s accuracy for this kind of problems and the computation time.
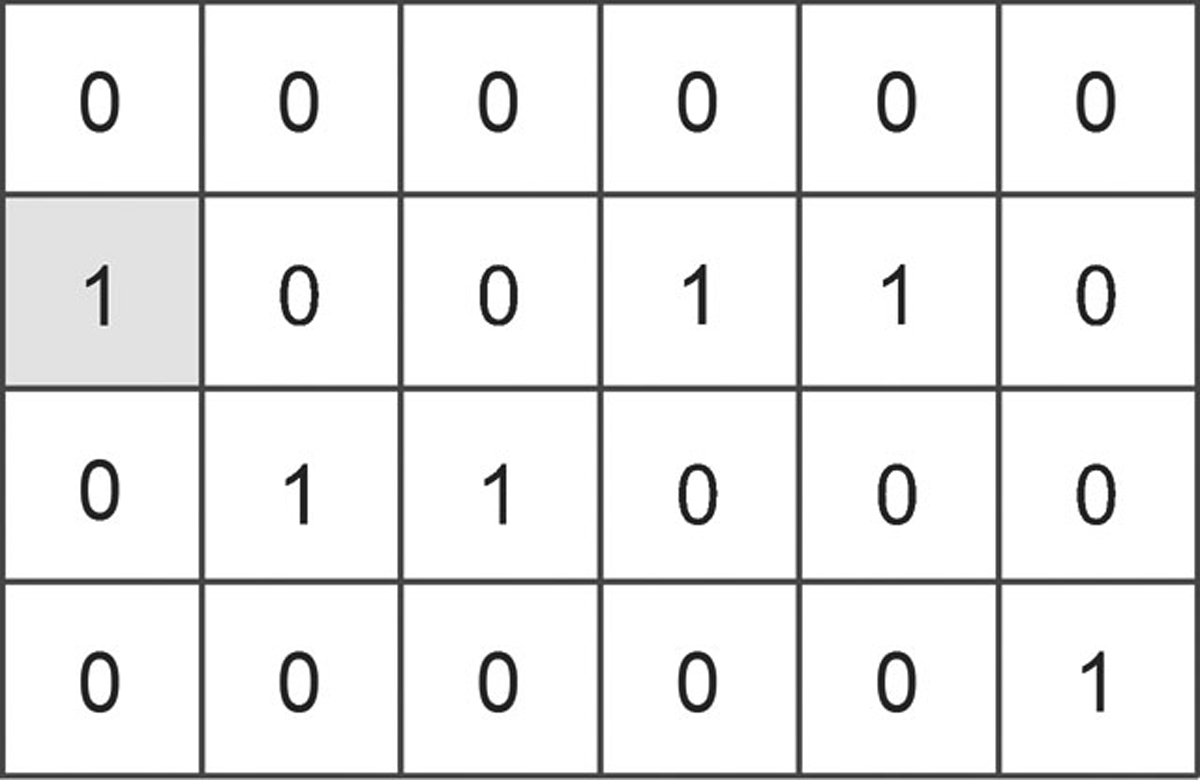
On the other hand, since variables connected with supply chain configuration are discrete, a more complex methodology has been necessary for local searching. For instance, considering the binary variable xia described earlier, each column vector can contain nothing other than a one. Therefore, a neighbourhood solution cannot be defined only as a variation of the solution value in a particular range but must be addressed considering variable characteristics. Three approaches have been implemented to address this problem.
First, a neighbourhood solution can be seen as a swap of all activity from one facility to another. In particular, this method allows activities to be moved to a higher or lower row, but it requires that all activities must switch in the same direction (Figures 3 and 4).

Example of initial configuration.

Example of activities swap to higher row.
Second, a swap of only a particular percentage of activities could represent a neighbourhood solution. In particular, this method requires that 10% of activities be moved to either a higher or lower row (Figure 5). Finally, a neighbourhood solution can be represented by a switch of two activity locations with each other. In particular, this method requires that only two activities can swap their positions (Figure 6).
Example of partial activities swap to higher row.

Example of activities switch.
During local search phase, the algorithm uses one of these approaches randomly for each flower patch evaluation. Therefore, algorithm evolution is led not only in a particular direction but also with particular degree of freedom.
Bees algorithm benchmark
The quality of our bees algorithm has been verified through a benchmark versus results evaluation provided by GA toolbox of the commercial software MATLAB R2011b. Comparison between these two methods was based on the same scenarios used in the authors’ previous work 4 to test model applicability and flexibility. In particular, the 12 scenarios, representing most diffused industries, were created by crossing four kinds of product bill of materials shapes (cylindrical, convergent, divergent and convergent–divergent) with three kinds of product cost structures (capital intensive, labour intensive and balanced).
To analyse algorithm features in terms of solution quality and calculation time, we set the stopping criterion at 100 cycles, corresponding to that used for solving the model with GA. Moreover, three combinations of bees algorithm parameters were considered (Table 2).
Parameters combinations used for algorithm benchmark.
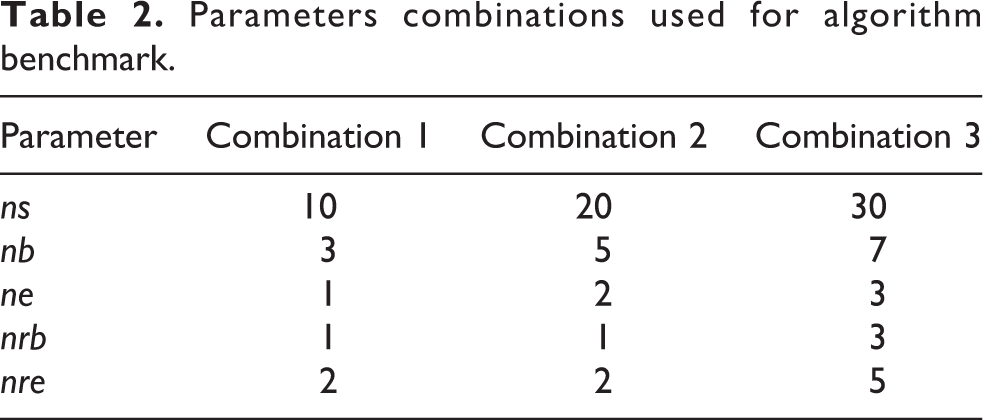
Each combination was tested on each scenario 10 times to have a data set with a statistical significance. Consequently, a total of 360 experimental instances were obtained.
The benchmark comparison between the bees algorithm and GA solutions was implemented on the basis of two indices, as follows:
Percentage difference between bees algorithm and GA function values, defined as

where V(bees) and V(GA) are the respective final values of the objective function for the bees algorithm and GA.
Percentage difference between the bees algorithm and GA calculation times, defined as

where T(bees) and T(GA) are the respective times required to solve the model for the bees algorithm and GA.
Table 3 shows the results of the experiment. Value f(x) is the output value of the objective function and time (s) is the calculation time required to reach the stopping criterion.
Absolute results of experiment campaign for the bees and GA.

GA: genetic algorithm.
The same results are plotted in Figure 7 to provide a more immediate comprehension of bees algorithm behaviour.

Absolute results of experiment for the bees and GA. GA: genetic algorithm.
Analysing the results of the experiment, it is easy to see that the bees algorithm combinations differ greatly in behaviour in terms of solution quality and calculation time. However, the results suggest also that the bees algorithm is more efficacious in terms of solution quality in all of its configurations.
Combination 1 provided better results globally compared to GA. Indeed, it shows an average increase in solution quality of 6% with a minimum value of about 3% and a maximum value of about 10%. In terms of calculation time, it exhibits an average decrease of 1% with a variable range between −6% and 6%.
Combination 2 provided better results only in terms of solution quality, with an average increase of 8%, a minimum value of 1% and a maximum of 12%. On the other hand, the required time for solving the model increases up to an average of 65%, with a minimum value of 56% and a maximum of 77%. However, the point cloud is more concentrated towards better solutions.
Combination 3 produced a further increase in solution quality, but with a dramatic increase in calculation time. In fact, the former index has an average increase of 11% in a range between 4% and 15%, whereas the latter has an average increase of 444%, with a minimum value of 408% and a maximum of 478%.
To discuss the global performance of the bees algorithm, we aggregated data results of the various scenarios, obtaining a comparison between the three combinations of the bees algorithm and the GA as function of solution quality and calculation time (Figure 8). In addition, the GA results were used as reference, in this case, with all of the values normalized on them.

Global benchmark of the bees algorithm.
As shown, combination 1 of the bees algorithm represents the best trade-off between solution quality and calculation time. In other words, it provides more efficiency compared to the GA. In fact, the ratio between ΔV and ΔT is 1.08, which means that in equal time this combination shows an increase in solution quality of 8% as compared to the GA results.
Although combinations 2 and 3 exhibit more efficacious performance, they prove to be less efficient as compared to the GA results. Indeed, they have respective ratios of ΔV to ΔT of 0.65 and 0.20.
Plotting increasing solution quality and calculation time versus the number of points explored by the bees algorithm, we can see that these two indices behave very different (Figure 9). In fact, the former has a linear trend with a low slope, while the trend of the latter is exponential.

ΔV% and ΔT% versus number of points explored using the bees algorithm.
Since strategic design of supply chains has a planning horizon of 5 or more years, whereas the bees algorithm takes only minutes to solve the model, we retain combinations that favour efficacy as preferable to those that favour efficiency.
However, the driving parameter dimensions of the bees algorithm cannot be increased excessively because of the exponential trend of calculation time versus the number of explored points. To conclude, the bees algorithm has been shown to fit better than the GA in addressing the analysed problem. In fact, firm profit growth derived using this methodology always overcomes the increase of calculation time in the context of supply chain strategy.
Conclusions
In this article, the bees algorithm was applied for the first time to a strategic planning and design model for global supply chains. The algorithm was adapted for an existing model that involves facility location, market fulfilment and supplier selection decisions for multi-echelon and multi-product supply chains in dynamic environments. The results of the bees algorithm were compared to results obtained through the GA. A group of 12 scenarios, representative of most diffused industries, were tested and benchmarked versus GA solutions. For all scenarios, the bees algorithm produced better solutions in terms of quality and efficacy (up to 10% with equivalent calculation time). However, in terms of solving time and efficiency, the bees algorithm showed some limitations that do not affect the problem under analysis. The tests conducted on the three sets of parameters have evidenced that a greater number of ‘bees’ leads to a better function solution, while a smaller number of bees takes less time to solve. The relationship between solution quality and solving time is not proportional. In particular, a greater effort in terms of time is required to improve the quality of solutions. Such outcomes suggest to set the bees algorithm with a larger number of bees in logistic problems in which a quick answer is not required while also little improvements of the solution can lead to significant advantages. This is the case of our problem and of all the design problems, in which generally computational time has not a crucial role as the quality of the solution. On the contrary, real-time optimization problems need more agile configurations of the algorithm. To this optics, future researches are targeted to further compare the bees algorithm with other solving methods in order to verify its general performance and to improve local search methodologies in order to reduce solving time, when necessary.
Footnotes
Declaration of conflicting interests
The author(s) declared no potential conflicts of interest with respect to the research, authorship, and/or publication of this article.
Funding
The author(s) received no financial support for the research, authorship, and/or publication of this article.