
Abstract
The purpose of this study is to discover which noncognitive variables provide more information about reading performance. To answer this question, data mining based on information gain, decision tree and random forest methods were utilized in the study. The participants of the study consisted of 606,627 15-year-old students (49.8% female) in a total of 78 countries or economies, 37 of which are OECD members. Reading performance and plausible values of reading, the Student, ICT Familiarity, Financial Literacy, Educational Career, Well-Being and Parent Questionnaire data in PISA 2018 were analyzed to answer the research questions. When 108 features were analyzed as independent variables, it was found that SES (home possessions, cultural possessions, and ICT resources at home), metacognitive skills (assessing credibility and summarizing), and liking/enjoying reading were major variables predicting reading performance. The path analysis revealed that these variables explain 53.3% of the variability in reading performance. It is also remarkable that the decision tree model has a 74.61% accuracy value in estimating the reading performance.
Introduction
Education is one of the most important factors in the scientific, technological, economic, and social development of a country (Hanushek & Wößmann, 2010; Kirikkaleli et al., 2021; McClelland, 1966; Uljens, 2007). Education has always been seen as the main source of power in winning political wars, and continuing revolutions and reforms in history. For example, in the restoration movement the Japanese Emperor Meiji started in 1868, education reform was one of the main sources of motivation for the development of the country (Morito, 1955). Defeated in World War II, Germany invested in education as the most important driver of postwar development (Füssl & Kubina, 1985). During the Cold War era, the Soviet Union sent the first satellite into orbit around the Earth in 1957, which led to comprehensive educational reform in the USA (Powell, 2007). Consequently, developed countries have realized that the real capital of a country is well-trained human resources rather than underground and surface resources (Hanushek & Wößmann, 2010; Sanders & Barth, 1968; Sauer & Zagler, 2014). Indeed, many countries rich in natural resources from South America, the Middle East, and North Africa (MENA) countries have still not reached the desired level of development today (Davoodi & Abed, 2003; Gylfason, 2001; Ozkaya et al., 2021).
Understanding that education has a key role in development has pushed countries into a race in this field. A competition based on comparisons in K-12 as well as higher education draws attention. For example, “Trends in International Mathematics and Science Study” (TIMSS), which tests the science and mathematics achievements of fourth- and eighth-grade students, “Progress in International Reading Literacy Study” (PIRLS), which tests the reading success of fourth-grade students (IEA, n.d.), and “Programme for International Student Assessment” (PISA), which tests the reading, mathematics, and science achievements of 15-year-old high school students (OECD, n.d.), are the most obvious indicators of this competition. The ranking of universities in higher education according to different criteria is also one of the indicators of this race (QS, n.d.; The World University Rankings, n.d.).
These examinations, which have been going on for several decades, have become the focus of the attention of researchers. Economists, statisticians, and engineers, as well as educators, are trying to discover the main factors that affect educational achievement. In particular, assessments such as TIMSS and PISA have special importance as they collect data on students’ noncognitive socioeconomic and psychosocial characteristics as well as academic skills. Hundreds of thousands of data collected from many different countries, in fact, have special importance because they help us see the big picture regarding education and the factors affecting it.
Considering the publications on factors affecting educational achievement, it is clear that the vast majority of researchers conduct studies in which certain countries are evaluated within themselves (Berger et al., 2020; Rolfe, 2021) or more than one country is compared in terms of performance (Kılıç-Depren & Depren, 2021; Wu et al., 2021). In addition, it is noteworthy that most researchers analyze a few theoretically selected variables (Wang & Liou, 2018; Wu et al., 2020). The main reason we focused on data from all countries was to see the big picture and explore the noncognitive variables affecting reading performance in the same context. When the Web of Science, Scopus and ERIC databases were searched, few studies were found in which PISA data obtained from all countries based on student perception was analyzed (e. g. Gamazo & Martínez-Abad, 2020; Lee & Stankov, 2018).
Background of the study
This study focused on noncognitive features defined by Duckworth and Yeager (2015), and Stankov and Lee (2014). Noncognitive features were defined as “a wide variety of individual attributes, skills, and characteristics representing one's attitudinal, behavioral, emotional, motivational, and other psychosocial dispositions” by Lee and Stankov (2018, p. 50). Noncognitive structures (a) are conceptually independent of cognitive abilities; (b) benefit the individual and others; (c) remain constant when external factors remain constant; (d) can be changed by training; and (e) depend on other situation-specific factors (Duckworth & Yeager, 2015). According to Lee and Stankov (2018), the underlying assumption of this concept is that the most important factor determining the academic achievement of students is the students themselves. Despite such importance being attributed, there is no definite opinion as to which of the noncognitive features are directly or indirectly related to student achievement.
To answer this question, Lee and Stankov (2018) examined the relationship of noncognitive variables in TIMSS (2003, 2007, 2011) and PISA (2003, 2012) with mathematics achievement. According to the results of this study, “self-efficacy” in PISA, “confidence” in TIMSS and “educational aspiration” in both assessments were the best predictors of mathematics achievement. Likewise, examining the results of five different previous studies, Stankov and Lee (2014) stated that “confidence” is the best noncognitive predictor of academic achievement. In addition, they stated that the predictive power of self-belief variables varies: for self-concept they are low, for academic anxiety medium, and for self-efficacy high.
Säälik et al. (2015) analyzed PISA 2009 data from the Nordic and Baltic countries and reported that student awareness of metacognitive learning strategies was the best predictor of reading proficiency both at student and school levels.
Comparing the PISA 2018 data from China and Turkey, Kılıç-Depren and Depren (2021) found that metacognitive competencies and the socioeconomic and cultural status of students were the significant factors influencing high reading achievement.
Gamazo and Martínez-Abad (2020) examined the predictive power of noncognitive features in the PISA 2018 on overall school achievement. According to the results of the analysis, performance in high socioeconomic status (SES) schools is mostly affected by metacognitive strategies and academic motivation, while performance in low SES schools is influenced by socioeconomic indicators across the country, such as Gross Domestic Product (GDP).
In conclusion, the initiation of our study is in line with the starting point of Lee and Stankov (2018) and Gamazo and Martínez-Abad (2020). The main purpose of this study is to discover which noncognitive variables provide more information about reading performance, with an exploratory approach, instead of modeling certain variables theoretically as a starting point. It would be more meaningful to undertake detailed statistical analysis after determining the variables that provide the most information. This study is intended to contribute to the literature in terms of defining the factors to be utilized in future studies in this regard.
Why is reading performance taken as the dependent variable?
Reading is one of the most important and complex functions of the human brain. It plays a wide range of roles in daily life, from simple written communication activities to high-level cognitive activities such as critical thinking (Hidayati et al., 2020; OECD, 2019a). As is known, reading performance is the major pillar for understanding and solving problems in all other academic domains. In other words, achievement in other areas depends on reading performance. PISA (2019b) addressed this issue as follows: We live in a rapidly changing world, in which both the quantity and variety of written materials are increasing and where more and more people are expected to use these materials in new and increasingly complex ways. It is now generally accepted that our understanding of reading literacy evolves along with changes in society and culture. The reading literacy skills needed for individual growth, educational success, economic participation and citizenship 20 years ago were different from those of today; and it is likely that in 20 years’ time they will change further still. (p. 22)
Consistent with this explanation, many studies have shown that reading performance has a significant impact on achievement in other academic fields, such as mathematics and science (Grimm, 2008; Larwin, 2010; Schlatter et al., 2020). In addition, reading skills are an important determinant on high-level standard tests such as the Scholastic Aptitude Test (SAT) and the American College Test (ACT) (Hendricks, 2013).
Every three years, a randomly selected sample of 15-year-olds take exams in major areas such as reading, mathematics, and science, with each year of assessment focusing on a different topic. Reading was the focus in 2000, math in 2003, science in 2006, and reading again in 2009 (OECD, n.d.). The main subject of PISA 2018 was also reading (OECD, 2019a, s.15). Therefore, the dependent variable of this study was chosen as reading because of the main importance of reading performance explained above.
It is also important to clarify the terms used in this study, such as reading, reading achievement, and reading performance, to avoid ambiguity. “Reading” was used as the name of a general domain (e.g., “the main subject of PISA 2018 was also reading”) in this paper. Although reading performance covers reading and reading achievement conceptually, they were used interchangeably according to the cited articles (e.g., see Cheema, 2018; Kılıç-Depren & Depren, 2021; OECD, 2019a).
Why was PISA data chosen instead of TIMSS?
TIMSS and PISA measure different attributes. As seen from its title (Trends in International Mathematics and Science Study), TIMSS focuses on math and science; PISA focuses on reading additionally. While TIMSS consists of more curriculum-based questions, PISA measures the practical application of skills to real-life problems. While TIMSS is applied to fourth- and eighth-grade students, PISA is administered to 15-year-old high school students (Swensson, 2017). In this respect, PISA can also provide clues as to the achievements of previous years. Finally, while 64 countries were included in the last TIMSS in 2019, 79 countries participated in the last PISA in 2018.
Research questions
This study was conducted to answer three basic questions:
Of all the variables in the PISA student and parent surveys, which variables provide the most information gain (>2 SD) about reading performance? When the PISA variables that provide the most information gain (>2 SD) about reading performance are tested with the decision tree model, with what accuracy can individuals with low and high reading levels be classified? When the PISA variables that provide the most information gain (>2 SD) about reading performance are taken as independent variables, to what extent do they predict reading performance?
Method
The current study was designed based on secondary data analysis. We used the Student, ICT Familiarity, Financial Literacy, Educational Career, Well-Being and Parent Questionnaire data in PISA 2018, which can be downloaded from https://www.oecd.org/pisa/data/2018database/. Ethical approval from the institutional review board (IRB) for studies involving human subjects was not required for secondary data analysis. To answer our research questions, data-mining techniques and structural equation modeling (SEM) were used.
Participants
The participants of the study consisted of 612,004 students studying in the seventh grade and above in a total of 79 countries or economies, 37 of which are OECD members. These students were selected from those who were enrolled in any educational institution full-time or part-time, participating in academic or vocational programs, or attending public or private schools in the country or foreign schools. The ages of the participating students ranged from 15 years 3 months to 16 years 2 months at the time of the assessment, and they had at least 6 years of formal education (OECD, 2019a). 50.2% of the participants were male and 49.8% were female.
Since Reading Adaptive Performance (Core + First Stage) scores and plausible values (PV) for reading were not available in the dataset, the Vietnam sample could not be taken into analysis. In addition, because the Reading Adaptive Performance (Core + First Stage) scores of Argentina, Jordan, Lebanon, Moldova, Romania, Saudi Arabia, Ukraine, and North Macedonia were not used in the assessment, these countries were not taken for data-mining analysis. Consequently, we performed data-mining analyses using the data of 70 countries (N = 301,946; 48.2% female), and path analysis using the data of 78 countries (N = 606,627; 49.8% female).
Variables/features
Variables in PISA 2018 were measured via two group questions according to their content: noncognitive and cognitive questions. Noncognitive questions consist of the background of students and families, including their economic, social, and cultural capital, students’ attitudes towards learning, students’ metacognitive strategies, and their habits and lives in and out of school. Cognitive questions are performance tests prepared to evaluate reading, mathematics, and science achievement (OECD, 2019a).
The Student Questionnaire data file (CY07_MSU_STU_QQQ) provided by the OECD (2018b) included all the data measured by the ICT Familiarity Questionnaire, the Financial Literacy Questionnaire, the Educational Career Questionnaire, the Well-Being Questionnaire, and the Parent Questionnaire. In the current study, we merged the Student Questionnaire (SQ) data file and the Cognitive Item (CI) data file (CY07_MSU_STU_COG) according to students’ ID (CNTSTUID), school ID (CNTSCHID), and country ID (CNTRYID). We used 108 features/variables from the SQ dataset. Nine of 108 features are questions responded to by parents. Some meaningless variables for the study, such as unique national study program code (PROGN), Country of Birth National Categories—Father and Mother (COBN_F/M) were not taken into consideration. All noncognitive features and their codes in the dataset can be seen in Table 1.
Variables/features and codes in PISA 2018.
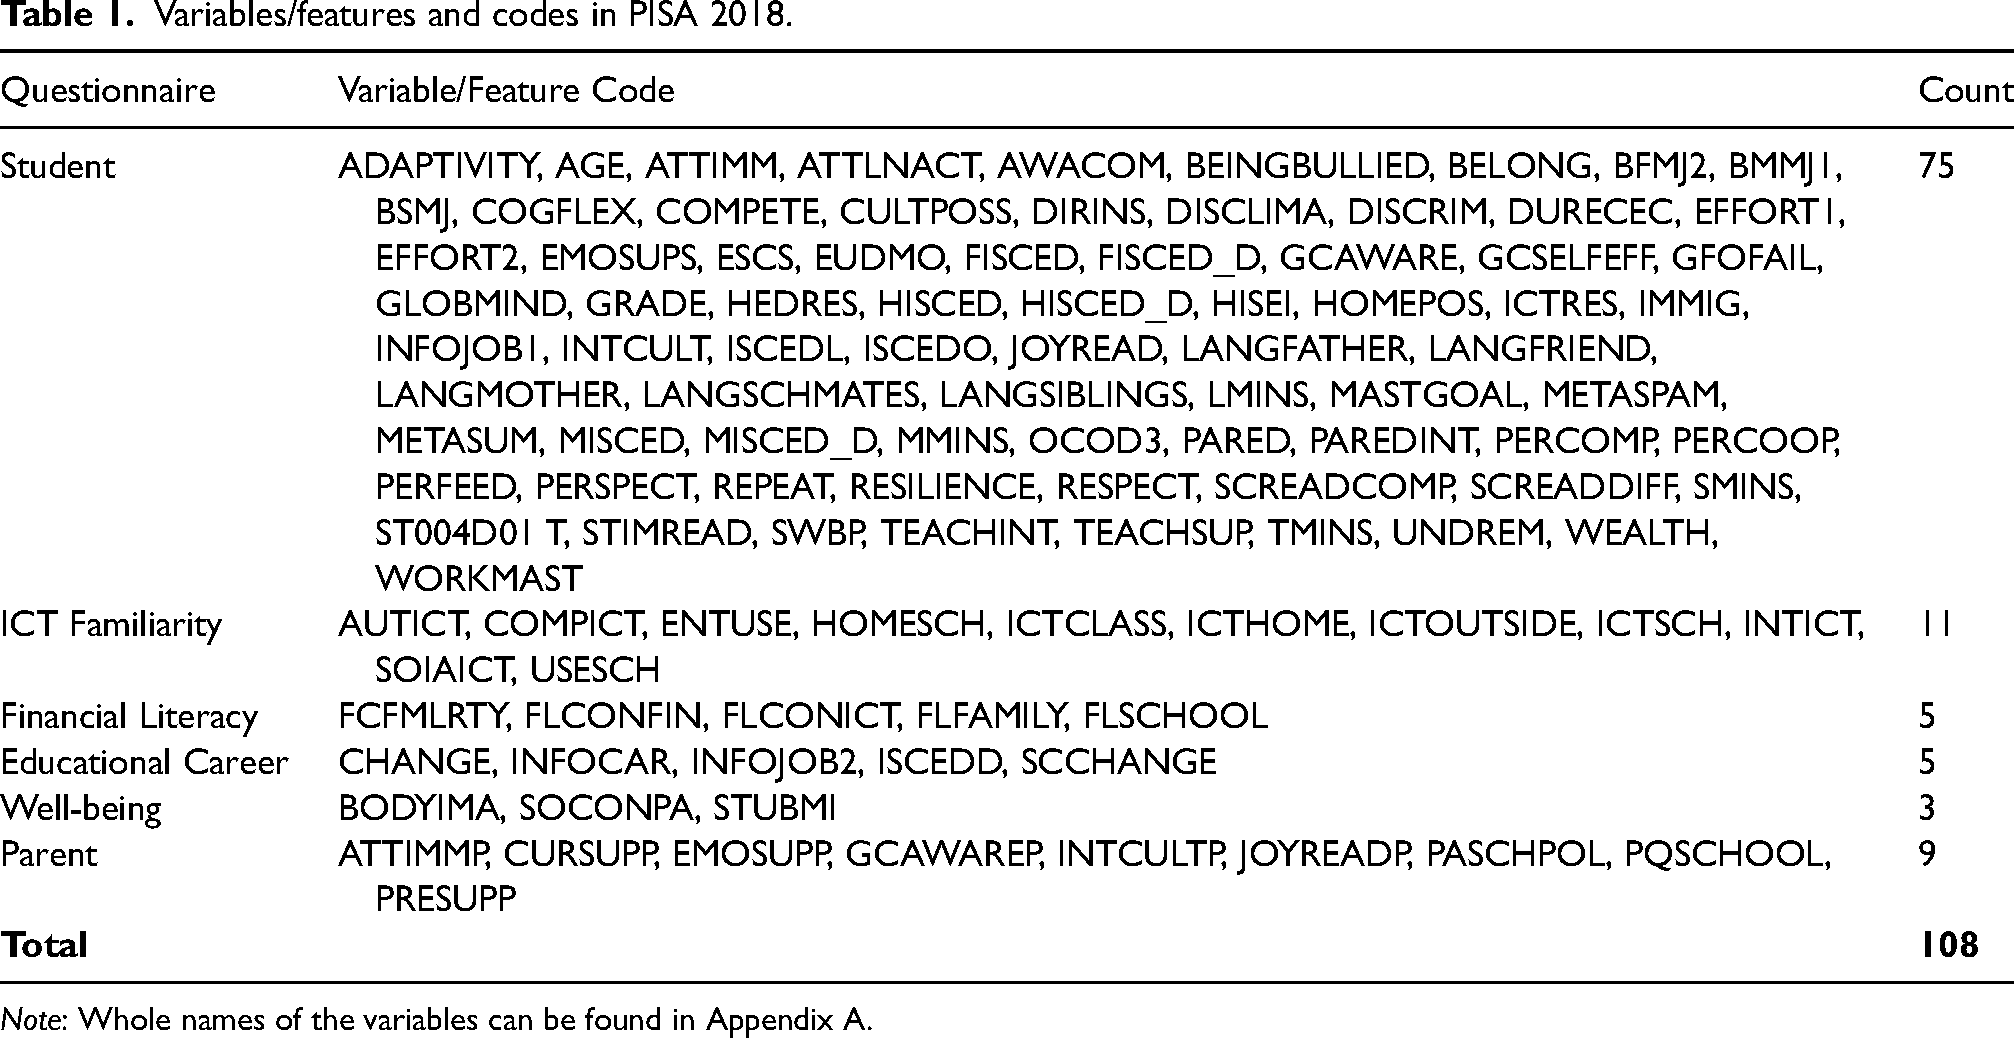
Note: Whole names of the variables can be found in Appendix A.
In the SQ dataset, many items were designed to measure latent constructs that cannot be directly observed. Significant indices were created by applying various transformations or scaling procedures to these items. These indices are called “derived variables.” Derived variables were generated using methods such as transforming or re-coding one or more questionnaire items with simple arithmetic operations, and Item Response Theory (IRT) scaling (OECD, 2009).
According to IRT scaling, for each item, person j’s responses to item i are modeled as a function of the latent construct (Qj). With one-parameter model proposed by Rasch (1960) for dichotomous items (True-False or 1-0), the probability of person j selecting category 1 (or True) is calculated according to the equation 1 (Rasch, 1960).
where
As mentioned in the “Introduction,” we took reading performance as a dependent variable. Therefore, we used the “Reading Adaptive Performance: Core + First Stage” (RCO1S_PERF) variable when calculating information gain, the decision tree, and the random forest since these techniques required the data to be categorical. The Multistage Adaptive Design (MSAT) method for the reading performance consists of three stages: Core Stage, Stage 1, and Stage 2. In the reading literacy test, there are a total of 245 items in total, with 45 different units (5 units in the core stage, 24 units in Stage 1, and 16 units in Stage 2). Students were classified as “Low Level,” “Medium Level,” and “High Level” according to their scores at the Core plus first stage (OECD, 2012).
We also used ten plausible values (PV) while performing path analysis since the data must be continuous. PISA is a large-scale international testing application focusing on the population rather than the individual performance of students. Therefore, student proficiency levels are reported using plausible values (PV). In PISA 2018, students’ reading performance/proficiency levels were reported with 10 PVs. A common mistake when analyzing PVs is calculating the average of the PVs before analysis. Although PVs are useful in large-scale applications with large populations, they are not recommended for individual-level scores (OECD, 2009; Wu, 2005).
Data analysis procedure
Data analysis in the study can be grouped under two headings. These are data-mining analysis and structural equation modeling (SEM). There are different techniques used to analyze big data. Information gain, decision tree, and random forest methods are the most commonly used techniques in the context of machine learning. Although these are different techniques, each one is used to support and explain others’ findings respectively. For example, information gain was used to determine the most significant features, providing more information among all features in the current study. Later, decision tree classification analysis was performed using the significant features selected in the previous step to build a hierarchical tree structure as an output. Thus, this algorithm could be used to predict reading performance using the most significant features in a hierarchical model. Actually, this model becomes the basis for artificial intelligence to make decisions in future applications. After the decision tree model was built, the random forest method was used to determine the order of importance of the top features used in the analysis and to consolidate the findings. As explained in the Introduction, the main purpose of this study was to discover which noncognitive variables provided more information about reading performance with an exploratory approach. These techniques facilitated answering the main research question. In the final section, path analysis in the context of SEM was used to generate a meaningful model based on earlier exploratory findings. Thus, after determining the top features in the big dataset (without premeditating) via data-mining methods, we finally reached a statistically more robust model.
The R software (R Core Team, 2016) was used for dataset preparation. After the dataset preparation process, the information gain values of each feature (independent variables) were calculated according to the target (dependent) variable. Then we created a decision tree model using the features selected. We also calculated feature importance values via a random forest technique. Finally, we computed the predictive power of these selected variables on reading performance. The details of the data analysis procedure are shown in Figure 1.

Data analysis procedure.
Information gain
The purpose of the information gain analysis was to calculate which features provide the most information gain scores according to students’ reading performance. We selected only low and high-level students to reach clearer findings. Therefore, 301,946 students from 70 countries and economies were taken for analysis. We calculated the information gain scores for 108 features. Information gain scores of 108 variables are given in Appendix A.
The merged data file was converted to CSV format and was used in the analysis. The information gain is based on the entropy formula introduced to computer science by Shannon (1948). Entropy is a numerical measure of uncertainty in data and is calculated according to equation 2:
where k = 1, 2, 3, . . ., m represents the m classes of the target variable. 
where A represents a feature in the dataset, C represents the target variable, H(C) represents the entropy of the target variable, T represents the subset of the class C partitioned according to the A feature, H(C|A) represents the entropy of the target variable according to the A feature. IG(C, A) is the information gain value of the A feature according to the target variable C.
Information gain is also used as a splitting criterion in some decision tree algorithms (Quinlan, 1986, 1993). In addition, information gain is one of the methods used to determine the importance of features in filtering-based feature selection methods (Kotu & Deshpande, 2019).
The purpose of the information gain analysis in the current study is to filter the features in the dataset and continue the next analysis with features having a two standard deviation or higher information gain score. According to Prasetiyowati et al. (2021), threshold values for information gain can be found via different techniques. They proposed “threshold rate determination using the information gain value's standard deviation generated by each feature in the dataset” (p. 1). Thus, we calculated the mean (M = 0.038141173686) and standard deviation (SD = 0.03091608722) of all information gain scores for 108 variables. To be more conservative, we accepted two standard deviations [0.04 + (0.03 × 2) = 0.10] as the cut-off point, which is higher than 97.5% of all features. KNIME software (Berthold et al., 2009) was used for information gain analysis.
Decision tree
In the next step of the data-mining analysis, decision tree classification analysis was performed using the six features selected in the previous step. Many decision tree algorithms, such as ID3 (Quinlan, 1986), C4.5 (Quinlan, 1993), CART (Breiman et al., 1984) have been developed. In decision tree analysis, the dataset is divided into partitions according to the splitting criterion of the algorithm and a hierarchical tree structure is built as an output. The hierarchically top element of the tree is called the root. The root is followed by a top-down structure consisting of nodes and leaves. The bottom leaves contain the class labels. When the decision tree algorithm predicts the class of an instance, it starts at the root of the tree and moves from top to bottom according to the features of the instance, ending at the last leaf. The class label on this leaf is considered the class label for instance.
One of the important issues while building the tree structure in decision tree analysis is to determine the splitting criterion in the root and child nodes. The aim is to identify the most distinctive features in the dataset and to choose them as splitting criteria. Metrics such as information gain, entropy-based gain ratio, Gini Index, and chi-square are used as splitting criteria. Algorithms such as ID3 and C4.5 use information gain as the splitting criteria, while the CART algorithm uses the Gini Index as the splitting criteria. In the current study, the entropy-based gain ratio was used as the splitting criterion.
In decision tree analysis, a process called “pruning” is applied to reduce the complexity of the tree structure. There are some methods of performing pruning before (Takamitsu et al., 2004) and after (Fürnkranz, 1997; Mehta et al., 1995) the tree is built. These methods are called “pre-pruning” and “post-pruning.” The Minimum Description Length (MDL) method, which is a post-pruning method, was used in the decision tree analysis in this study (Mehta et al., 1995). The KNIME software (Berthold et al., 2009) was used for the analysis.
Random forest
After the decision tree model was built, the random forest (Breiman, 2001) method was also used to determine the order of importance of the six features used in the analysis. The random forest method is an ensemble learning method that works by creating a decision tree model collection from a dataset. In the random forest method, the decision tree collection is created by random feature selection called “bagging.” When predicting the class of an instance in the random forest method, each built tree model predicts the class for the instance, and the class with the most votes is returned as the prediction class. The random forest method is also recommended to rank the importance of features in a regression or classification analysis (Breiman, 2001). Scikit-learn library for Python (Pedregosa et al., 2011) was used for random forest analysis.
Model evaluation measures
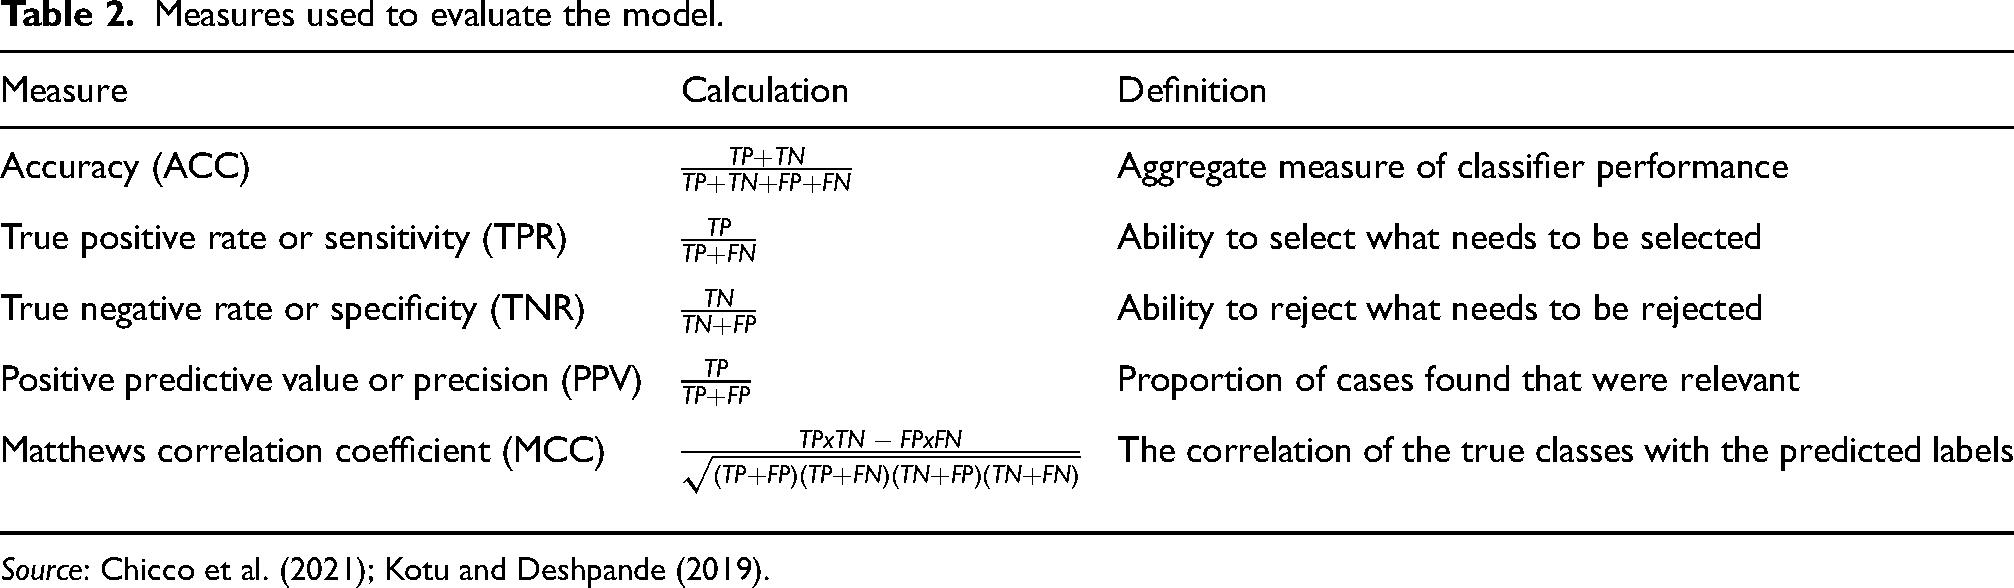
The best way to evaluate the success of a classification model in data-mining analysis is to use a truth table called the confusion matrix (Kotu & Deshpande, 2019). There are four possible situations when a binary classification model tries to predict the class of an instance:
The instance where actual class is positive is predicted as positive by the model (called true positive or TP) The instance where actual class is positive is predicted as negative by the model (called false negative or FN) The instance where actual class is negative is predicted as negative by the model (called true negative or TN) The instance where actual class is negative is predicted as positive by the model (called false positive or FP)
In the data-mining analysis in this study, students with “high level” reading performance are positive instances, while students with “low level” reading performance are negative instances. In a model with excellent prediction accuracy, the FP and FN numbers on the confusion matrix are equal to zero. The confusion matrix format used when evaluating a classification model in data-mining analysis is presented in Figure 2.

Confusion matrix.
There are measures such as Sensitivity (TPV), Specificity (TNR), Precision (PPV), Accuracy (ACC), Matthews Correlation Coefficient (MCC) are calculated using the values on the confusion matrix to evaluate the model's success. The meaning of these measures and how they are calculated are presented in Table 2.
Measures used to evaluate the model.
In the decision tree and random forest analysis, 80% of the instances in the dataset (241,556 instances) were used to build the model and 20% (60,390 instances) were used to test the models.
Structural equation modeling
To examine the predictive power of independent variables on reading performance, a path analysis using structural equation modeling was performed in AMOS 16 (Arbuckle, 2007). Path analysis is a technique for evaluating a theoretical model that includes direct and possibly indirect effects between independent (exogenous) and dependent (endogenous) variables. Although path analysis and multiple regression analysis are comparable approaches, path analysis gives a stronger framework for establishing a specific theoretical model regarding the relationship between a collection of predictor and dependent variables than multiple regression. Maximum likelihood (ML) estimation was used because multivariate normality was assumed for the population distributions of the dependent variables (reading plausible values) (Kline, 2011).
In the path model, home possessions (HOMEPOS), cultural possessions at home (CULTPOSS), and ICT resources at home (ICTRES) were considered in the same category, which means SES is a latent variable. In addition, metacognition: assessing credibility (METASPAM) and metacognition: summarizing (METASUM) were taken as another latent variable named “metacognition.” We also took 10 plausible values of reading performance as a latent variable because they are not recommended for individual estimation as mentioned before. OECD experts (2009, p. 98) suggested that plausible values can be used as a latent variable in estimation of population parameters.
Results
RQ 1: Of all the variables in the PISA student and parent surveys, which variables provide the most information gain (>2 SD) about reading performance?
Information gain analysis
The information gain values of all the features in the dataset were calculated to answer the first research question. The values of 108 features vary between 0.0004 and 0.1554. The features with information gain values of 0.10 (2 SD) and higher are “cultural possessions” (0.1554), “metacognition: assessing credibility” (0.1239), “ICT resources” (0.1171), “metacognition: summarizing” (0.1131), “home possessions” (0.1118), and “liking/enjoying reading” (0.1080). The six features with the highest information gain value are presented in Table 3. Information gain values for all features can be seen in Appendix A. RQ 2: When the PISA variables that provide the most information gain (>2 SD) about reading performance are tested with the decision tree model, with what accuracy can individuals with low and high reading levels be classified?
Top six features according to information gain values.

Decision tree analysis
In the decision tree analysis, a prediction model with six variables (CULTPOSS, METASPAM, ICTRES, METASUM, HOMEPOS, and JOYREAD) was created and the performance of the model was evaluated. The data revealed that the accuracy value of the model was 0.7461. The performance evaluation measures of the decision tree model are presented in Table 4.
Decision tree model evaluation measures.

The root of the tree structure built with the decision tree model is the HOMEPOS. After the root level, the METASPAM and METASUM features are located at the second level hierarchically. The tree structure is presented with Figure 3. The whole tree structure can be downloaded as a PDF from Appendix B.

Tree structure of the model.
Random forest analysis
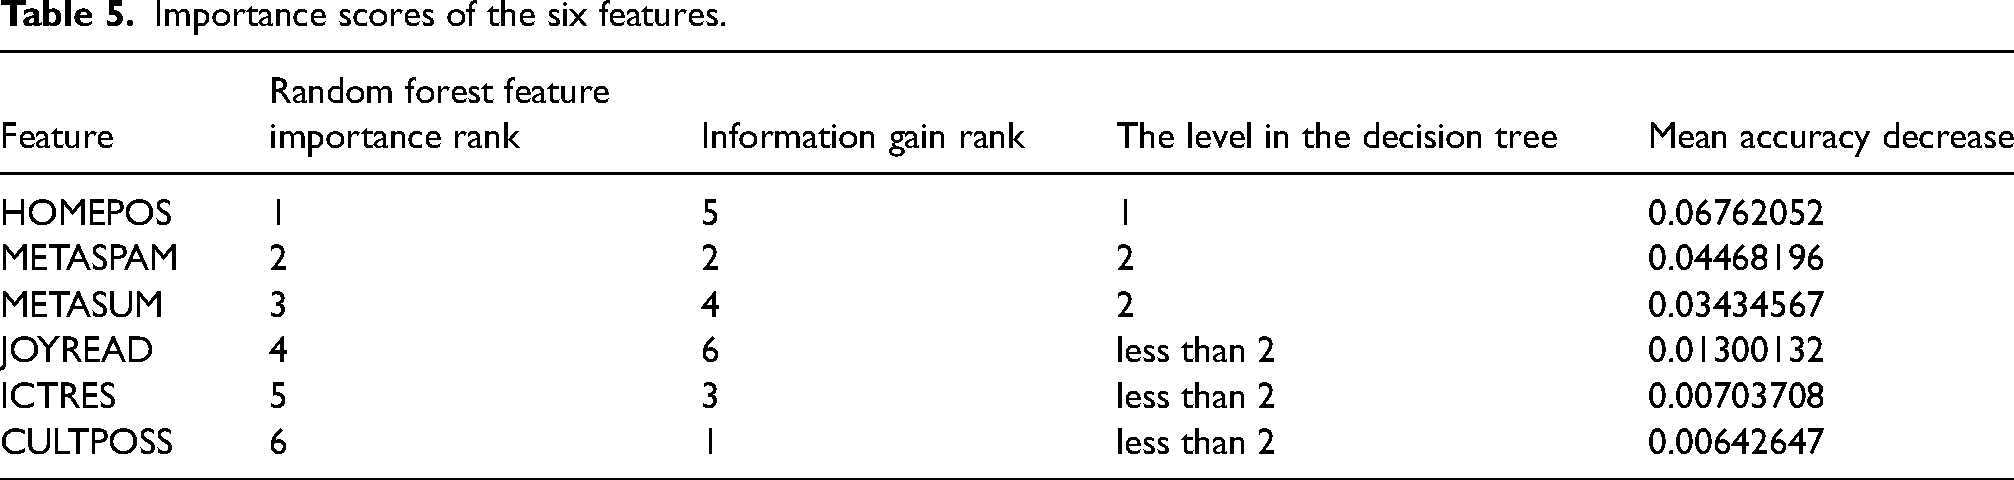
The random forest method was also used to determine the order of importance of six features used in the decision tree model and to verify the hierarchy in the constructed tree structure. According to the analysis, HOMEPOS is located in the first place, METASPAM is located in the second place, and METASUM is located in the third place in order of importance. It is noteworthy that the METASPAM is also located in the second place in the decision tree model and information gain analysis. Another remarkable result is that HOMEPOS, METASPAM, and METASUM are among the first five features in information gain analysis and random forest analysis, and they are located at the root and second levels of the decision tree. The importance scores of six features calculated by random forest analysis are presented in Table 5. RQ 3: When the PISA variables that provide the most information gain (>2 SD) about reading performance are taken as independent variables, to what extent do they predict reading performance?
Importance scores of the six features.
Path analysis
Path analysis was utilized in the context of structural equation modeling to answer the last research question. As seen in Figure 4, SES (CULTPOSS, ICTRES, HOMEPOS), metacognition (METASPAM and METASUM), and liking/enjoying reading (JOYREAD) were considered independent (predictor/exogenous) variables, and reading performance was taken as a dependent (outcome/endogenous) variable. SES, metacognition, and reading performance are latent variables, while liking/enjoying reading is an observed variable.
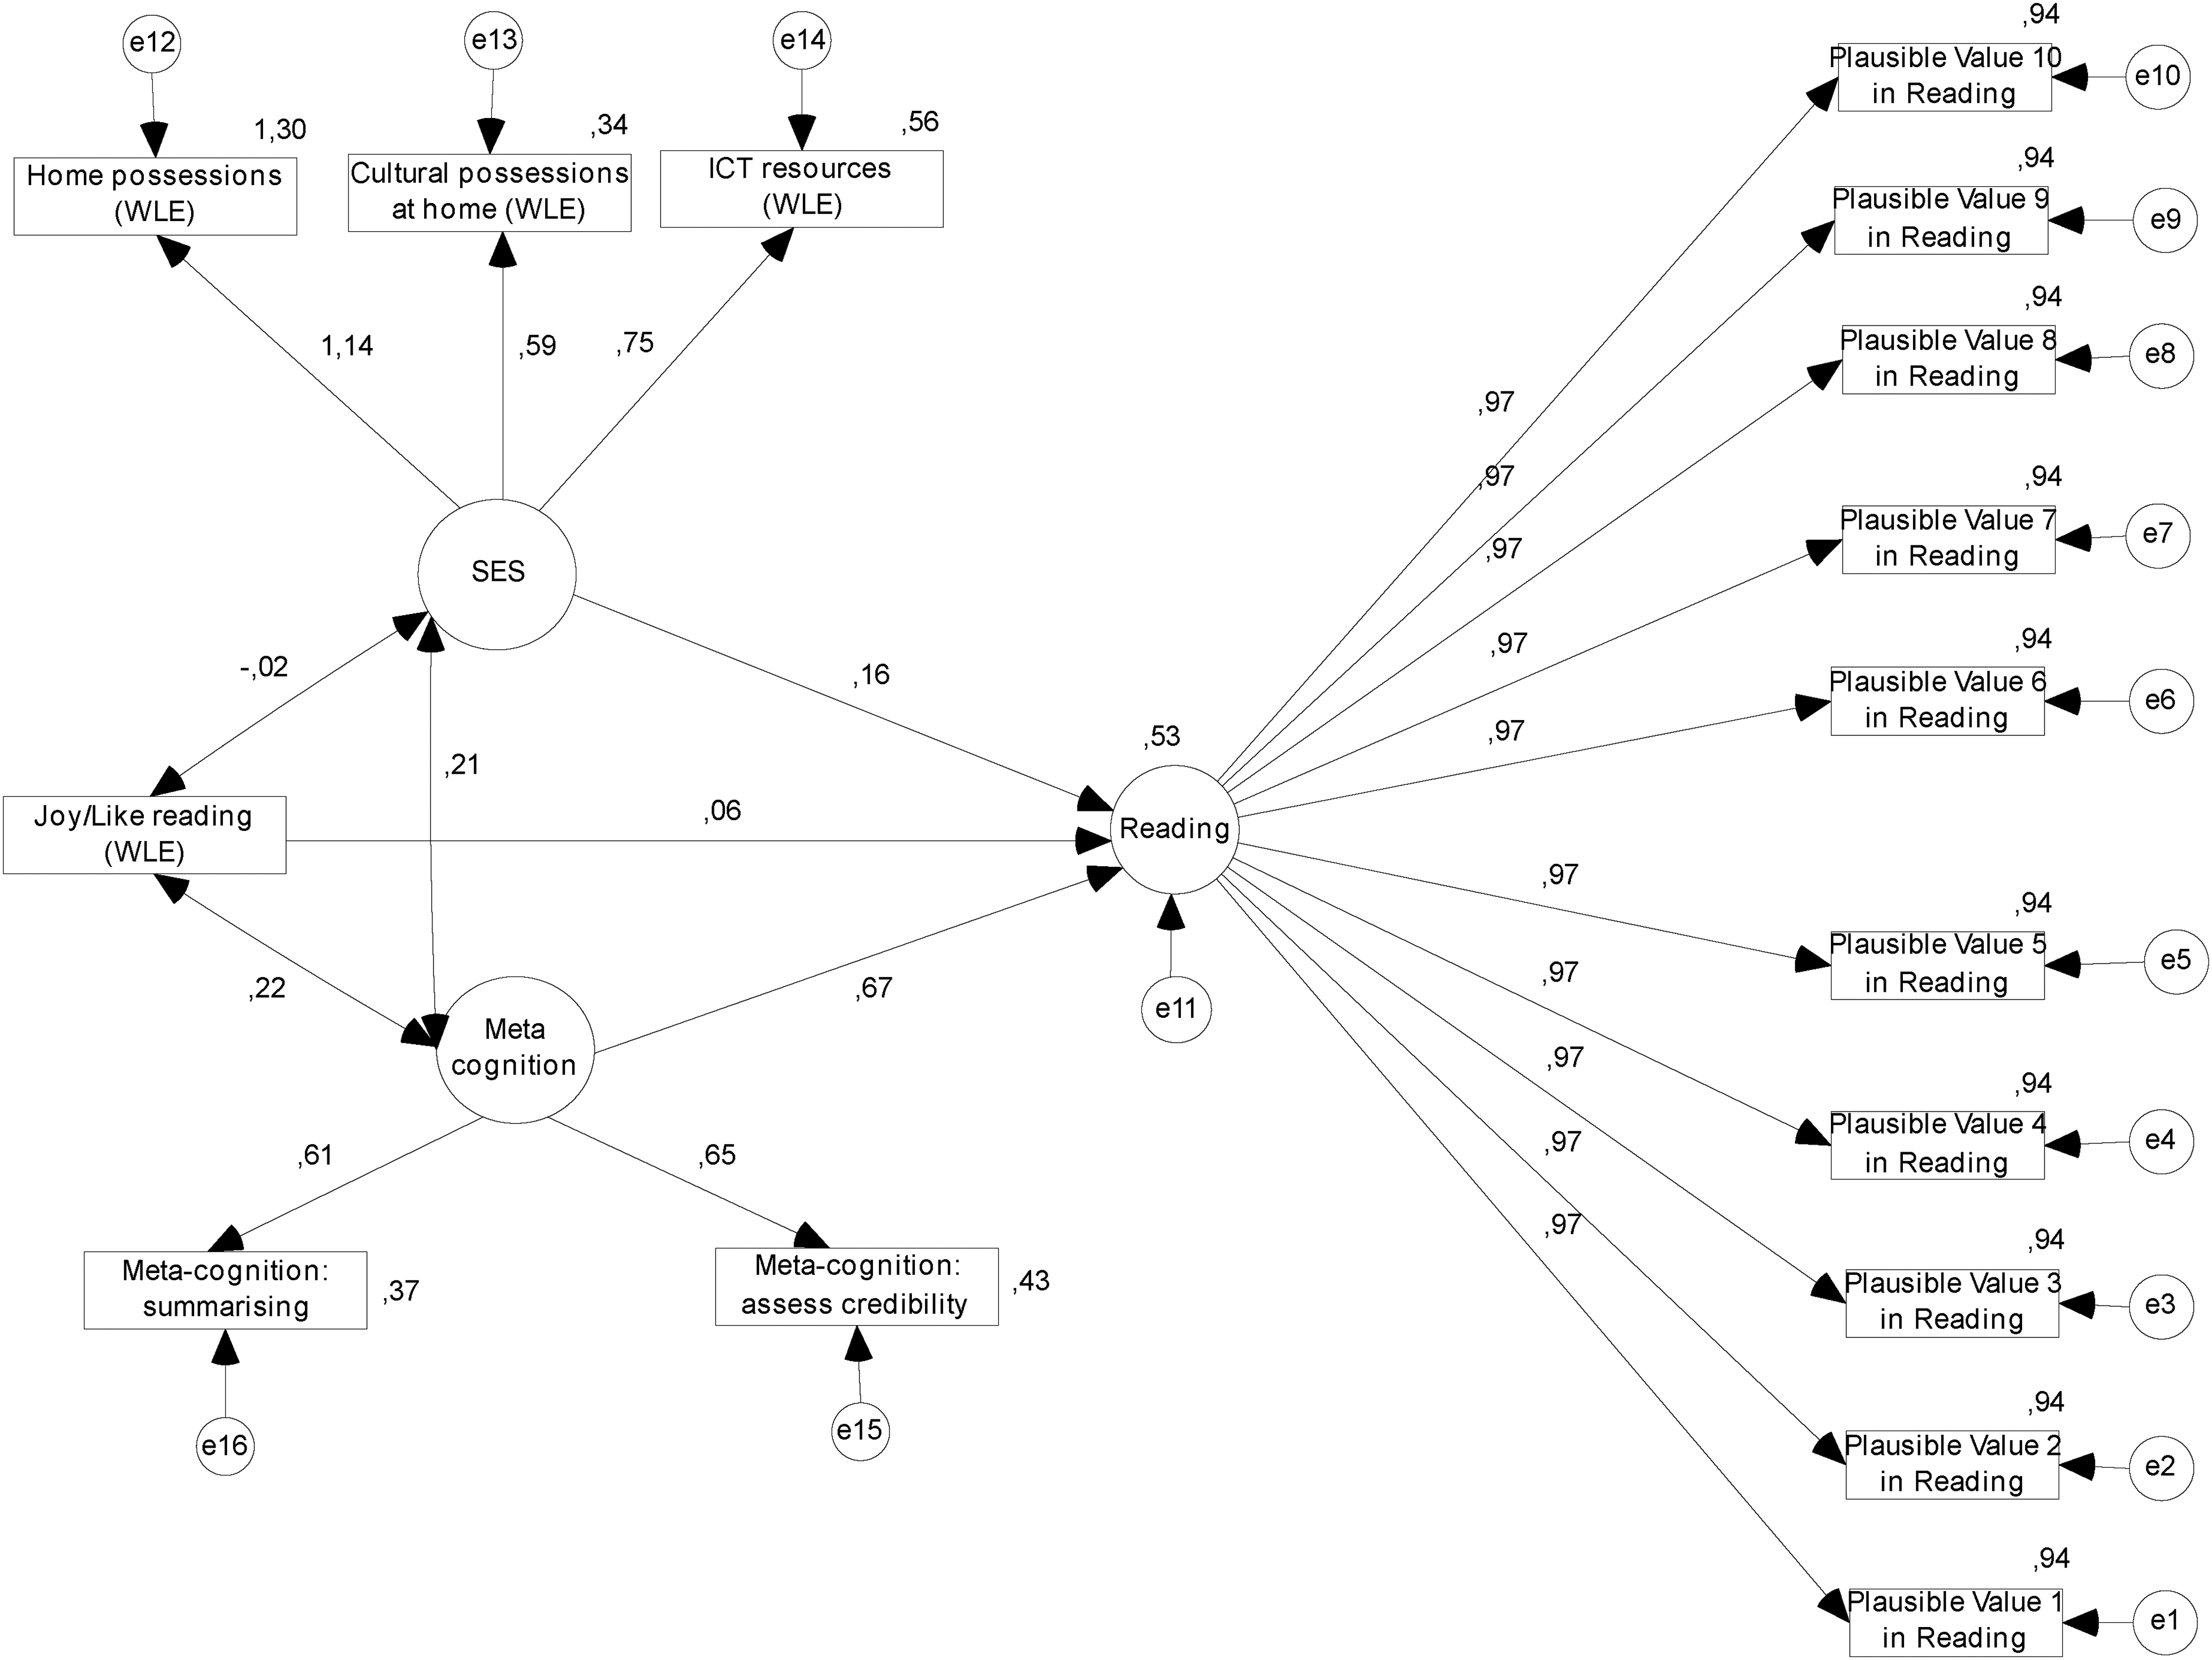
Path analysis: Predictors of reading performance.
Single-headed arrows in the model represent the direction of the effect of the predictor variable on the outcome variable. The number related to each of the single-headed arrows is the path (standardized) coefficient. The curved two-headed arrows connecting two variables are correlation coefficients between predictor variables. Small circles illustrate errors in the prediction of endogenous variables (Kline, 2011).
RMSEA, NFI, TLI, and CFI were selected to test the model's fit (Hu & Bentler, 1999; Tabachnick & Fidell, 2007). The model fit indices showed a good fit, indicating that the sample size had sufficient power (RMSEA = .029; NFI = 0.997; TLI = 0.995; CFI = 0.997).
The path model revealed that SES, metacognition, and enjoying reading predict reading performance significantly (β = 0.16, p = .001, β = 0.67, p = .001, and β = 0.06, p = .001, respectively). In other words, when SES increases by one point, reading performance correspondingly increases by 12.30 points. When metacognition increases by one point, reading performance increases by 107.87 points. When enjoying reading increases by one point, reading performance increases by 6.46 points. In addition, these three variables explain 53.3% of the variability in reading performance. Finally, these three variables have significant correlations with each other (p < .001).
Discussion
As aforementioned, the main purpose of this study was to discover the noncognitive variables that provided more information about reading performance with an exploratory approach. Data-mining methods provided answers to the first two research questions. Thus, we could create a more comprehensive model and test it via path analysis to answer the third research question. After determining the top features in the big dataset via data-mining methods, we finally reached a statistically more robust model.
Reading performance was defined as “understanding, using, evaluating, reflecting on, and engaging with texts in order to achieve one's goals, to develop one's knowledge and potential, and to participate in society” in PISA 2018 (OECD, 2019b, p. 28).
For 99 variables in the student questionnaires and 9 variables (a total of 108 features) in the parent questionnaire, the information gain values were calculated and ranked according to the reading performance levels of the students. As a result of this ranking, it was seen that the number of variables with an information gain value of 0.10 (2 SD) and above was six. These six variables are “cultural possessions” (CULTPOSS), “Metacognition: assessing credibility” (METASPAM), “ICT Resources” (ICTRES), “Metacognition: summarizing” (METASUM), “home possessions” (HOMEPOS), and “liking/enjoying reading” (JOYREAD), respectively.
When these variables are considered according to their characteristics, it is seen that cultural possessions and ICT resources at home are in the same category as home possessions in the student questionnaire. Indeed, five of the 25 questions about home possessions belong to questions about cultural possessions (ST011Q07TA, ST011Q08TA, ST011Q09TA, ST011Q16NA, and ST012Q09NA), and six of them are belong to questions about the ICT resources (ST011Q05TA, ST011Q06TA, ST012Q05NA, ST012Q06NA, ST012Q07NA, and ST012Q08NA) (OECD, 2018a, p. 14). Therefore, it is possible to evaluate these three features as a latent socioeconomic (SES) variable. Considering the six variables, the three features providing the highest information gain about reading performance are socioeconomic and cultural variables. In addition, the decision tree model revealed that home possessions are located at the root level, which is the top level of the tree hierarchically, so it is the most distinctive feature in the model. The path model also showed that when SES increased by one point, the reading performance increased by 12.30 points. These findings are consistent with those of Güven (2019), Gamazo and Martínez-Abad (2020), and Kılıç-Depren and Depren (2021). The meta-analysis study conducted by Çiftçi and Cin (2017) also showed that socioeconomic status has a high level of influence on predicting student achievement.
Socioeconomic status is not only the family's property or cultural assets, but also a reflection of the family's cultural heritage and worldview. This worldview directly affects parental attitudes and the child's view of education (Kotchick & Forehand, 2002). In the study of Sarsour et al. (2011) examining the relationship between the SES of the family and the child's neurocognitive development, they found that SES has an effect on the child's higher-order executive functions. In particular, these executive functions are related to inhibitory control such as blocking distracting stimuli and cognitive flexibility, which is the ability to adjust cognitively to unexpected situations. According to Sarsour et al. (2011), these abilities are also important for daily functioning at home, in school, and in critical social settings. Additionally, they reported that the home environment mediated the relationship between parents’ SES and children's executive functions. This result is also important for understanding the association between metacognitive skills and reading performance, which is another significant finding of our study and discussed below. Indeed, our theoretical model (SEM) indicated that there is a significant relationship between metacognitive skills and SES.
Although SES is not the only variable affecting academic achievement (Caldwell & Ginther, 1996; Milne & Plourde, 2006), it is one of the necessary prerequisites for success (Koyuncu & Fırat, 2020; Reardon, 2016). As a matter of fact, the availability of a child's own room, work desk, supporting materials (e.g., books, dictionaries, educational software), and technical support (e.g., ruler, miter, computer) are the basic elements for effective study (Filiz & Öz, 2019).
Two other remarkable features are metacognitive skills: assessing credibility (2nd rank) and summarizing (4th rank). Similarly, the decision tree model showed that both metacognitive skills are located at the second level of the tree hierarchically. At the same time, these features are positioned in the second and third order according to the random forest analysis. Path analysis also indicated that metacognitive skills are the best variable contributing to the model. When metacognitive skills increased by one point, the reading performance increased by 107.87 points.
Metacognition is defined as “an individual's ability to think about and control his or her reading and comprehension strategies” in PISA 2018 (OECD, 2019b, p. 52). Artelt and Schneider (2015) acknowledged that there is a limit to evaluating metacognitive strategies based on self-report in PISA, but they stated that self-report is a valid indicator of habitual strategic behavior.
Assessing quality and credibility is “evaluating the information in a piece of text: whether the information is valid, up-to-date, accurate, and/or unbiased” (OECD, 2019b, p. 35). Assessing credibility can be considered a metacognitive skill related to critical thinking as well (Hartman, 2001; OECD, 2020). The term “assessing credibility” fits the metacognitive function described by Pressley and Afflerbach (1995) as “constructively responsive reading.” According to Van Kraayenoord (2010), constructively responsive readers read with a purpose and actively create meaning from text. Indeed, the question asked in PISA 2018 (ST166) aimed to measure this skill through a vignette in the online environment (OECD, 2018a, p. 13). Since the question in PISA 2018 includes evaluating the credibility of information in the online environment, it is similar to the study of Van Zyl et al. (2020). Van Zyl et al. (2020) emphasized that assessing the credibility of information in the online environment can only be realized with critical thinking skills.
The skill of summarizing includes not only understanding what you have read, but also being able to briefly and concisely explain the information obtained in one's own words. The competence of the individual in this area will naturally affect reading performance positively. Good readers utilize several methods before, during, and after reading, and typically use them in a coordinated manner. Predicting forthcoming text content before reading, utilizing questions, forming mental images while reading, and summarizing after reading are some of the methods used (Pressley & Afflerbach, 1995; Van Kraayenoord, 2010).
There are many studies showing the direct relationship between metacognitive and reading skills (Hendricks, 2013; Johnson et al., 2010; Van Kraayenoord, 2010). In a recent study conducted by Kılıç-Depren and Depren (2021), it was determined that metacognitive skills are the most important variable affecting reading performance. Artelt and Schneider (2015) and Zhou et al. (2020) showed that metacognitive skills are significantly related to reading competence in PISA 2009. Artelt et al. (2001) also stated that metacognitive skills are the best variable for predicting reading performance when the SES is controlled.
Information gain analysis indicated that liking/enjoying reading is the sixth variable providing information about reading performance. In the decision tree, this feature is located at the lower levels of the tree structure. In the random forest analysis, it is in the fourth place in importance. Similarly, in the path analysis, enjoying reading contributes the least to the model. When enjoying reading increased by one point, the reading performance increased by 6.46 points.
Liking/enjoying reading (JOYREAD) is a question (ST160) asked with five items in PISA 2018 (OECD, 2018a, p. 17). It is also noteworthy that, among more than 100 variables, enjoying reading is one of the variables providing the most information gain on reading performance. The presence of this variable after SES and metacognitive skills is important in terms of showing the most important affective factor in reading performance.
There are many internal and external motivation sources for reading behavior. As there are external motivation sources such as grades, competitions, and social context, there are also intrinsic motivation sources such as curiosity, efficacy, and enjoyment (Hebbecker et al., 2019; Schiefele et al., 2012). As a result of the systematic review study by Schiefele et al. (2012), in which they examined the findings of 20 years of studies on reading motivation and reading competence, it was seen that reading for enjoyment is the most important variable having a relationship with reading competence. Similar to our study, Park (2011), Schwabe et al. (2015), Cheema (2018), and Kavanagh (2019) also found that enjoyment of reading (intrinsic reading motivation) significantly predicted reading achievement.
When 99 features based on students’ perceptions and 9 features obtained from the parent questionnaire were analyzed as independent variables, it was seen that SES, metacognitive skills, and liking/enjoying reading were major variables predicting reading performance. It is noteworthy that the features measured by the parent questionnaire were in the last place (91 and later) according to the calculated information gain values.
Finally, SES, metacognitive skills, and enjoying reading explain 53.3% of the variability in reading performance. This rate can be considered high in the context of social sciences. In this respect, our study also sheds light on future research. It is also remarkable that the decision tree model created with only these six variables has a 74.61% accuracy value in estimating the reading performance. This means that the decision tree model with the six features can be used to predict the reading performance of students in artificial intelligence algorithms.
Limitations of the study
This study has some limitations for methodological reasons. First of all, the dataset is provided by the OECD (2018b) as open access. This dataset, which is used by many researchers, also constitutes the dataset for our study. In this respect, the study is considered a secondary data analysis. However, the research questions we have addressed and the analysis techniques we have used make this study different from other studies.
In our study, only the noncognitive features responded to by the students and the parents were included in the analysis as independent variables. The features obtained from the teacher questionnaire were not included in the analysis. The main reason for this was to evaluate the students’ self-perceived characteristics and their parents’ attitudes (in the microsystem).
Finally, the dependent variable of this study is only general reading performance. In PISA 2018, besides different reading skills at a detailed level, competencies in mathematics and science were also measured. However, such a path was followed since reading competence was the main subject in PISA 2018 and to narrow the scope of the study.
Suggestions for future studies
We propose that research on large educational datasets consider all variables in the dataset rather than just a few. Although some theoretical models and pre-designed variables facilitate the research process, they also cause biased approaches and results. As a relatively new approach to educational data, data-mining strategies can provide more opportunities to see the big picture. In future studies, it is thought that determining the variables providing the most information gain in mathematics and science competence with the same methods is important to see the big picture. In addition, it is thought that examining the relations between the features we found in this study and different variables will provide more information to educational scientists and politicians.
Footnotes
Acknowledgements
We would like to thank Dr. Jack Cummings for proofreading of the manuscript.
Authors' Note
Osman Tolga Aricak is also affiliated at Department of Primary Education at Bogazici University, Istanbul, Turkey.
Declaration of conflicting interests
The authors declared no potential conflicts of interest with respect to the research, authorship, and/or publication of this article.
Ethics statement
Ethical review and IRB approval were not required because the study is based on the public databases of the PISA 2018 assessment. Data collection for PISA studies is the responsibility of the governments of the participating countries.
Funding
The authors received no financial support for the research, authorship, and/or publication of this article.
Appendix
Information gain scores of 108 variables

| Rank | Feature code | Description | Information gain value |
|---|---|---|---|
| 1 | CULTPOSS | Cultural possessions at home (WLE) | 0.155399649188 |
| 2 | METASPAM | Meta-cognition: Assess credibility | 0.123902460153 |
| 3 | ICTRES | ICT resources (WLE) | 0.117125626705 |
| 4 | METASUM | Meta-cognition: Summarizing | 0.113057507539 |
| 5 | HOMEPOS | Home possessions (WLE) | 0.111763858037 |
| 6 | JOYREAD | Joy/Like reading (WLE) | 0.108001036324 |
| 7 | ESCS | Index of economic, social and cultural status | 0.093091451295 |
| 8 | TMINS | Learning time (minutes per week)—In total | 0.089851125524 |
| 9 | BMMJ1 | ISEI of mother | 0.088895263481 |
| 10 | HISEI | Index highest parental occupational status | 0.088508331643 |
| 11 | UNDREM | Meta-cognition: Understanding and remembering | 0.086823021257 |
| 12 | WEALTH | Family wealth (WLE) | 0.083049803432 |
| 13 | SCREADDIFF | Self-concept of reading: Perception of difficulty (WLE) | 0.079855398884 |
| 14 | HEDRES | Home educational resources (WLE) | 0.076968710450 |
| 15 | GCAWARE | Student's awareness of global issues (WLE) | 0.069194130227 |
| 16 | OCOD3 | ISCO-08 Occupation code—Self | 0.067989645645 |
| 17 | INTICT | Interest in ICT (WLE) | 0.064279145259 |
| 18 | BFMJ2 | ISEI of father | 0.063950724175 |
| 19 | MMINS | Learning time (minutes per week)— | 0.063300355981 |
| 20 | RESILIENCE | Resilience (WLE) | 0.059829061347 |
| 21 | WORKMAST | Work mastery (WLE) | 0.058291749537 |
| 22 | LMINS | Learning time (minutes per week)—<test language> | 0.057695494684 |
| 23 | BELONG | Subjective well-being: Sense of belonging to school | 0.057625505905 |
| 24 | SMINS | Learning time (minutes per week)— | 0.057371857553 |
| 25 | GCSELFEFF | Self-efficacy regarding global issues (WLE) | 0.055219615194 |
| 26 | BSMJ | Student's expected occupational status (SEI) | 0.052911889526 |
| 27 | COMPICT | Perceived ICT competence (WLE) | 0.052740315511 |
| 28 | BEINGBULLIED | Student's experience of being bullied (WLE) | 0.051444810823 |
| 29 | ENTUSE | ICT use outside of school (leisure) (WLE) | 0.050162215683 |
| 30 | HOMESCH | Use of ICT outside of school (for school work activities) (WLE) | 0.049729083027 |
| 31 | DIRINS | Teacher-directed instruction (WLE) | 0.049255263999 |
| 32 | MASTGOAL | Mastery goal orientation (WLE) | 0.046605196575 |
| 33 | EFFORT2 | How much effort would you have invested? | 0.045475854056 |
| 34 | DISCRIM | Discriminating school climate (WLE) | 0.045303606335 |
| 35 | ICTHOME | ICT available at home | 0.044751724644 |
| 36 | SCREADCOMP | Self-concept of reading: Perception of competence (WLE) | 0.043727867098 |
| 37 | ICTSCH | ICT available at school | 0.043553649520 |
| 38 | USESCH | Use of ICT at school in general (WLE) | 0.042539185725 |
| 39 | ATTLNACT | Attitude towards school: Learning activities (WLE) | 0.042046686210 |
| 40 | ATTIMM | Student's attitudes towards immigrants (WLE) | 0.041943154524 |
| 41 | AUTICT | Perceived autonomy related to ICT use (WLE) | 0.041386967845 |
| 42 | AWACOM | Awareness of intercultural communication (WLE) | 0.041367900404 |
| 43 | STIMREAD | Teacher's stimulation of reading engagement perceived by student (WLE) | 0.038109831265 |
| 44 | RESPECT | Respect for people from other cultures (WLE) | 0.037305002615 |
| 45 | GRADE | Grade compared to modal grade in country | 0.036241075337 |
| 46 | SOIAICT | ICT as a topic in social interaction (WLE) | 0.036130216452 |
| 47 | ICTOUTSIDE | Subject-related ICT use outside of lessons (WLE) | 0.034710226041 |
| 48 | EFFORT1 | How much effort did you put into this test? | 0.033904814714 |
| 49 | PARED | Index highest parental education in years of schooling | 0.033390519681 |
| 50 | GLOBMIND | Global-mindedness (WLE) | 0.033142677476 |
| 51 | COMPETE | Competitiveness (WLE) | 0.032418503698 |
| 52 | ICTCLASS | Subject-related ICT use during lessons (WLE) | 0.032315217127 |
| 53 | REPEAT | Grade repetition | 0.031664088301 |
| 54 | MISCED_D | Mother's education—Alternate definition (ISCED) | 0.031087258262 |
| 55 | PERSPECT | Perspective-taking (WLE) | 0.030139209579 |
| 56 | HISCED_D | Highest education of parents (ISCED) | 0.029228546305 |
| 57 | PAREDINT | Index highest parental education (international years of schooling scale) | 0.029174175658 |
| 58 | ADAPTIVITY | Adaptation of instruction (WLE) | 0.028043667953 |
| 59 | INTCULT | Student's interest in learning about other cultures (WLE) | 0.027883918596 |
| 60 | FISCED_D | Father's education—alternate definition (ISCED) | 0.027065242520 |
| 61 | PERCOMP | Perception of competitiveness at school (WLE) | 0.026322638591 |
| 62 | TEACHSUP | Teacher support in test language lessons (WLE) | 0.025875187693 |
| 63 | DISCLIMA | Disciplinary climate in test-language lessons (WLE) | 0.025760908790 |
| 64 | MISCED | Mother's education (ISCED) | 0.025465822277 |
| 65 | DURECEC | Duration in early childhood education and care | 0.024900483638 |
| 66 | EMOSUPS | Parents’ emotional support (WLE) | 0.024620602155 |
| 67 | HISCED | Highest education of parents (ISCED) | 0.024620602155 |
| 68 | COGFLEX | Cognitive flexibility/adaptability (WLE) | 0.024553142517 |
| 69 | EUDMO | Eudaemonia: Meaning in life (WLE) | 0.024506295691 |
| 70 | FCFMLRTY | Familiarity with concepts of finance (Sum) | 0.024135260275 |
| 71 | INFOCAR | Information about careers (WLE) | 0.024115171843 |
| 72 | TEACHINT | Perceived teacher's interest (WLE) | 0.023118951014 |
| 73 | GFOFAIL | General fear of failure (WLE) | 0.022232099820 |
| 74 | ISCEDO | ISCED orientation | 0.022137720893 |
| 75 | FISCED | Father's education (ISCED) | 0.021511013845 |
| 76 | FLCONFIN | Confidence about financial matters (WLE) | 0.021370613160 |
| 77 | PERCOOP | Perception of cooperation at school (WLE) | 0.021293239750 |
| 78 | FLFAMILY | Parental involvement in matters of financial literacy (WLE) | 0.018708469291 |
| 79 | SWBP | Subjective well-being: Positive affect (WLE) | 0.017288920967 |
| 80 | INFOJOB2 | Information about the labour market provided outside of school (WLE) | 0.017213962729 |
| 81 | FLCONICT | Confidence about financial matters using digital devices (WLE) | 0.016952390610 |
| 82 | FLSCHOOL | Financial education in school lessons (WLE) | 0.015377520091 |
| 83 | LANGSCHMATES | Language spoken with their school mates for students who do not speak the test language at home | 0.014828724403 |
| 84 | LANGFRIEND | Language spoken with their best friend for students who do not speak the test language at home | 0.014138859678 |
| 85 | INFOJOB1 | Information about the labour market provided by the school (WLE) | 0.013960765986 |
| 86 | LANGSIBLINGS | Language spoken with their brother(s) and/or sister(s) for students who do not speak the test language at home | 0.012798065229 |
| 87 | LANGMOTHER | Language spoken with their mother for students who do not speak the test language at home | 0.011998892179 |
| 88 | LANGFATHER | Language spoken with their father for students who do not speak the test language at home | 0.010693657576 |
| 89 | PERFEED | Perceived feedback (WLE) | 0.010309013928 |
| 90 | CHANGE | Number of changes in educational biography (Sum) | 0.009090197733 |
| 91 | JOYREADP | Parents’ enjoyment of reading (WLE) | 0.008689155399 |
| 92 | GCAWAREP | Parents’ awareness of global issues (WLE) | 0.008444286892 |
| 93 | ISCEDL | ISCED level | 0.008405156100 |
| 94 | SCCHANGE | Number of school changes | 0.007972945309 |
| 95 | ST004D01T | Gender | 0.006389637760 |
| 96 | ISCEDD | ISCED designation | 0.005486783878 |
| 97 | PASCHPOL | School policies for parental involvement (WLE) | 0.005110396480 |
| 98 | CURSUPP | Current parental support for learning at home (WLE) | 0.004152939545 |
| 99 | ATTIMMP | Parents’ attitudes towards immigrants (WLE) | 0.003513754487 |
| 100 | PQSCHOOL | Parents’ perceived school quality (WLE) | 0.003240439638 |
| 101 | EMOSUPP | Parents’ emotional support (WLE) | 0.002278687828 |
| 102 | IMMIG | Index immigration status | 0.002274806757 |
| 103 | INTCULTP | Parents’ interest in learning about other cultures (WLE) | 0.001835338586 |
| 104 | SOCONPA | Social connections: Parents (WLE) | 0.000935000188 |
| 105 | AGE | Age | 0.000781715641 |
| 106 | STUBMI | Body mass index of student | 0.000762313214 |
| 107 | PRESUPP | Previous parental support for learning at home (WLE) | 0.000719721870 |
| 108 | BODYIMA | Body image (WLE) | 0.000414391539 |
Appendix B. Link of whole decision tree structure
Figure_3_SuppInfo.pdf