
Abstract
The ability to read and perform from notation is a fundamental skill in music performance. While for many musicians, staff notation is both transparent and flexible, a medium that can be used fluently and imaginatively, it is frequently experienced as complex and difficult – as a form of communication it is nobody’s first language. Stenberg and Cross showed that it is possible to make musical notation easier to read at sight; adding white spaces to simple two-part pieces led to improved sight-reading performance compared with conventional staff notation. Separating units of music visually may assist a performer to process a written score, a finding that parallels the results of research into the effects of interword separation in linguistic text, where this has been found to help readers identify word boundaries and process written information, particularly when reading in a second language. The present study extends these findings, using a selection of piano pieces varying in complexity in an adaptive paradigm. Twenty-five pianists with a range of levels of expertise in sight-reading performed at sight from both conventional staff notation and notation that had been modified by adding white spaces to denote musical groups; performances were coded for pitch, rhythm, and meter errors. Results suggest that the modified staff notation reduces error counts by around 19% when performers are nearing the threshold of their sight-reading ability, with a strong correlation between the difficulty of the task and the effect of the added visual cues.
Music notation today
Music notation is in everyday use across the globe. Millions of people worldwide are able at least to decipher it as they learn to sing or to play instruments, while many musicians use notation fluently during performance, composition, teaching and research. At the same time, it is often experienced as complex and difficult. Staff notation as we use it today took shape in the 17th century as the reflection of a broad historical span of musical styles and forms in Western Europe; it has remained largely the same irrespective of the multiple purposes it is now called on to fulfil. The contexts within which musical notation are employed impose different demands: for elementary learning, symbols are required to be unambiguous in their meaning; in composition, symbols and their relations must be capable of communicating a composer’s ideas without requiring their presence; in concert performance, scores should be easy to grasp with limited rehearsal time, their form and structure clearly comprehensible. Although staff notation is not optimal for any one particular context, it has proved to be an incredibly durable system, capable of being repurposed for a variety of uses, its flexibility and efficiency stemming from an ability to convey a large amount of information with minimal visual representation.
Modifying a long-established system
From its inception, there have been many attempts to modify or reform staff notation (Read, 1987; Silpayamanant, 2017). Almost all have been driven by ideas about how musical notation should represent sounds, with common appeals being made towards intuition, simplicity, rationality, perception and universality. Almost all have failed to have any significant or lasting impact on contemporary notational forms. Attempts to modify music notation face a high barrier to entry; inevitably even changes to music notation that might be well motivated will run up against the huge investment in conventional staff notation put in by current learners, teachers, performers, composers and publishers. The present paper takes a pragmatic stance in respect of a specific context, sight-reading; it explores whether it is possible to make musical notation easier to read at first sight by introducing minimal changes in design while retaining its overall appearance. The experiment presented here focuses on sight-reading (performing from music notation at sight without rehearsal, aiming for fluent and accurate execution) for two reasons; this activity is considered critical for professional performers and it has been the focus of extensive empirical and theoretical work (see, for example, Fan et al., 2022; Kopiez & In Lee, 2008; Lehmann & Kopiez, 2016; Mishra, 2014).
Sight-reading in professional practice
Sight-reading has been a valued ability for musicians in Western musical cultures for many centuries (see, for example, Wood, 2001) and an important component of formal Western musical training for some 200 years since its introduction into the syllabi of major conservatoires (including the Paris Conservatoire, the Conservatoire royale de Bruxelles, the Royal Academy of Music, etc.) from the early 19th century. It is now an established element of the examination schemes of most of the major music performance assessment bodies, such as the Associated Board of the Royal Schools of Music (ABRSM), and is regarded as a vital capacity in a broad range of musical situations and contexts, including accompanying, choral singing, orchestral performance and playing in recording sessions. In ensemble contexts one principal factor that puts a high premium on sight-reading ability is economic; time for rehearsal is often limited, time in a recording studio large enough to accommodate an orchestra is expensive, and the ability to sight-read at a high level is simply cost-effective (Carlson, 2019; Gorski, 2022; Small, 1987). For pianists who specialise in accompaniment, a high level of sight-reading expertise is required by the nature of the musical activities in which they are involved; they must accommodate to a wide range of repertoires and levels of musical complexity while adapting to the demands of fitting with a range of different instruments or voices, and the evidence suggests that they have to develop their sight-reading skills to a significantly higher level than do those who specialise in solo performance (Lehmann & Ericsson, 1993, 1996). While economic pressures may be a primary factor driving musicians’ acquisition of sight-reading expertise, now that the capacity has become widespread it has developed into a culturally-valued practice, particularly in the United Kingdom. As Ehrlich et al. (2001) note, the London orchestras of the early 20th century offered at best precarious and insecure employment. The quicker a musician could assimilate what was required of them musically the more likely they were to gain employment, hence ‘At symphony concerts a London tradition of inspired sight-reading became deeply entrenched, even a source of pride, with conductors learning to cope’.
Visual processes involved in reading music notation
Our research on sight-reading draws on studies of reading linguistic text that shows that visual segregation of meaning units (words, sentences) by means of spaces enhances their perceptual grouping and hence readability (Rayner, 2009b). How we perceive both linguistic and musical symbols is a multifaceted process, involving visual and cognitive processes. The uptake of visual information is constrained by eye movements in the form of sequences of saccades (rapid eye movements) and fixations, during which information is obtained (Rayner, 2009a). In language reading it is clear that fixations become longer as difficulty increases (Rayner et al., 1998). Eye movements in music reading have been shown to be similar to those observed in text reading, despite the need to maintain a constant tempo in music performance. Skilled music readers tend to exhibit a greater number of future-oriented fixations and a higher frequency of shorter retrogressive saccades (when the eyes move backward to re-read a portion of the notation), while unskilled readers have a general tendency towards longer fixations and saccades (Goolsby, 1994). Other studies support these findings (see, for example, Gilman & Underwood, 2003; Lim et al., 2019; Penttinen et al., 2015), suggesting that skilled readers have efficient search strategies that enable visual integration of information ahead of the point of performance, without the need to revisit and reanalyse previously processed information. These strategies can be understood as involving efficient use of the ‘eye-hand span’ (Sloboda, 1974)—the interval between the note being fixated upon and that being performed. It has been suggested that this interval is on average around 1s in length; while this varies widely between performers and within individual performances (Puurtinen, 2018) it tends to be longer with increased expertise. The eye-hand span is related to the perceptual span, which is understood as the temporal span over which the performer is processing visual information (Truitt et al., 1997); again, perceptual span has been shown to increase with music reading expertise (Waters et al., 1998)
Cognitive processes involved in reading music notation
A substantial literature exists exploring the similarities and differences between the cognitive mechanisms underpinning language and music reading (see, for example, Bouhali et al., 2020; Fennell et al., 2021; Stewart, 2005). Beyond the shared connection of being visual and symbolic representations, linguistic and musical notations are both combinatorial structures (i.e., a finite set of meaningless symbols can be recombined in numerous ways to produce an infinite variety of meaningful expressions). Research has shown that in music reading and language reading alike, grouping and structural perception play an important role in understanding the organisation and flow of visual notations; rather than note-by-note or letter-by-letter reading strategies, readers pick up ‘chunks’ of information (Cowan, 2001). In language reading, chunking involves grouping letters into units such as words or sentences; in music reading, notation is chunked in reference to its structural, melodic and temporal qualities (Halpern & Bower, 1982). Chunking relies on the interplay of long-term, short-term, and working memory. The short-term memory system maintains chunks of visual information for initial processing; working memory integrates these into meaningful structures on the basis of linguistic, musical, motoric and contextual knowledge derived from long-term memory (see, for example, Baddeley, 2010; Ericsson & Kintsch, 1995; Miller et al., 2018; Smith et al., 1973). Chunking processes have been demonstrated to reduce cognitive load and enhance the ability to process information quickly and accurately (Thalmann et al., 2019) and may vary according to expertise (Sheridan et al., 2020).
Visual cues and meaning units
Linguistics research has shown that structured insertions of white spaces, delineating chunks, can improve the readability of text, particularly in alphabetic languages; when these interword spaces are removed, there is a substantial decrease in reading rate because there is a decline in the number of cues as to word boundaries and length (see, for example, Huang et al., 2024; Lloyd & McKelvie, 1992; Rayner et al., 1998; Sheridan et al., 2016; Slattery & Rayner, 2013; Spragins et al., 1976). To illustrate: the following words may take you longer to read and feel difficult to comprehend, as meaning not only has to be extracted from the string of symbols but the symbols must also be grouped into sequences that convey meaning and those sequences separated one from another. Research also demonstrates that during the reading of unsegmented text, infrequently used words cause larger delays in reading rate (Sheridan et al., 2016). This indicates that spacing directly impacts the early stages of text recognition and encoding.
While fluency in reading linguistic text has been shown to be influenced by whether or not a text incorporates cues that facilitate chunking, Stenberg (2019) and Stenberg and Cross (2019) showed similar findings when performing music from notation; adding vertical white spaces led to an improvement in accuracy and fluency when musical scores were performed at sight. While those preliminary experiments used simple two-part arrangements of Bach chorales, the research presented here used real piano pieces, which had been constructed so as to present graded degrees of sight-reading difficulty. Pianists with a broad range of sight-reading ability performed the music from conventional and modified forms (the modification being the introduction of vertical white spaces to separate musical groups); their errors were then coded and analysed. The aim was to provide information on the effects of the score modifications at different levels of challenge, while at the same time, investigating whether an enhancement of functionality was dependent on a particular level of musical and performing expertise (as this has been shown to be one of the principal factors determining sight-reading performance: Waters et al., 1998).
By analogy with linguistic text, white spaces were introduced to separate sequences of musical events that could be interpreted as ‘meaning units’ or integral groups, their positioning being guided by the application of the grouping principles of Lerdahl and Jackendoff (1983, Ch2 et passim). At their simplest, these principles suggest that a large difference in a parameter such as pitch or duration between successive events is a good candidate for the formation of a boundary between groups; more complex instances are likely to involve consideration of elements such as harmonic structure and articulation in deciding which events should be allocated to which group. White spaces thus generally delineated sets of musical events that could be intuitively characterised as themes, phrases or sub-phrases, but choice of specific positioning was on occasion influenced by music typesetting considerations (e.g., white spaces were not added if they would have coincided with the ends of systems, where they would have been redundant).
Methodology
Piece selection
Thirteen pieces were taken from a graded collection of specimen piano sight-reading tests, published by the ABRSM in 1995, with an additional three taken from an older ABRSM collection, published in 1965. As both series of books are long out of print and unavailable for purchase, we could be certain that, while the stylistic idioms would be familiar, the participants were unlikely to have seen the pieces before. All pieces were under 20 bars long and were written for the purposes of testing sight-reading at defined ability levels, making them highly suitable as materials for our experiment. The experiment materials follow the same grading as in the published collections (ABRSM Grade 4 = our Grade 4), except for three pieces in our Grade 6, where there was a lack of suitable pieces in the 1995 collection. In this grade, the additional pieces are taken from ABRSM’s 1965 Grade 5 sight-reading book – the level of challenge being comparable to the higher grade in the latter collection. In practice, levels of difficulty did not appear to be categorically distinct between one grade and the next higher, although the overall progression from lowest to highest manifested a clear overall increase in difficulty.
Levelling and pairing pieces
Within each level, two pairs of pieces of equivalent style, tempo and level of challenge were selected, giving 16 total pieces. Within the pairs, the tempo and metre are identical, and the length, texture and other features of the music are as similar as possible. For ecological validity, pieces were not edited to make them more similar (exactly matching the total number of bars, onsets and articulations/expressions, etc.). Previous experiments have found that despite such efforts it is near impossible to generate matching error profiles precisely, even where the music is much less complex (Stenberg & Cross, 2019). Differences in resulting error counts were accounted for when modelling the data by treating ‘piece’ as a random effect within a mixed-effects model.
Presentation of materials
All pieces were presented as printed A4 scores, on high grammage paper so they would sit securely on the piano stand and remain free of damage throughout the experiment. The music was typeset by the first author, an experienced music engraver, using Sibelius Ultimate. The staff size (6.5 mm) and page margins (top: 27 mm, sides: 18 mm, bottom: 30 mm) are consistent across all scores with four or five systems of music; shorter pieces, those with only two or three systems of music, include higher bottom margins (an additional 160 and 100 mm, respectively). The notation closely follows that of the source publications, with the primary differences being the removal of any fingering indications and the replacement of tempo words with a fixed metronome mark. In some pieces the layout has been altered so the note spacing is less crowded than in the original publications, where multiple pieces are often included within a single page. Certain other minor elements were modified to follow modern engraving practice (e.g., not repeating an accidental where a note is tied over a system break).
Score modifications
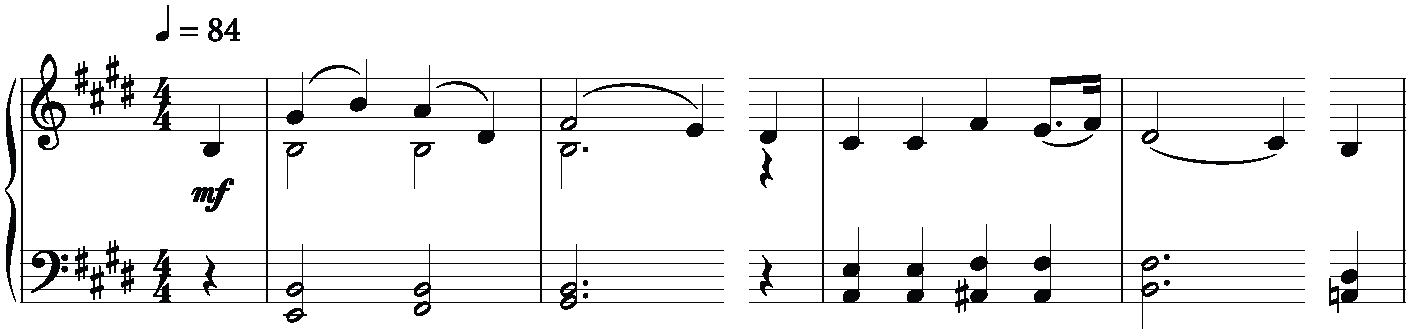
Pilot studies enabled us to refine the size and positioning of white spaces in the present study as well as informing the choice of range of materials that were employed. The modified scores include white spaces, 3.25 mm wide (half of the 6.5 mm staff width), separating meaning units, as described in the introduction. This width was chosen to provide a balance between maintaining the original note spacing (avoiding adjustments having to be made to accommodate the addition of the white space) and the space not being so narrow as to be distracting (thinner spaces were felt to have a ‘dazzling’ effect in pilot testing). Where a white space coincides with a barline, the space is positioned flush with the left-hand edge of the line and at least 0.81 mm (one eighth of the staff width) from the right-hand edge of any preceding notational element. Where a white space is added mid bar, it is usually positioned 1.63 mm (a quarter of the staff width) away from a subsequent notehead and 0.81 mm from a subsequent rest. Where note spacing was tight, the margin before a notehead was reduced (down to a minimum of 0.81 mm). All white spaces are aligned between the treble and bass clef staffs, that is, the space cuts through the entire system (see Figure 1 for an example and Supplementary Information for all scores). The layout and note spacing of the conventional and modified versions are identical (the only difference being the added white spaces), except for the following instances, where minor adjustments were made to accommodate the white spaces:
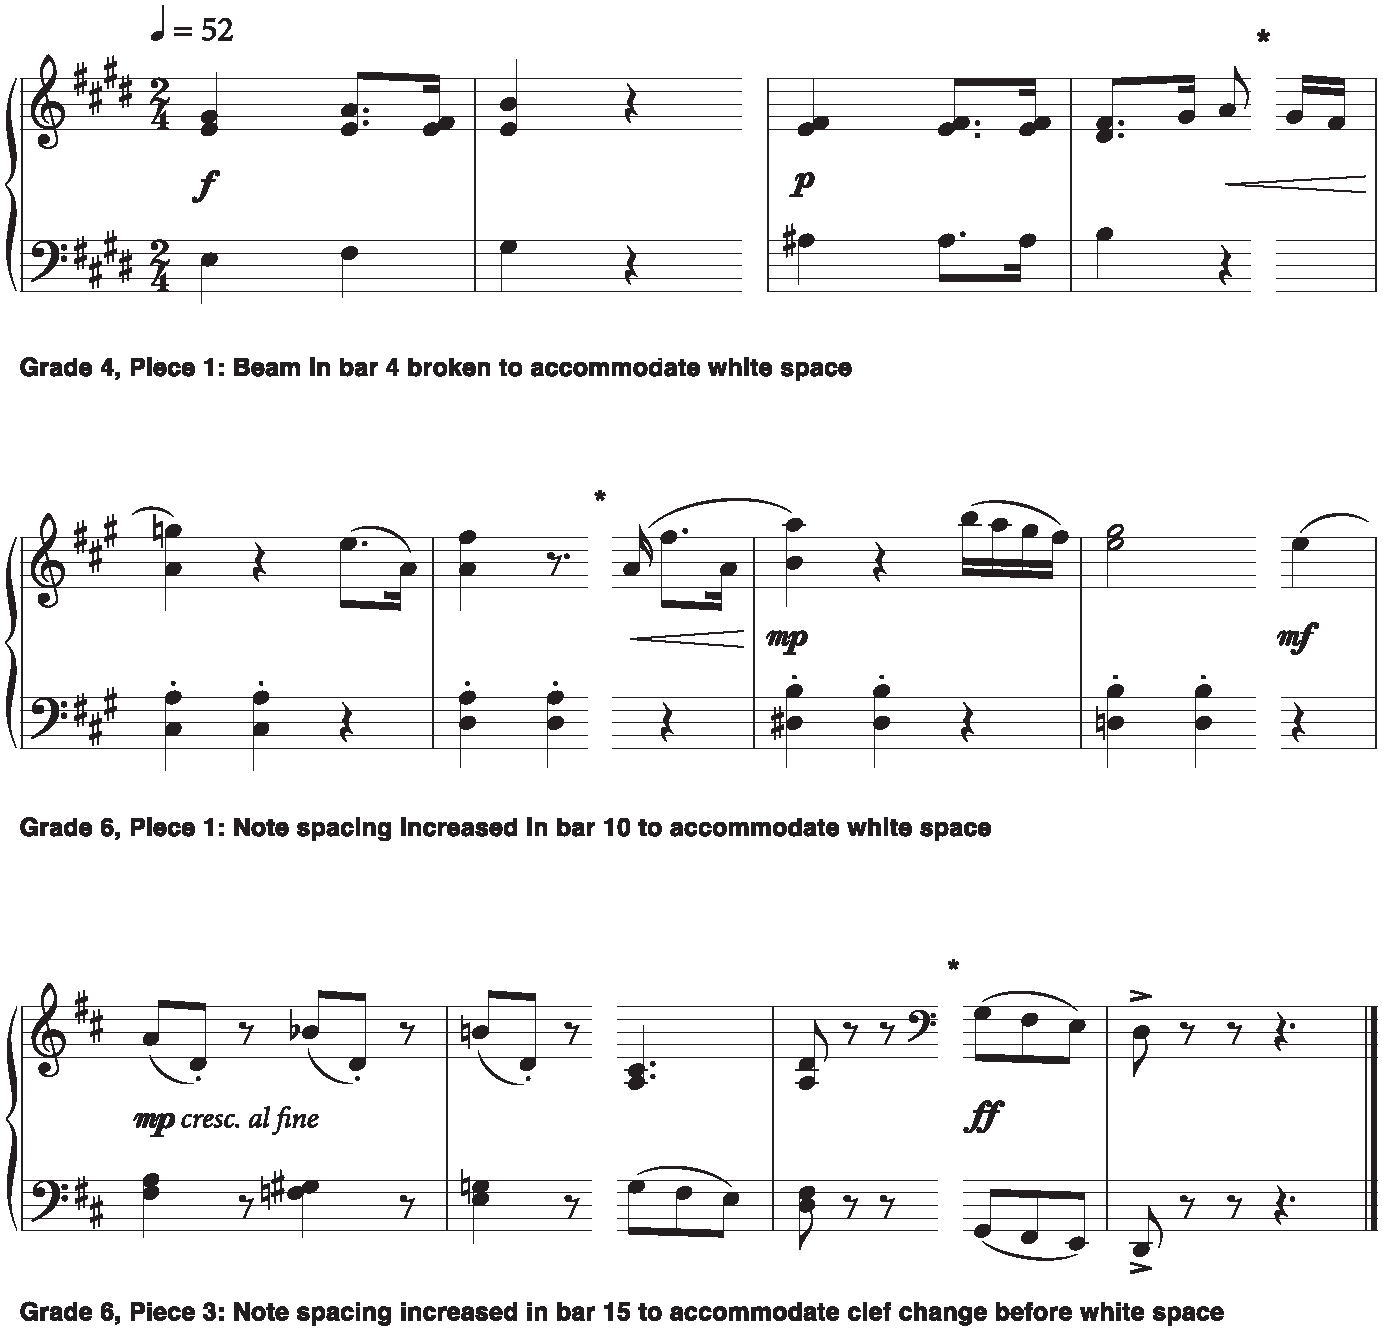
When a white space occurs within a beam group (Grade 4, Piece 1, bar 4, etc.)—the beam group is broken up in the modified score.
Where there is not sufficient space to include a white space while keeping to the minimum margins specified above (Grade 6, Piece 1, bar 10, etc.)—the note spacing has been widened slightly to accommodate the white spaces.
Where there are notational elements such as clef changes, which would occur within the white space (Grade 6, Piece 4, bar 15)—the note spacing has been widened so the symbol can be accommodated before the white space.
These examples are shown in Figure 2 (places in the modified scores where adjustments were necessary are highlighted with an asterisk above the notation).
Modified notation.
Adjustments made to accommodate white spaces.
Instrument and equipment
A Yamaha Model C7 grand piano was used for the experiment. Participants were able to try out the piano prior to the start of the experiment if desired. Audio and video of the performances were captured using two cameras (a Canon Legria HFG-50 and a Canon Legria HFG-40) positioned on either side of the keyboard so the participants’ hands could be clearly seen in all registers when coding the recorded performances for errors (neither the scores nor the participants’ faces were visible in the recording frame).
Experiment design
In a series of pilot studies, we explored a range of paradigms and possible variables that we felt might bear on sight-reading performance. These included tempo, placement of white spaces and level of musical complexity. We anticipated that the participants to whom we had access, students at the University of Cambridge studying music, would have some degree of sight-reading expertise but this was likely to vary. In the event, pilot studies showed that this variability was in excess of what we had anticipated; while all participants were certainly able to sight-read, some who were expert performers on instruments other than the piano were unable to sight-read music of even moderate complexity on that instrument, while others made virtually no errors across the range of pieces we employed. The results of these studies showed that tempo had to be set prior to each experimental trial in order to ensure that all participants were experiencing the same level of technical difficulty, white spaces had to be placed across both staff systems rather than offset between them to enable clear assessment of any effect, and levels of musical complexity had to be expanded, ranging from early intermediate to advanced pieces to accommodate the range of expertise we encountered. This led us to the adaptive strategy that we used in the experiment.
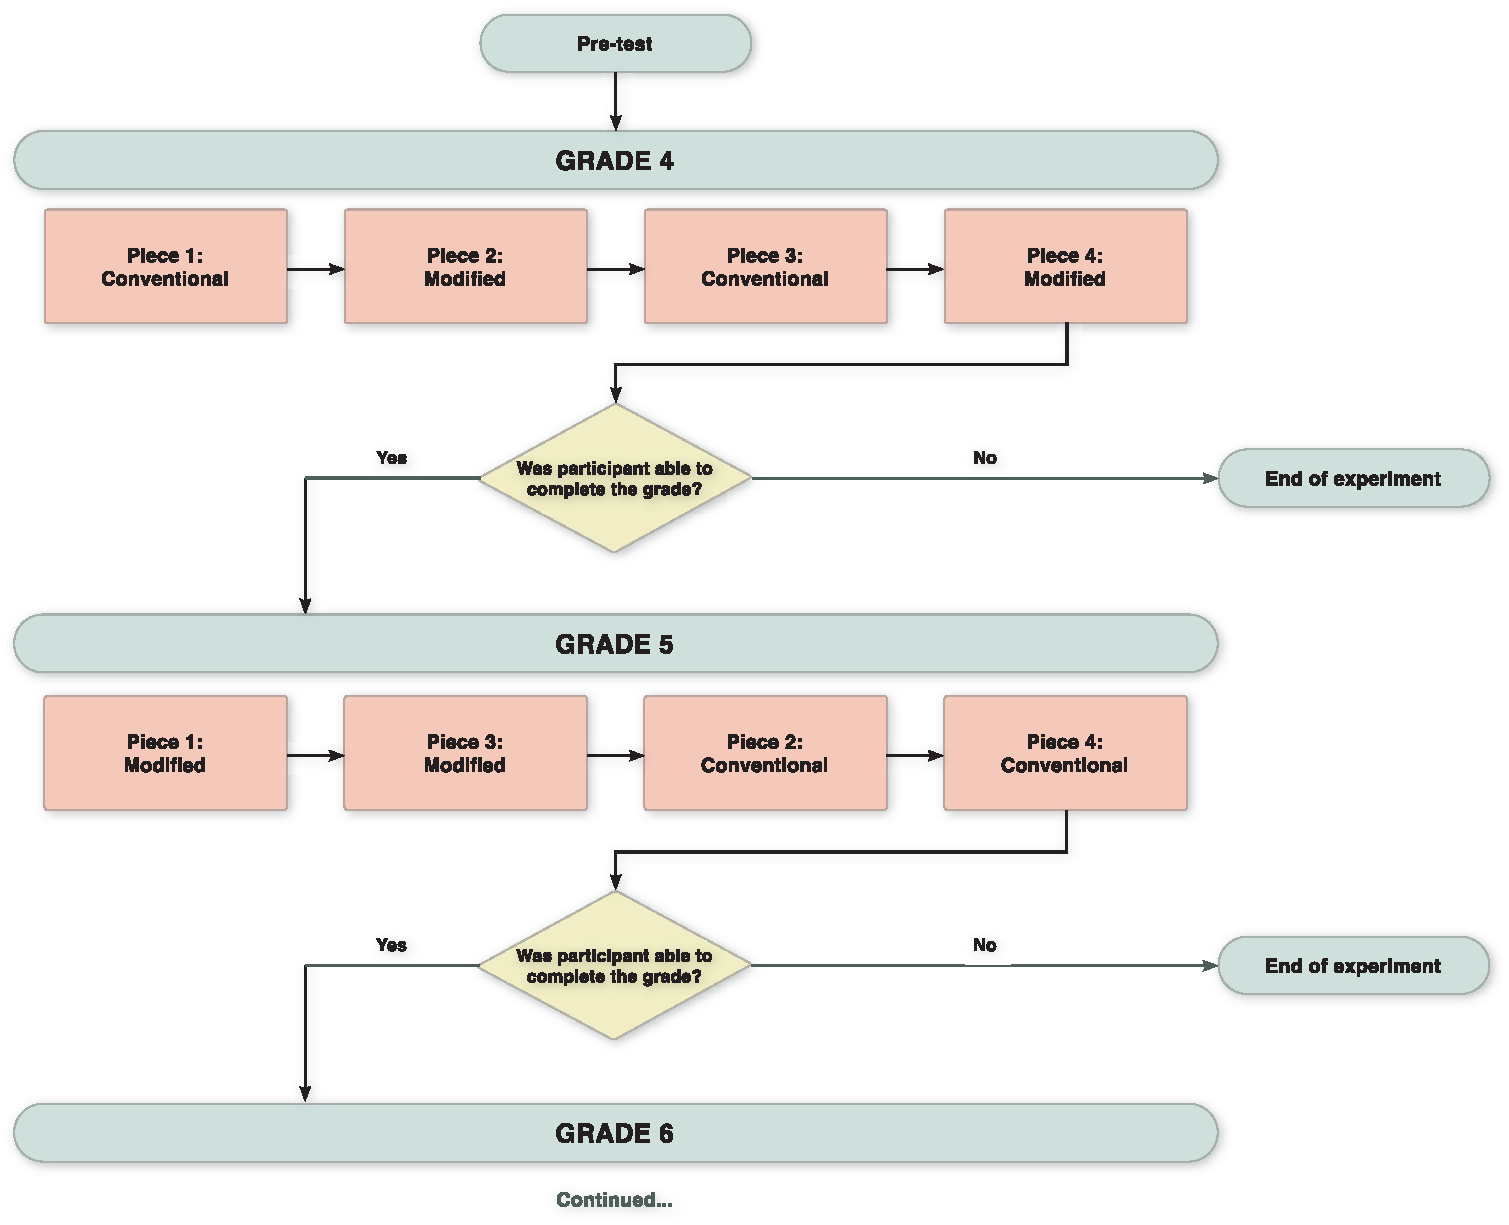
The experiment was thus designed to capture performances from pianists up to the threshold of their sight-reading ability. To obtain equivalent readings from a mixed-ability group while controlling for tempo (i.e., all tests are given at set speeds, rather than increasing the tempo for proficient sight-readers), the experiment was designed as a staircase with four difficulty levels. All participants performed, at sight, the four Grade 4 pieces, two which were presented in conventional staff notation, the other two modified by the addition of white spaces. If the participant was able to sight-read these successfully (i.e., the experimenter judged that the performances could be accurately coded for errors), they were presented with the four Grade 5 pieces, two of which were conventionally notated and two of which were modified. This process continued until the participant was unable to successfully complete a level or they had performed all the pieces in the experiment (final level = Grade 7). The order of pieces and which version of each piece they performed were counterbalanced within each grade (see Figure 3 for an example of a participant’s journey through the experiment). Prior to the experiment beginning, all participants undertook a pre-test in which they performed a short Grade 4 sight-reading piece in conventional notation, to familiarise them with the procedure that would be used within the experiment.
Experiment flowchart.
Procedure
Before undertaking the sight-reading task, participants were given a written overview of the experiment structure, then asked to fill in a short questionnaire about their demographic information and musical experience. Once seated at the piano, the participant was informed again as to how the experiment would be conducted:
They would be handed the four pieces for the first level, with the pages turned around so the notation was not visible.
The cameras would be turned on to record.
When ready, they would turn the first page around to reveal the score.
The experimenter would immediately start a metronome running at the tempo given on the score.
After a 2 bar metronome count-in, participants would begin the piece, attempting to maintain that tempo throughout (the metronome would be turned off after 1–2 bars).
At the end of the piece, they would turn the page around, and when ready, turn over the next piece to perform, following the same procedure for the remaining pieces in the grade.
The metronome was used to standardise tempo across performances in order to achieve parity across participants in terms of task demand and also to ensure that the conditions of the experiment achieved a high degree of ecological validity (in a professional sight-reading context tempo would generally not be set solely by the performer). Many previous sight-reading experiments have failed to fully control for tempo, meaning that poorer sight-readers could simply perform the tasks at a slower tempo (Puurtinen, 2018). Participants were asked to treat these like live performances and not to stop or go back to correct any mistakes. The entire session lasted between 10 and 20 min, depending on how many levels the participant completed.
Participants
Twenty-five pianists took part in the experiment (16 male, 8 female, 1 rather not say), aged between 18 and 32 (M = 22.1, SD = 3.78). Eighteen were undergraduates at the University of Cambridge, six were postgraduates and one was employed as a librarian at the university. Despite requiring only Grade 5 sight-reading in the call for participants, the group was generally of a considerably higher ability. Fourteen participants self-reported a diploma-level performing ability or above on the piano; eight were around Grade 8 and only three reported being below that level. Nearly all had been playing the piano from a young age, with 20 participants reporting over 11 years’ experience; only one had been playing the piano for under 5 years. All participants reported normal or corrected-to-normal vision, and none reported any hearing impairments. One participant reported that they had attention deficit hyperactivity disorder (ADHD), but their results were in line with the rest of the sample. Results from three participants had to be discounted as one or all of their performances at the first level contained too many errors to accurately count.
Error coding
All videos were marked blind; neither the performer’s identity, nor the version being performed from (conventional or modified), were known during the marking process. Pitch, rhythm and metre errors were counted separately, then summed to give a total error count for each performance. One pitch error was recorded for playing a note that differed from that written on the score or adding/omitting a note. One rhythm error was recorded for a deviation from the written rhythm, which did not affect the underlying metrical structure (e.g., two straight quavers played as dotted quaver – semiquaver). A metre error was defined as a noticeable disruption to the metrical structure, for example, a bar of 4/4 was elongated to a bar of 5/4. All metre errors were also recorded as rhythm errors, as no disruption to the metrical structure could occur without being caused by a disruption to the surface rhythm. Only one metrical error per bar was recorded as this was taken to constitute the maximal level of disruption. For a more comprehensive account of the error coding process see Supplementary Information: Error coding guide.
Compound errors
In practice, a single mistake can occur across multiple domains – a wrong note, followed by a hesitation, then a correction to the written note would be recorded as one pitch error, one rhythm error (for adding an additional onset) and one metre error (as the duration of the bar was elongated). Coding errors in real pieces of music also involves an element of subjectivity, for example, if an entire arpeggiated figure is offset by one quaver, but is otherwise correct, should that be recorded as a single rhythm error, multiple rhythm errors, or both multiple rhythm and pitch errors? To ensure consistency, we added examples from our pilot experiments to the error coding guide, which served as a reference when uncertain about how many errors to record (see Supplementary Information). Two markers each assessed half of the participants, while a third marker independently coded a selection of these. The error counts were highly correlated (ICC = 0.91 between Marker 1 and Marker 3; ICC = 0.82 between Marker 2 and Marker 3), indicating strong agreement. Discrepant incidences were resolved collaboratively, and new examples were added to the guide for future use.
Ethical approval
The experiment was approved by the University of Cambridge Faculty of Music’s Research Ethics Committee. All participants provided written consent for their data and video recordings to be stored and used within scientific publications and presentations, and for these to be made available anonymously for other researchers, both inside and outside the Faculty of Music. Participation was voluntary, with performers being recruited via email calls to students at the University of Cambridge; the only pre-requisite was a sight-reading level of ABRSM Grade 5 (or equivalent). Participants were informed that they could withdraw at any time and at the end of each successful grade they were asked whether they would like to continue to the next level up. All participants received £10 upon completion of the experiment, regardless of how many levels they successfully completed.
Results
General observations
Of the 25 participants:
15 successfully completed all four difficulty levels (each playing all 16 pieces).
1 completed three levels (12 pieces).
1 completed two levels (8 pieces).
5 completed only the first level (4 pieces).
3 were discounted as their performances at the first level could not be accurately coded for errors.
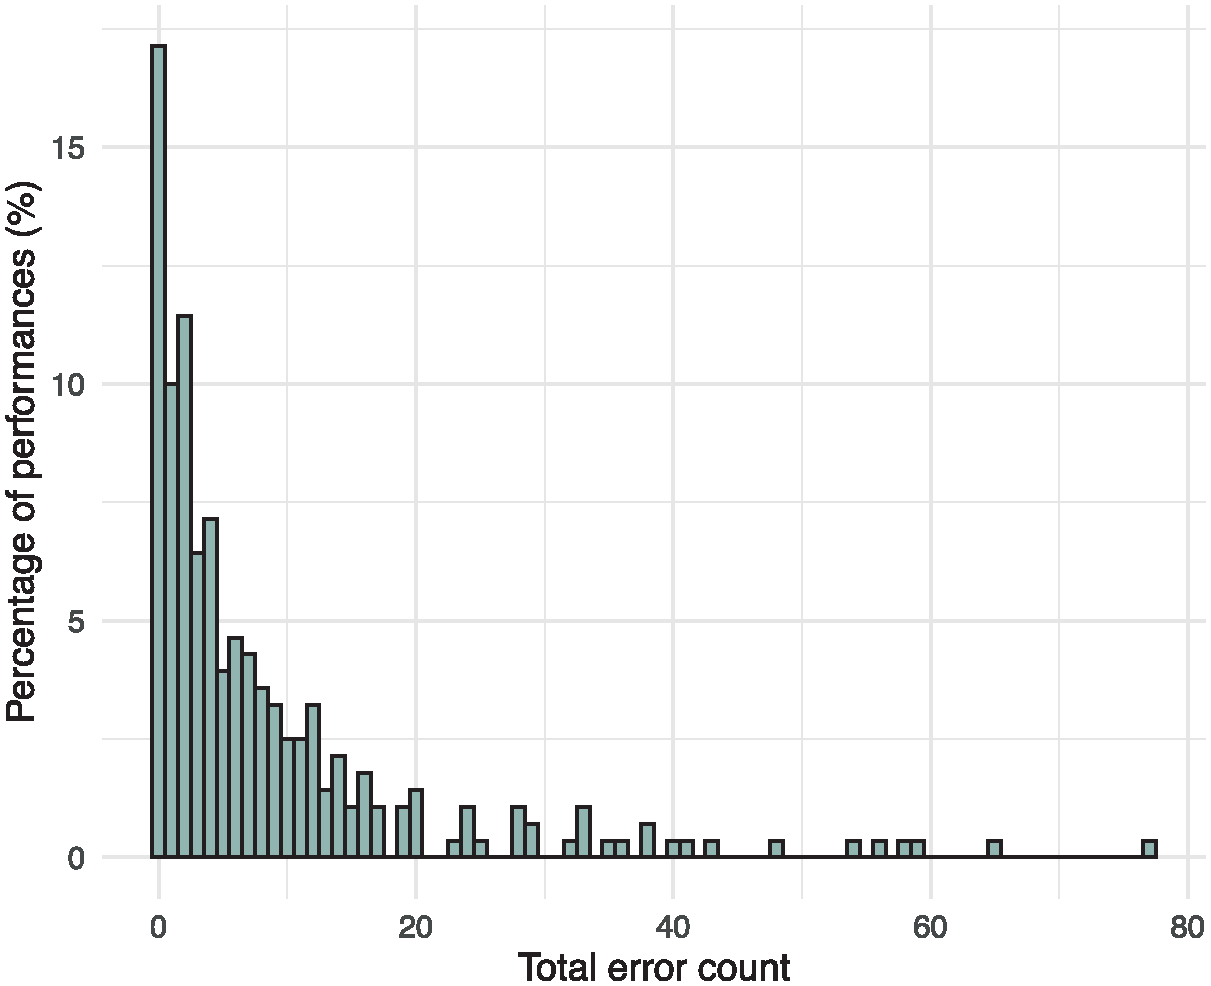
The overall data set was highly right-skewed (skewness = 2.65), with a heavy tail (kurtosis = 8.24), as many of the top sight-readers made zero or very few errors in the easiest pieces (see Figure 4).
Histogram of total error counts.
In the subsequent analyses, only results from participants performing at an equivalent level of challenge are included. As the levels of difficulty within the experiment were not clearly and categorically distinct between one grade and the next higher, results from the top two levels completed by each participant are included where possible, rather than just their final level. This resulted in 156 performances from 22 participants (17 × 8 pieces, 5 × 4 pieces (the five who only completed one level)), where each participant was nearing the threshold of their ability. Four participants were not challenged by any of the tests and made very few errors in total across the final eight pieces (error counts = 9, 23, 28, and 28, respectively). As these were significantly lower than the next best sight-reader (47 errors), a subset of the final-levels group was also analysed, excluding the top sight-readers (124 performances from 18 participants (13 × 8 pieces, 5 × 4 pieces)).
Summary statistics
Table 1 shows the average error count within participants’ final levels, when performing from conventional and modified notation. Given the skewed data, median error counts and interquartile ranges (IQR) are reported as measures of central tendency and variability.
Average error counts in participants’ final levels, including all participants and excluding the four top sight-readers.
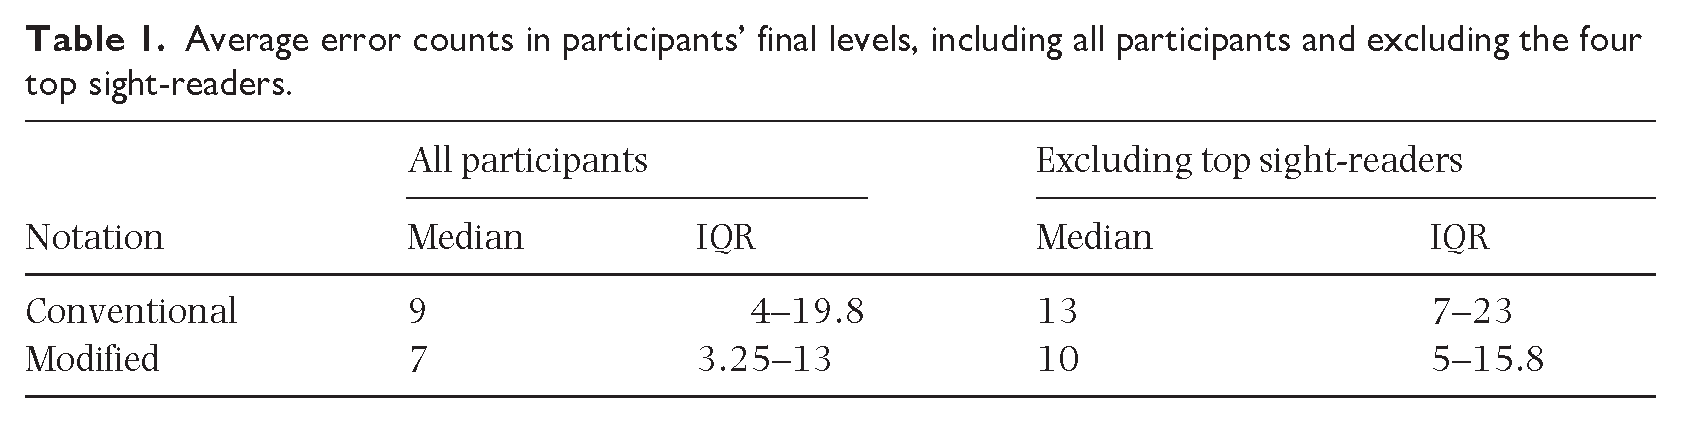
For the complete sample, median error counts were lower with modified notation (7, IQR: 3.25–13) than with conventional notation (9, IQR: 4–19.8). Noticeably, the change in the IQR reveals that the 75th percentile decreased significantly more than the 25th percentile (34% vs 19%), indicating that the modified notation is benefitting performers with high error counts (those who were nearer the threshold of their sight-reading ability). Excluding the four top sight-readers, there was a slightly larger reduction in median error counts under modified notation (10, IQR: 5–15.8) compared with conventional notation (13, IQR: 7–23). This data is plotted in Figure 5.
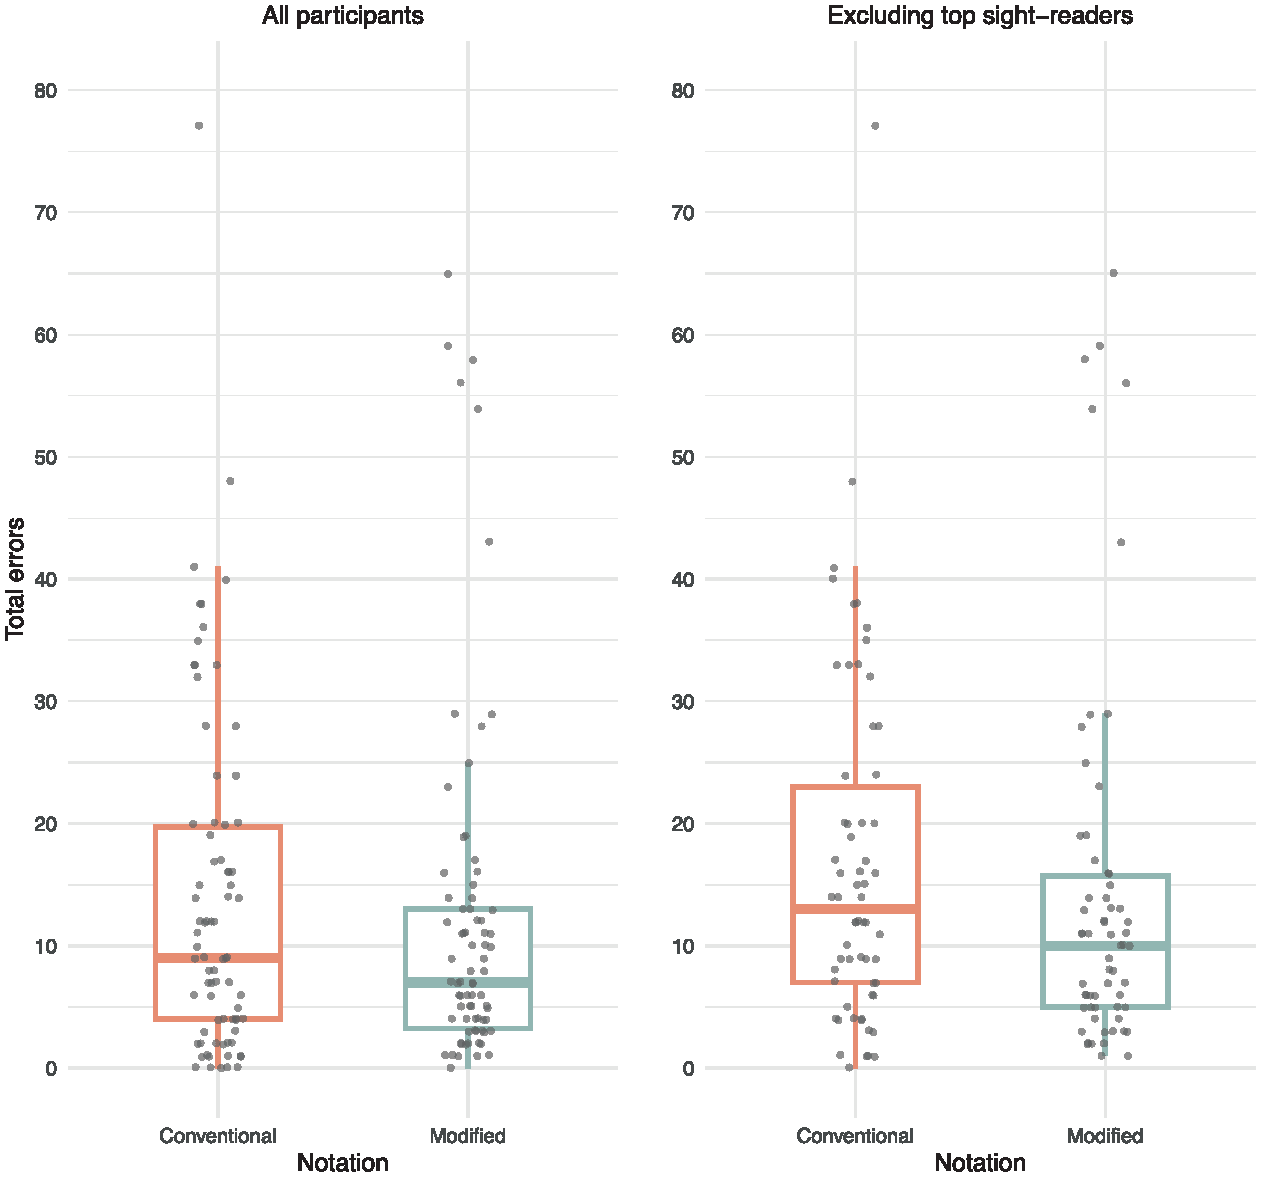
Error counts in participants’ final levels, including all participants and excluding the four top sight-readers. Whiskers extend to the smallest and largest values within 1.5 × IQR from the first and third quartiles, respectively. Individual data points are plotted with a degree of jitter to reduce overlap and improve visibility.
Types of errors
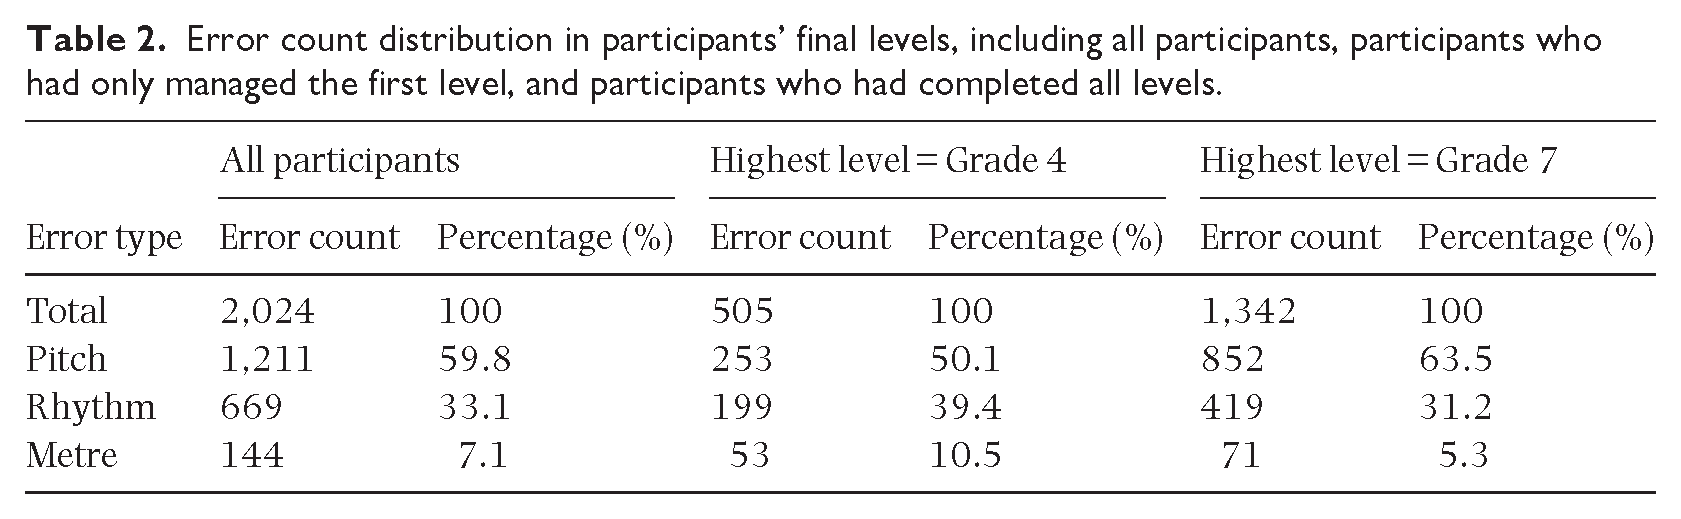
Within participants’ final levels, pitch errors made up approximately 60% of the total error count, rhythm errors 33% and metre errors 7%, however, the distribution of error types was significantly different at different ability levels (see Table 2). The least proficient sight-readers made many more rhythmic errors than the top performers and almost double the proportion of metrical errors, reflecting the fact that they were more likely to hesitate or try to correct an error, despite being instructed not to.
Error count distribution in participants’ final levels, including all participants, participants who had only managed the first level, and participants who had completed all levels.
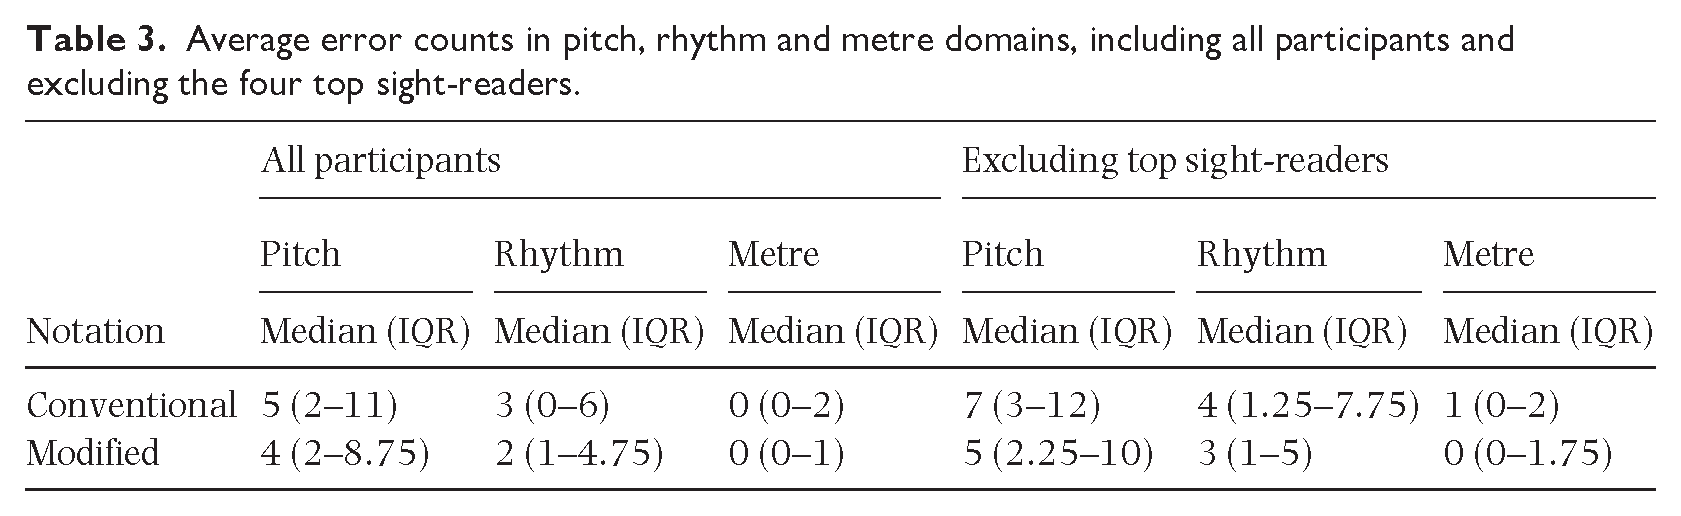
Reductions in average error counts from conventional to modified notation were seen within each domain (see Table 3).
Average error counts in pitch, rhythm and metre domains, including all participants and excluding the four top sight-readers.
Modelling the data
While limiting our analyses to the final levels read by each participant reduced the skew of our data, the error counts were still overdispersed (the variance exceeds the mean). As such, we modelled the data with a negative binomial regression using R Statistical Software (v.4.4.0; R Core Team, 2024) using the glmmTMB package (Brooks et al., 2017). The negative binomial distribution includes an extra parameter to model the overdispersion, reducing the likelihood of detecting false positives from assuming a standard Poisson distribution (Campbell, 2021). The model uses a log link function, meaning the coefficients represent the logarithm of the expected count of errors.
Final-levels model
We compared the output of two models for participants’ final levels (see Table 4). Model 1a includes random intercepts for participant (allowing for different baseline error counts for each participant), piece (allowing for variation in piece difficulty) and order (to account for potential effects arising from the sequence in which the pieces were played). Model 1b also includes random slopes for the effect of the modified notation on both participant and on piece, that is, whether the effect of the modified notation varies by participant or by piece. The random intercepts model demonstrates a superior fit (AIC = 1,042.5, BIC = 1,060.8) compared with the random slopes model (AIC = 1,048.6, BIC = 1,079.1), so is prioritised as providing a better balance between complexity and goodness of fit.
Outputs of Model 1a and Model 1b.
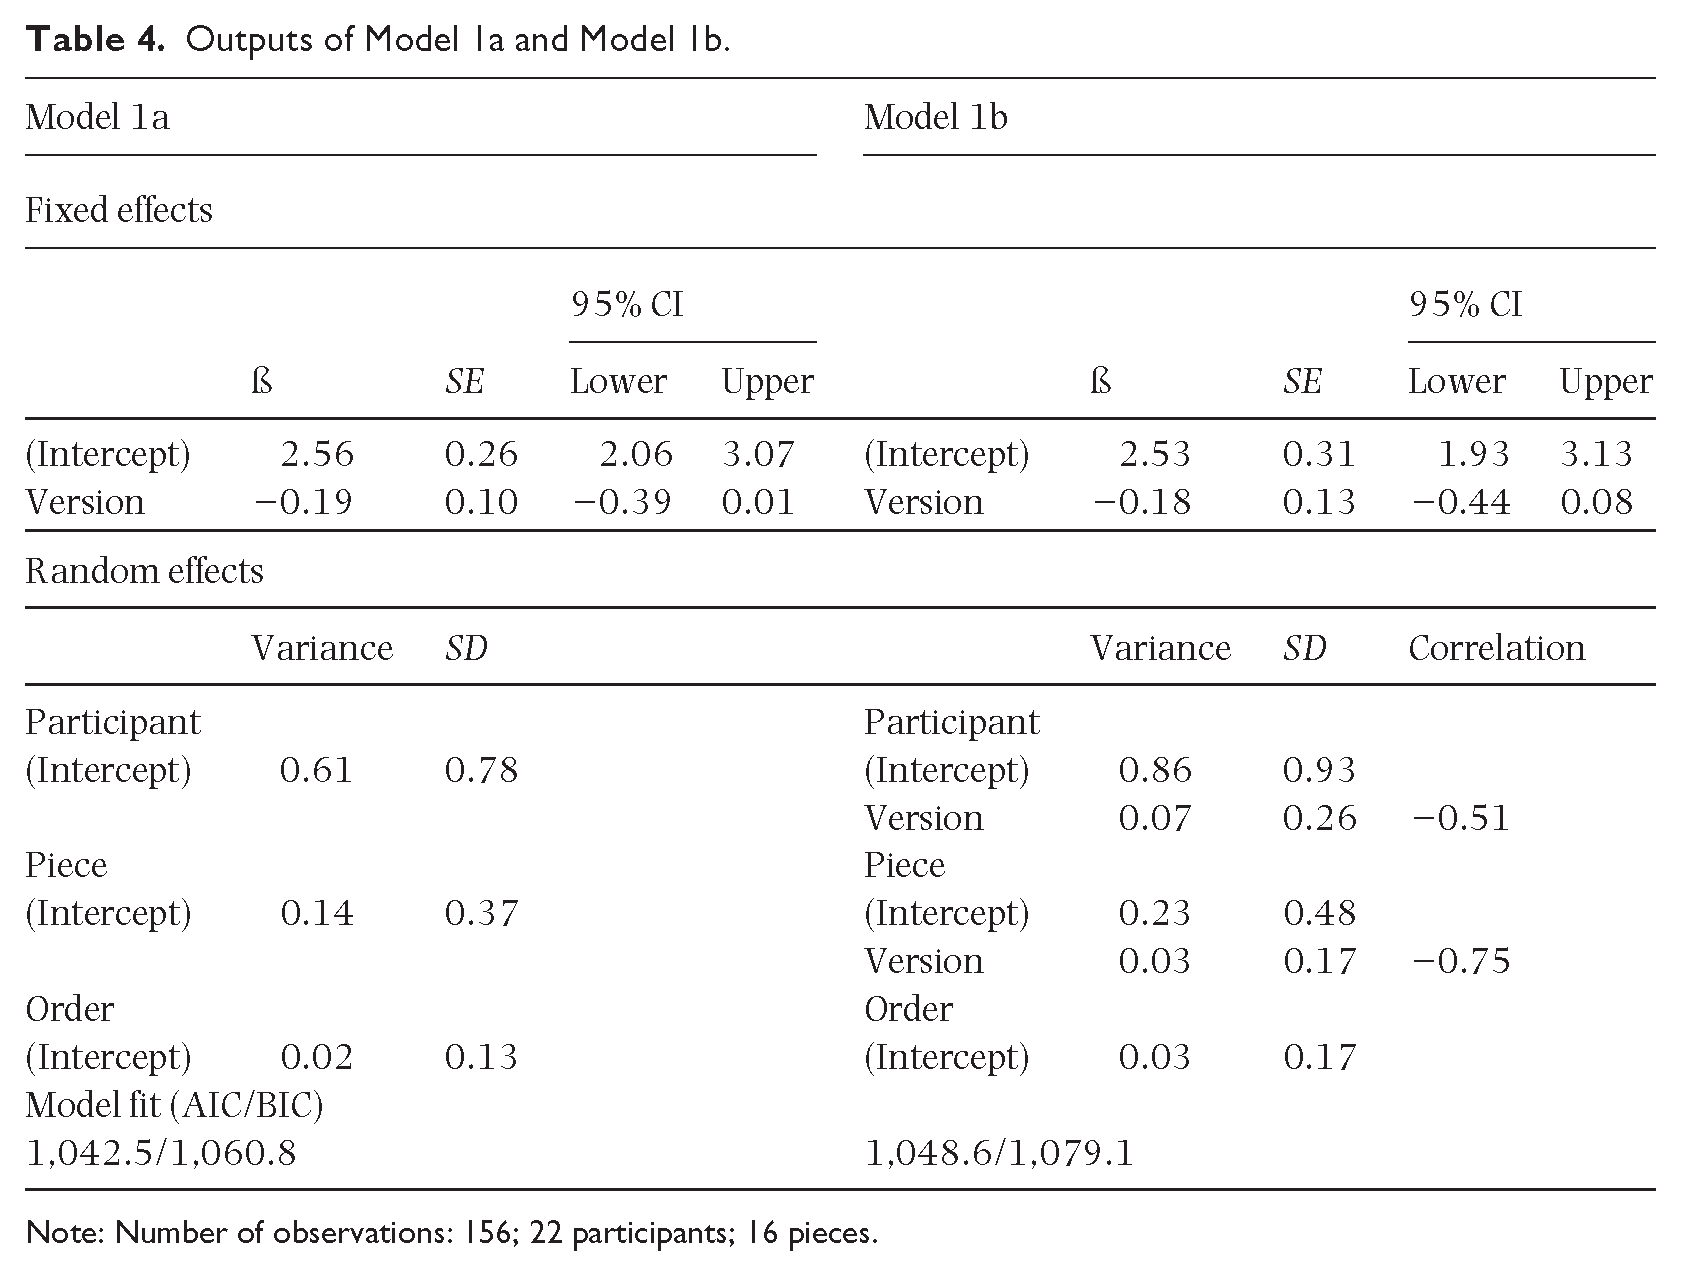
Note: Number of observations: 156; 22 participants; 16 pieces.
Final-levels model, excluding the top sight-readers
We ran two further models on the subset of the final-levels group that excludes the top four sight-readers (see Table 5). As before, the more parsimonious model (Model 2a), with random intercepts for participant, piece and order was preferred due to the lower AIC/BIC values. Both Model 2a and Model 2b, after removing the top four sight-readers, are considerably better fits than for the ‘all participants’ model. Notably, the variance attributed to participants decreased significantly from Model 1a (0.61) to Model 2a (0.31), underscoring the impact of excluding the top performers.
Outputs of Model 2a and Model 2b.
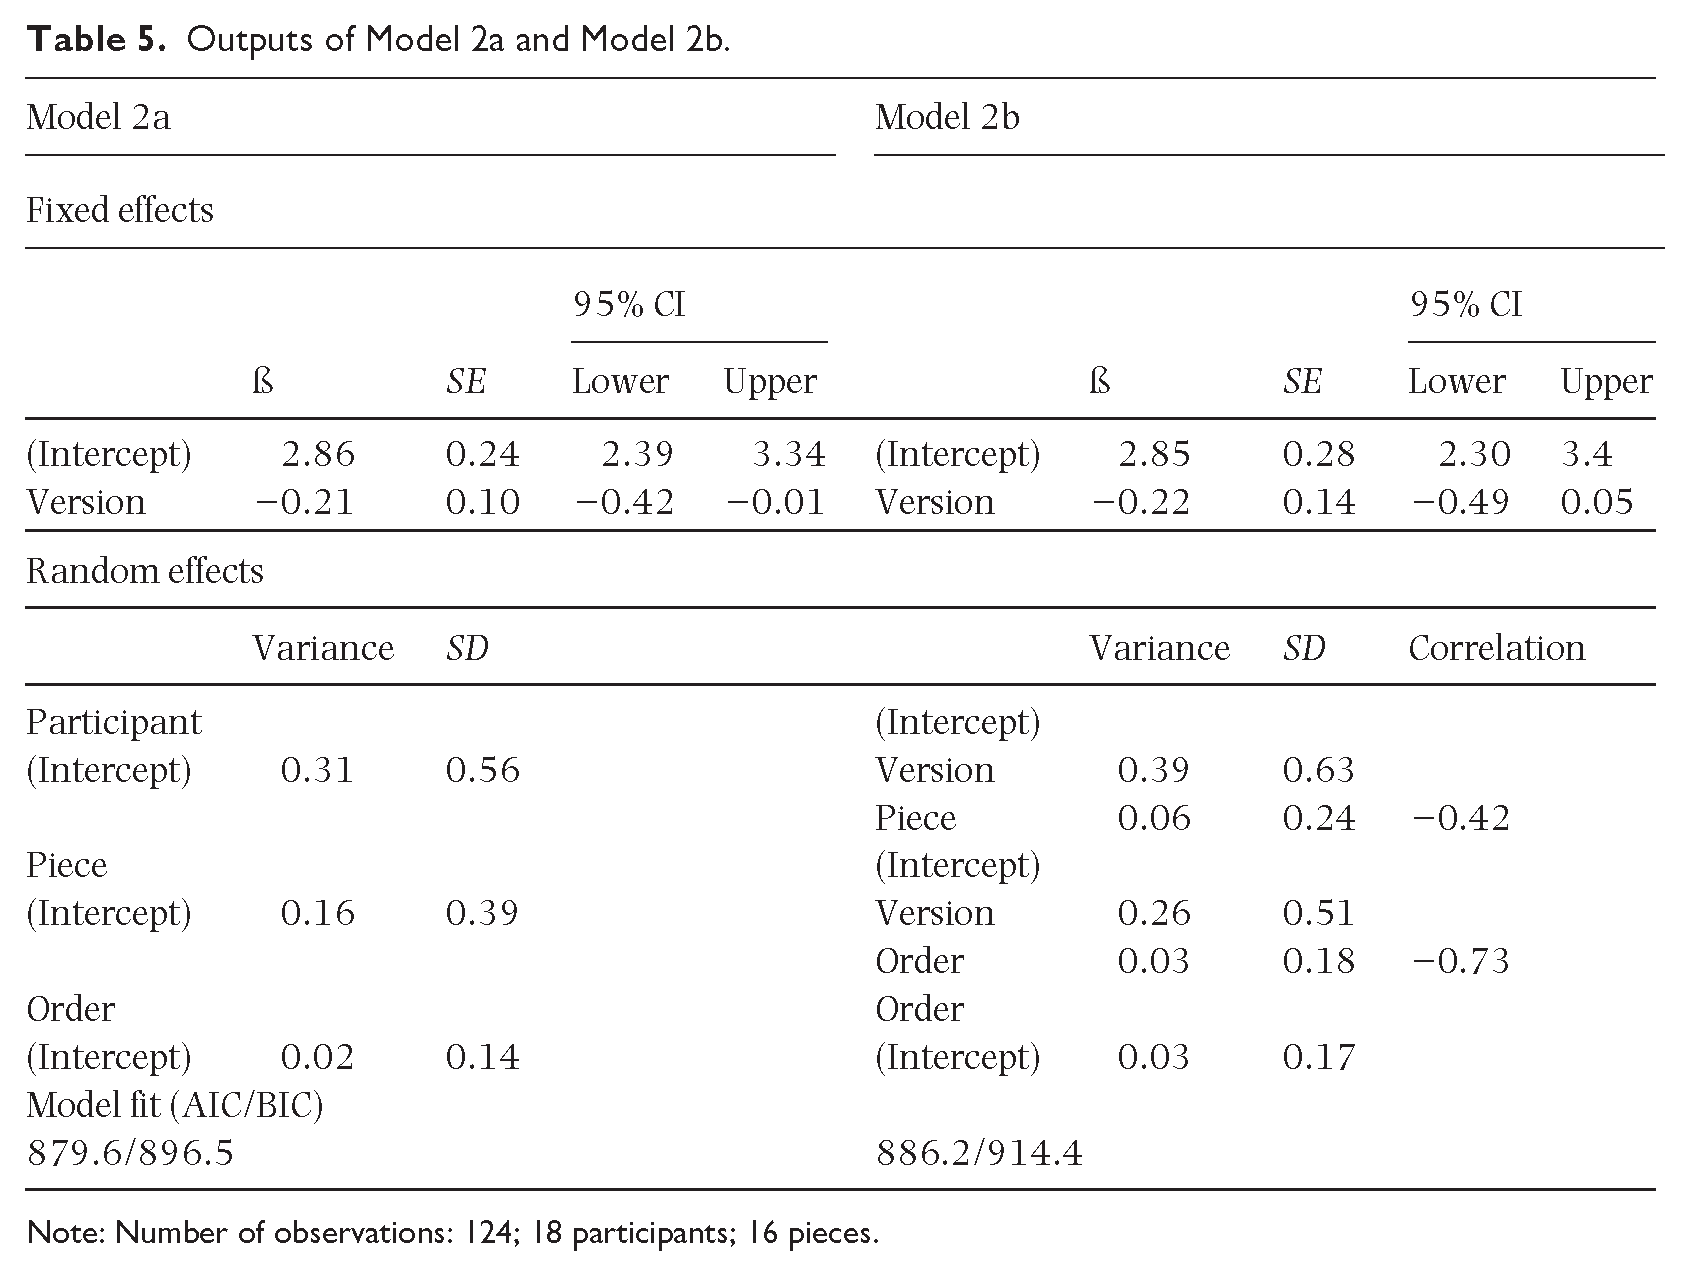
Note: Number of observations: 124; 18 participants; 16 pieces.
Effect sizes
To quantify the expected reduction in errors from using the modified notation, we exponentiated the model coefficient for Version to express the effect as an incidence rate ratio (IRR). For Model 2a, the exponentiated coefficient is e-0.21 = 0.811, indicating that sight-reading from the modified notation is associated with an estimated 18.9% reduction in error counts (calculated as 1−0.811) compared with sight-reading conventional staff notation. The 95% confidence interval suggests that the true reduction in error counts likely ranges from 1% to 34.2%; while the effect of performing from the modified scores is statistically significant (p < .05), the width of the confidence interval highlights significant variability in the estimate.
Correlations between participants and pieces and the effect of notational version
The random slopes models both revealed negative correlations between the effects of notational version and the predicted error counts for participants and pieces, that is, if the baseline error count is higher, the predicted effect of the modified notation is stronger. This correlation is strong between notational version and piece (−0.75 in Model 1b, −0.73 in Model 2b), giving a clear indication that the more difficult a piece, the greater the benefit of the added white spaces. The correlation is moderate between notational version and participant (−0.51 in Model 1b, −0.42 in Model 2b), indicating that participants who made more errors benefitted more from the added white spaces.
Outliers
When modelling the data, results from three participants were found to be highly influential on the model. This was based on calculating and summing Cook’s distance values for each participant’s performances in their final levels and using 4/n = 0.18 (where n = the number of participants, 22) as a guide to identifying influential participants. Participant 1 showed a sum of 0.18, participant 7 a sum of 0.21 and participant 21 a sum of 0.17. These values were notably higher compared with other participants, all over 4 times as large as the next participant. While 1 and 7 both showed large improvements with the modified notation (reductions in median error counts of 78.26% and 73.03%, respectively), participant 21 had a severely negative reaction to the modified notation (a percentage increase in median total errors of 137.5%). While there were no reasonable a priori grounds to exclude these participants from our analysis, removing them would have significantly improved the model fit and reduced the variability of its predictions (Model 1a, including all participants (except 1, 7 and 21) would show an expected reduction in errors of 24.3%, with 95% confidence intervals between 8.2% and 37.6%—statistically significant at the 0.005 level).
Discussion
Are visual processes independent of level of expertise?
The experiment demonstrates that adding visual cues leads to a substantial reduction in error counts (19%) when performers are nearing the threshold of their sight-reading ability. These results corroborate the earlier findings by Stenberg (2019) and Stenberg and Cross (2019) that modifying musical scores by providing clear visual grouping cues – the introduction of vertical white spaces – can reduce errors in sight-reading, and extend them by demonstrating that the effect holds particularly when performers are challenged by the music that they are reading. This effect appears to hold over different levels of ability, suggesting that similar types of visual processes are implicated in sight-reading independently of level of expertise. While level of expertise and level of challenge are obviously not wholly independent (a Grade 7 sight-reading test is significantly more complex than a Grade 4 test: for example, musical units rarely coincide with metrical grouping, harmonic and rhythmic predictability is reduced, and there are significantly greater physical demands on motor control), the added visual cues to the grouping structure appears to have similar effects for expert and less expert sight-reader alike.
White spaces provide unambiguous visual cues
The size of the eye-hand span (EHS) likely varies with expertise, being generally larger in more skilled sight-readers (Imai-Matsumura & Mutou, 2023; Perra et al., 2022). Nevertheless, this study found that modifications to complex scores read by experts had a similar effect to modifications to simpler scores read by less skilled sight-readers. This suggests that the white spaces provide low-level cues, which are utilised based on the balance between a performer’s ability and the level of challenge that they are experiencing, irrespective of the absolute level of either capacity or challenge. It seems probable that for all levels of expertise the introduction of the white spaces to delineate groups provides simple visual cues that delimit information uptake as the left-to-right sequential processing of musical information proceeds in the course of sight-reading (see Liao et al., 2022). This suggestion is also in line with the findings of Zhukov et al. (2019) that while sight-reading expertise is related to efficiency of eye movements (in terms of number and duration of fixations), task difficulty will nonetheless impact upon eye movement strategies. The use of white spaces to segment the score can be thought of as providing unambiguous visual termini for eye movements, enhancing how effectively the eye moves across the score.
Parallels with language reading
That modifications to complex scores read by experts had similar effects to modifications to simpler scores read by less skilled sight-readers is in line with findings from text reading research, where the benefits of interword separation have been shown for children and adult readers alike when their tasks were grade-appropriate (Spragins et al., 1976). Research on oral reading performance has also shown that syntactically cued text (i.e., not breaking clausal units across multiple lines) results in fewer errors and significantly reduces false starts at the beginnings of lines (Levasseur et al., 2006). Punctuation marks offer an imprecise guide to prosody, so providing unambiguous syntactic cues to the grouping of clausal units was a significant benefit when the texts were read at sight. By analogy to music notation, barlines indicate only one aspect of grouping structure (as complete synchronisation of grouping and metrical structures occurs only in simple music), whereas our white spaces provide clear cues to the overall grouping structure, helping performers to parse the phrasal groupings. One might expect that white spaces would be of more benefit when the grouping structure does not coincide with the metrical structure or when performers have fewer aural cues to the groupings (passages with less predictable harmonic progressions, for example). While our experiment revealed that passages with low harmonic predictability did produce high error counts, the data were inconclusive as to whether there was a heightened benefit of white spaces in these places.
Do visual cues lead to more fluent performances?
In coding the performances for errors, we assigned one mark for each error and avoided making judgements as to the degree of seriousness of particular error types. This decision provided continuity with the experiments of Stenberg (2019) and Stenberg and Cross (2019) and resulted in more nuanced performance scores than, for example, using the Watkins-Farnum Performance Scale (Watkins & Farnum, 1954), which only counts one error per bar. While providing an unambiguous indication of how accurately a performer reproduces the structural features of a score, this method of counting errors does not, however, take into account the fact that some errors are more serious than others – a metrical error, where the underlying metrical structure breaks down is undoubtedly more serious than a single wrong pitch, while playing a wrong pitch on a strong beat is also more serious than omitting a single note within a chord. In addition, error counts tell us little about musicality and communication, attributes that could be argued to be as important as accuracy in many sight-reading contexts. To assess whether providing clear visual grouping cues also leads to more fluent performances, an important next step will be to have a selection of the recordings from this study marked holistically by experienced examiners, using a mark scheme similar to that applied in sight-reading tests within graded instrumental exams. By doing so, it should also be possible to check how closely expert judgements correlate with objective error counts, and whether weighting certain errors that are likely to impact on fluency gives a truer picture of the performance quality (e.g., awarding more points to metrical errors). The results of Lehmann and Ericsson (1993) would suggest that we could expect to find a significant negative correlation between expert ratings of performance quality and number of errors.
Limitations and future research
The sample size, while sufficient to yield substantive results, was not as large as we would have wished and because of the experiment design there were imbalances in which pieces were read and in which version. While the mixed-effects model used is robust to unbalanced data, this could have resulted in higher standard errors, increasing the level of uncertainty in the estimates. A future study, with a full repeated measures design (e.g., participants returning a week later to perform the same pieces in the other condition) should have increased statistical power and will allow for more detailed analysis of how visual grouping cues affect particular pieces. While the experimental materials used in this study were sight-reading tests that had been graded by the ABRSM, the world’s leading provider of music exams, levels of difficulty were not categorically distinct between one grade and the next higher. Further differentiation of the levels is needed in future studies, so performances at equivalent levels of challenge can be captured from a mixed ability group. Additionally, expansion of the range of the difficulty levels should provide more interpretable results: in particular, increasing the level of challenge of the top level significantly to avoid potential ceiling effects from the most proficient sight-readers, as was found in this study.
Conclusion
The results of this study indicate that adding primitive visual cues can significantly enhance sight-reading accuracy, particularly when performers are approaching the limits of their sight-reading capabilities. Our findings align with prior research by Stenberg (2019) and Stenberg and Cross (2019), supporting the hypothesis that visually separating units of music eases cognitive load, thus aiding in processing and performing music from notation. Moreover, our study extends previous research by demonstrating the efficacy of these visual cues across a broader range of musical complexity. The evidence that even highly proficient sight-readers benefit from these spaces suggests a range of potential applications, from pedagogical contexts right through to professional performance and recording, especially where rehearsal time is limited. The score modifications that led to the positive effect that we found are minimal and it would be feasible for publishers to implement these in printed scores. However, given the increasing use by professional performers of scores in digital formats, it would seem desirable for music processing programmes to incorporate a facility for the insertion of white spaces that would enable performers, composers and teachers to customise scores as required. Being able to easily add visual cues to digital sheet music could be advantageous for musicians at all levels and in all contexts, in particular for professionals who need to perform a piece with minimal rehearsal time, as is common in studio work or with premières of new compositions.
Further research is needed to determine the extent and universality of this positive effect of white spaces, in particular, whether it is present when sight-reading from a screen, where future real-world applications of this research are likely to lie. Understanding the optimum positioning and frequency of these visual cues would also enable them to be algorithmically added, allowing a user to insert white spaces to any musical score at the touch of a button. The long-term effects of adding visual cues on learning and proficiency remain at present unknown. If white spaces not only provide unambiguous grouping cues but also aid the integration of musical information into memory, facilitating the practising of and recurrent engagement with musical scores, the benefits could be even greater, particularly for children and novice learners. Notation is often a barrier to the development of musical skills and confidence; any modification that could make it easier to read without reducing its power or efficiency could have significant benefits to many users and learners.
Supplemental Material
sj-zip-1-msx-10.1177_10298649261419805 – Supplemental material for Watch this space: Primitive visual cues enhance sight-reading accuracy
Supplemental material, sj-zip-1-msx-10.1177_10298649261419805 for Watch this space: Primitive visual cues enhance sight-reading accuracy by David Duncan, Katya Ness and Ian Cross in Musicae Scientiae
Footnotes
Acknowledgements
The authors’ work is self-evidently indebted to the research of Arild Stenberg and would not have been possible without his ongoing dedication to enhancing the readability of musical scores. The authors also thank Juliette Margerison and Zeynep Kacmaz-Milne for all their administrative support in organising the experimental sessions, Peter Harrison for his guidance and support, and Elliot Young of the Cambridge Statistics Clinic for his statistical advice.
Ethical considerations
The experiment was approved by the University of Cambridge Faculty of Music’s Research Ethics Committee on 2 May 2023.
Consent to participate
Written consent to participate was provided by all participants.
Consent for publication
All participants provided written consent for their data and video recordings to be stored and used within scientific publications and presentations, and for these to be made available anonymously for other researchers, both inside and outside the Centre for Music and Science and Faculty of Music.
Funding
The authors disclosed receipt of the following financial support for the research, authorship, and/or publication of this article: The research was carried out with as part of the project Score Design for Music Reading: Cognitive and Artistic Perspectives, funded by the Leverhulme Trust (award RPG-2022-217).
Declaration of conflicting interests
The authors declared no potential conflicts of interest with respect to the research, authorship, and/or publication of this article.
References
Supplementary Material
Please find the following supplemental material available below.
For Open Access articles published under a Creative Commons License, all supplemental material carries the same license as the article it is associated with.
For non-Open Access articles published, all supplemental material carries a non-exclusive license, and permission requests for re-use of supplemental material or any part of supplemental material shall be sent directly to the copyright owner as specified in the copyright notice associated with the article.