
Abstract
Previous studies showed that working memory (WM) content can guide attention; however, whether working memory capacity (WMC) and state anxiety could affect this remains unclear. This study aimed to examine the effect of WMC and state anxiety on attention guided by WM content. Participants with high and low WMC were assigned to either a neutral or an anxiety condition. They were asked to perform a modified change detection task with irrelevant singletons while their event-related potentials were recorded. N2pc and Pd were observed in the low-WMC and anxiety group, and Pd was observed in both the high-WMC and anxiety and the high-WMC and control groups, whereas neither N2pc nor Pd was found in the low-WMC and control group. These findings suggest that attention is guided or suppressed by WM content, depending on the WMC and anxiety level of the individual. This study provides a new perspective on WM content-guided attention.
Introduction
Researchers are still debating whether attention can be guided by working memory (WM) content, and three different views dominate. The biased competition theory (Desimone & Duncan, 1995) proposed that attention would be guided by WM content in a visual search task (Bahle et al., 2020; Olivers et al., 2011; van Moorselaar et al., 2014). In contrast, other researchers assumed that the attention guided by WM content in a visual search task would be suppressed (Feldmann-Wüstefeld & Vogel, 2018). Meanwhile, another research observed that both attention guidance and attention suppression could happen simultaneously (Sawaki & Luck, 2011). Thus, the current study examined the impact of combined state anxiety and working memory capacity (WMC) on attention guidance.
According to the biased competition theory (Desimone & Duncan, 1995), memory-matched items would automatically capture attention, which is a bottom-up process (Soto et al., 2005). For instance, on the one hand, WM content could improve visual search task performance and reflect a larger N2pc component. When WM cues match target items in a search array (Whitehead et al., 2019), the N2pc component is a lateralized event-related potential (ERP) component that has been found to reflect attentional orientation to a relevant target stimulus (Luck & Hillyard, 1994; Whitehead et al., 2019) with typical onset between 180 and 300 ms (Eimer & Kiss, 2007; Woodman & Luck, 2003). Rutkowska et al. (2020) found that participants responded faster when the target was memory-matched with the item in WM content, which also evoked the N2pc, indicating that attention was captured by memory-matched items. On the other hand, search performance declined when the memory-matched items were the distractors in a visual search task, indicating that the attention was captured by WM content (Olivers, 2009).
However, other studies showed that the memory-matched items did not always capture attention and that the attention to memory-matched items could be strategically suppressed (Baithwaite et al., 2005). For example, individuals would strategically avoid items that matched WM content when they knew that the target would never match the content kept in memory (Woodman & Luck, 2007). A recent ERP study using a change detection task found that participants would actively suppress the distractors and elicit a Pd component, during which the amplitude increased with distractor load and decreased with WMC (Feldmann-Wüstefeld & Vogel, 2018). The Pd component reflects attentional suppression of distractors, and it is observed in the ERP waveform as a more positive voltage at contralateral scalp sites than at ipsilateral scalp sites relative to the position of the to-be-suppressed item (Hickey et al., 2009; Sawaki & Luck, 2010, 2011). The Pd component typically begins at 250 to 300 ms post-stimulus, depending on the stimulus salience (De Vito et al., 2017).
A comprehensive perspective proposed that both attention capture and attention suppression could happen. Han and Kim (2009) found that WM had a guiding effect on attention selection, which reflected cognitive control and depended on the nature of tasks; thus, there was an equal chance for attention capture and attention suppression. A recent ERP recording study found that task-irrelevant probes matching the contents of visual WM caught attention first and then were suppressed, indexing by the cancelled amplitude of N2pc and Pd (Barras & Kerzel, 2017). Another ERP study found that distractors reliably captured attention reflected by an N2pc component and that, subsequently, the distractors were suppressed, as indexed by a Pd component (Liesefeld et al., 2017). The results indicated that attention control included bottom-up and top-down processes.
These inconsistent results may be due to the individual’s WMC and anxiety state being neglected. Previous studies have shown that there was a correlation between WMC and the efficiency of controlling attention (Kane et al., 2001). For example, high-WMC individuals can focus better on task-related information and avoid task-irrelevant information compared with low-WMC individuals (Bleckley et al., 2015). In addition, the individual differences of WMC are the index of the ability of attention capture and attention suppression; high-capacity individuals actively suppress salient distractors, whereas low-capacity individuals are unable to suppress salient distractors in time to prevent those items from capturing attention (Gaspar et al., 2016). Similarly, a functional magnetic resonance imaging study using a listening-span test found that high-span participants had more effective attention control compared with low-span participants, which is supported by significant activation in the anterior cingulate cortex in the high-WMC group compared with that of the low-WMC group (Osaka et al., 2003).
Results regarding the effects of anxiety on attention control differ. Anxiety has been found to enhance the attention guidance of WM content indexed by the N2pc component (Moran & Moser, 2015; Moser et al., 2012). According to a previous study on attention control (Bishop, 2009), anxiety is linked to impoverished recruitment of prefrontal attentional control mechanisms to inhibit distractors. Individuals with anxiety could not prevent the misallocation of attention to salient elements due to the deficit of attention control to suppress them (Gaspar & McDonald, 2018) as well as inability to filter task-irrelevant stimuli (Gambarota & Sessa, 2019). Thus, individuals with anxiety would exhibit attention bias to the salient stimuli indexed by a larger N2pc component compared with non-anxious individuals (Tsai et al., 2017). For instance, anxiety was associated with attention capture to threat stimuli in the nature of bottom-up control of attention indexed by a larger N2pc component (Wieser et al., 2018) even when the stimuli were emotionally neutral (Moser et al., 2012). On the contrary, a study by Najmi et al. (2015) supported that anxiety would not always be related to deficits in attentional control, but it found that individuals with anxiety showed increased attention control under high cognitive load. Moreover, anxious individuals would elicit more attentional suppression, which, when indexed by the Pd component, reflected an active process of suppression (Hickey et al., 2009) to reduce the effect of threats in the dot-probe task (Kappenman et al., 2021). Furthermore, another recent study showed that highly anxious individuals were able to actively suppress distractors, inducing the Pd component, as they may compensate for deficient control functions by allocating greater effort (Gaspar & McDonald, 2018; Derryberry & Reed, 2002). Hence, the arousal of anxiety may enhance individuals’ performance of attentional suppression and induce the Pd component. However, there have been very few studies on attention guidance that directly investigate whether an interaction exists between anxiety and cognitive ability, especially anxiety and WM capacity, which is one facet of cognitive ability (Conway et al., 2003; Oberauer et al., 2000).
A few studies have addressed the effect of WMC and anxiety on cognitive tasks. Cognitive interference theories suggest that WMC could modulate the effect of anxiety on cognitive task performance (Eysenck et al., 2007; Owens et al., 2014). Specifically, anxiety became deleterious for low-WMC individuals and impaired cognitive task performance. In contrast, anxiety had no effect on high-WMC individuals, and it might be the reason why they became more efficient (Owens et al., 2014). For instance, Edwards et al. (2015) found that WMC could buffer the effect of anxiety and stress on attention. They used a pressured counting task to induce stress and the Automated Operation Span Task to measure WMC after individuals completed the State–Trait Anxiety Inventory and Depression Anxiety Stress Scale. The results of their study showed that anxious individuals with low WMC had poorer attentional shifting performance compared with anxious individuals with high WMC under higher situational stress but not at lower situational stress. In contrast, lower situational stress and higher trait anxiety predicted facilitated efficiency for low-WMC individuals. Thus, it was not hard to determine that one of their results supported that anxiety could enhance attention-shifting performance. However, attention shifting is more closely related to the top-down attention mechanism (Ejaz et al., 2013), whereas attention bias is more involved in bottom-up processing (Soto et al., 2005), such as attention captured by a distractor-induced N2pc component. However, top-down processing in attention bias also exists, such as actively suppressing the distractor-induced Pd component. It is unclear whether anxiety would facilitate or reduce attentional control, making individuals have a better or worse performance in suppressing distractors. Further exploration is warranted to determine if state anxiety and WMC would interact to predict attentional control performance.
In short, there has been little agreement on how WM content guides attention. These mixed results are probably due to lack of consideration for the individual differences of WMC and state anxiety as well as the interaction between them. To this end, the current study explores how WMC and state anxiety affect WM contents on attention guidance. Participants with low and high WMC performed a modified change detection task in an anxiety or control context while undergoing electroencephalogram (EEG) recording. The N2pc and Pd components were selected for measuring attention orienting toward WM content and its active suppression, respectively (Sawaki & Luck, 2010; Sawaki et al., 2012). According to the cognitive interference theories and previous studies (Eysenck et al., 2007; Owens et al., 2014), we assumed that low-WMC individuals would be more susceptible to influence by distractors of WM content in an anxiety context indexed by an N2pc component, whereas high-WMC individuals would suppress the distractors of WM contents indexed by a Pd component.
Methods
Participants
This study was approved by the local ethics committee of Guizhou Normal University. All participants were paid volunteers and gave written informed consent before participation. All methods were carried out in accordance with relevant guidelines and regulations. Before the formal experiment, a pre-experiment was performed to measure the participants’ WMC. A total of 191 participants finished the change detection task used to measure individual WMC. A total of 39 participants with WMC scores between 1.5 and 2.1 were assigned to the low-WMC group, and a total of 38 participants with WMC scores higher than 2.6 were assigned to the high-WMC group. Then, 77 (34 males and 43 females; mean age, 19.94 years; range, 17−25 years) right-handed, healthy adults with normal or corrected-to-normal vision were recruited for the formal experiment. The low- and high-WMC groups separately completed tasks under state anxiety or control conditions in the formal experiment. This manipulation led to four experimental groups, including the low-WMC anxiety group, the low-WMC and control group, the high-WMC and anxiety group, and the high-WMC and control group. For the stability and reliability of the ERP results, the average number of trials for each condition should be more than 100 when the tested ERP component was approximately 1.25 mV (Boudewyn et al., 2018). Sixteen participants were excluded, as the number of trials was less than 100 after artifact detection. Based on a previous study with a between-factors experimental design (Palladino & Ferrari, 2013) and using G*Power (Faul et al., 2007) to calculate the sample size, with a medium effect size f = 0.4 and a power of 0.8 at an alpha of 0.05, we determined that a total sample size of 56 was required, with at least 14 participants per group. Regarding the ERP studies involving N2pc and Pd components, Gaspar and McDonald (2018) suggested that 12 to 20 participants should typically be included within each subgroup of the analysis. In the current study, 61 participants were included in the final analyses, 13 (6 males and 7 females) in the low-WMC and anxiety group, 16 (7 males and 9 females) in the low-WMC and control group, 15 (5 males and 10 females) in the high-WMC and anxiety group, and 17 (7 males and 10 females) in the high-WMC and control group.
Procedures and tasks
The current study was divided into two parts. For the pre-experiment, participants were tested for their WMC using a change detection task one week before the formal experiment. In the pre-experiment, participants arrived at the experimental room where they rested for five minutes and then provided their informed consent. Afterward, they were asked to complete the change detection task and were then allowed to leave the laboratory. In the formal experiment, all participants screened from the pre-experiment were instructed to sleep early the night before the experiment and were asked not to exercise vigorously on the day of the experiment. Participants sat in a separate room and rested for 20 minutes after arrival. They then completed the State–Trait Anxiety Inventory questionnaire (Spielberger, 1983) and practiced the modified change detection task. While the experimenter prepared the EEG device for the participants, the control group watched a neutral movie clip named “jái tué mon père” from the film Comment (Fontaine, 2001), and the anxiety group watched an extremely violent movie clip from the film Irreversible (Noé, 2002). The two movie clips were equalized in luminance and similar in language, with a video duration time of three minutes. Participants were asked to imagine themselves as witnesses to the violence depicted in the movie clip while watching it (Qin et al., 2009). After watching the video, participants completed the state anxiety questionnaire again and then started a modified change detection task with EEG recording. After finishing the task, they were asked to complete the state anxiety questionnaire for the third time, after which the EEG electrode cap was removed and the experiment ended. All tasks in the formal experiment required approximately 60 minutes, during which the modified change detection task lasted approximately 45 minutes. Based on previous research on arousing anxiety, their cortisol levels showed that the anxiety state induced by the movie clips could last at least 40 minutes (Lass-Hennemann et al., 2014; Qin et al., 2009). Thus, considering the EEG recording continuity, we measured the anxiety state before and after the modified change detection task.
The pre-experiment
A change detection task was used to measure WMC in the pre-experiment. In this task, each trial started with a 500-ms fixation on a cross in the middle of a screen. Then, the sample array was presented on the screen for 100 ms with 4, 6, or 8 different color squares. After a 900-ms delay, the test array was presented until the participants responded. The squares maintained the same position in the test array, while only one of the squares changed color in half of the trials. Participants pressed the “K” or “L” button on a keyboard to indicate whether the color of the test array matched the color of the sample array. Each participant performed 20 practice trials, followed by three blocks of 60 trials. Each block included 4, 6, or 8 different color square conditions. All color squares were 100 pixels in the test, and each square had a length of 2.0° visual angle. Square colors were drawn randomly from a set of 10 colors (RGB decimal codes: red, 255–0-0; green, 0–255–0; blue, 0–0–255; yellow, 255–255–0; magenta, 255–0–255; cyan, 0–255–255; black, 0–0–0; white, 255–255–255; purple, 238–230–238; orange, 255–128–0), and no color was repeated within one memory display. All stimulus presentation and behavioral response collections were controlled by E-prime 2.0 running on a 17-inch Dell LCD display with a resolution of 1024 × 768 and a refresh rate of 60 Hz.
The formal experiment
A modified change detection task was performed in the formal experiment, and each trial started with a cue array in which was placed a 0.4° × 0.4° rectangle. Half of the rectangle was filled with dark gray (8.86 cd/m2) and the other half with light gray (17.76 cd/m2). All participants were instructed to focus on the dark gray side or on the light gray side and that they needed to focus on the corresponding side of the screen at the cue array. Dark gray and light gray were counterbalanced across participants. After 400 ms, participants were instructed to remember the orientation of the rectangle on the dark or gray indexed side of the screen in the sample array, which was sustained for 400 ms while the cue stimulus remained visible. The angles of the rectangle were randomly changed between 25° and 65° or between 115° and 155° to avoid horizontal and vertical levels, and one of the rectangles was either green or red with 0.6° × 1.4° and 2.0° away from the cross. The color in the sample array would be counterbalanced across participants. A 200 ms probe array was presented after a blank with a random time between 700 and 900 ms. A pair of circles was presented with a fixation cross in the probe array, and every circle was 2° away from the cross with a 1.4°. The circles were task-irrelevant information, and their color (red and green) would also be counterbalanced. Participants were instructed to ignore the two circles and to not respond in this array. One of the two circles would be color-matched with the rectangle in the sample array, which indicated that the circle was a memory-match distractor. After a blank with a random time between 700 and 900 ms, two red rectangles with different angles were presented and with a distance of 4.5° from the center cross in the test array. One rectangle orientation was the same as the memory rectangle (participants were instructed to remember this rectangle in the sample array, hence the term memory rectangle) in the sample array; the other rectangle orientation was randomly chosen to be tilted 20° or −20° relative to the memory rectangle. The location of the orientation-matching and orientation-mismatching rectangles varied randomly across trials. Participants were asked to judge which one of the rectangles’ orientation in the test array was the same as in the sample array of the cue indexed side of the screen. The next trial started after 3,000 ms or after participants provided a response in the test array (see Figure 1). This task consisted of 640 trials, and the memory-match distractor was presented on the right or left visual hemifield, which was counterbalanced, during the probe array in half of the trials. In this experiment, the modified change detection task lasted approximately 45 minutes.

Illustration of sample trial sequences for the modified change detection task.
Behavioral data analysis
In the pre-experiment, the WMC of participants was calculated by using the formal
Electrophysiological recording and data analysis
EEG signals were recorded using the NeuroScan SynAmps system (NeuroScan Inc., Sterling, VA, USA) with 64 scalp electrodes according to the expanded 10–20 system. The horizontal electrooculogram (EOG) was recorded bipolarly from electrodes placed 1 cm to the left and right of the outer canthi. The vertical EOG was recorded bipolarly from electrodes placed above and below the left eye. All electrodes were referenced to the tip of the nose online and were re-referenced to the algebraic average of the left and right mastoids offline. Impedance was maintained below 10 kΩ, and EEG signals were amplified with a band-pass of 0.05 to 100 Hz and sampled at a rate of 1000 Hz.
Matlab (R2013b), EEGLAB (v14.1.2), and ERPLAB (v7.0.0) were used for offline data analysis of continuous EEG data. High-pass filtering (0.1 Hz, 12 dB/octave) and low-pass filtering (30 Hz, 12 dB/octave) were performed with reference to the bilateral mastoid mean on continuous EEG data and resampled to 256 Hz. Baseline correction of the EEG data was performed from −100 to 0 ms relative to the probe array onset and segmented starting from 100 ms before the probe array appeared and 500 ms after the probe array, time locked to the probe array. The mean across the epochs was used to calculate average ERP waveforms (De Vito et al., 2017; He et al., 2015; Sawaki & Luck, 2011). Epochs with a voltage exceeding ±80 μV at any electrode and with any other EEG artifacts were rejected. The blink artifacts were automatically corrected and manually deleted using moving window peak-to-peak (width, 200 ms; step size, 100 ms) and simple voltage threshold in ERPLAB (v7.0.0). Both the motion artifact and the EOG rejection threshold were ±80 μV. Epochs were removed from the data analysis if the residual horizontal EOG activity exceeded ±3.2 μV (Sawaki & Luck, 2011). All ERP analyses were performed on the corrected trials.
The Pd component typically begins 250 to 300 ms post-stimulus, depending on stimulus salience (De Vito et al., 2017). The onset of the N2pc component is typically between 180 and 300 ms (Eimer & Kiss, 2007; Luck & Hillyard, 1994; Woodman & Luck, 1999, 2003). Together, these two components make it possible to determine whether a given item is suppressed or attended. According to previous studies, the task-relevant item based on color in visual search tasks would result in a large and early N2pc to the color-defined target beginning approximately 175 ms post-stimulus (Carlisle & Woodman, 2011) and the Pd component beginning approximately 250 ms post-stimulus (De Vito et al., 2017). Therefore, we measured the mean amplitude of the N2pc component from the 180- to 230-ms post-probe array and the Pd component from the 270- to 300-ms post-probe array. Both the N2pc and Pd components were measured at the average of two electrode pairs, PO7/PO8 and P7/P8 (De Vito et al., 2017). The Pd and N2pc separately underwent univariate repeated-measure analyses of variance (ANOVAs) for the mean amplitude with WMC (high vs. low) and anxiety (anxiety vs. neutral) as between-subject factors and the mean amplitude as the dependent variable.
Results
Change detection task results for the pre-experiment
The K values of the four WMC groups were analyzed by one-way ANOVA; the results showed a significant main effect of group [F(3, 60) = 89.78, p < 0.001], whereas the K value in the low-WMC group (3.13 ± 0.43) was significantly lower than that in the high-WMC groups (1.28 ± 0.17) (p < 0.001). There was no significant difference between the low-WMC and anxiety group and the low-WMC and control group (p = 0.76) or between the high-WMC and anxiety group and the high-WMC and control group (p = 0.33).
Questionnaire results
The scores for trait anxiety were analyzed by ANOVA, with the group as the independent variable. The results showed that no significant differences among the four groups [F(3, 60) = 0.69, p = 0.56] in the trait anxiety scores. The state anxiety scores were analyzed by a repeated-measure ANOVA, with the time point as the within variable and the group as the between variable of the subjects. The results showed a significant main effect of group [F(3, 57) = 8.94, p < 0.001,
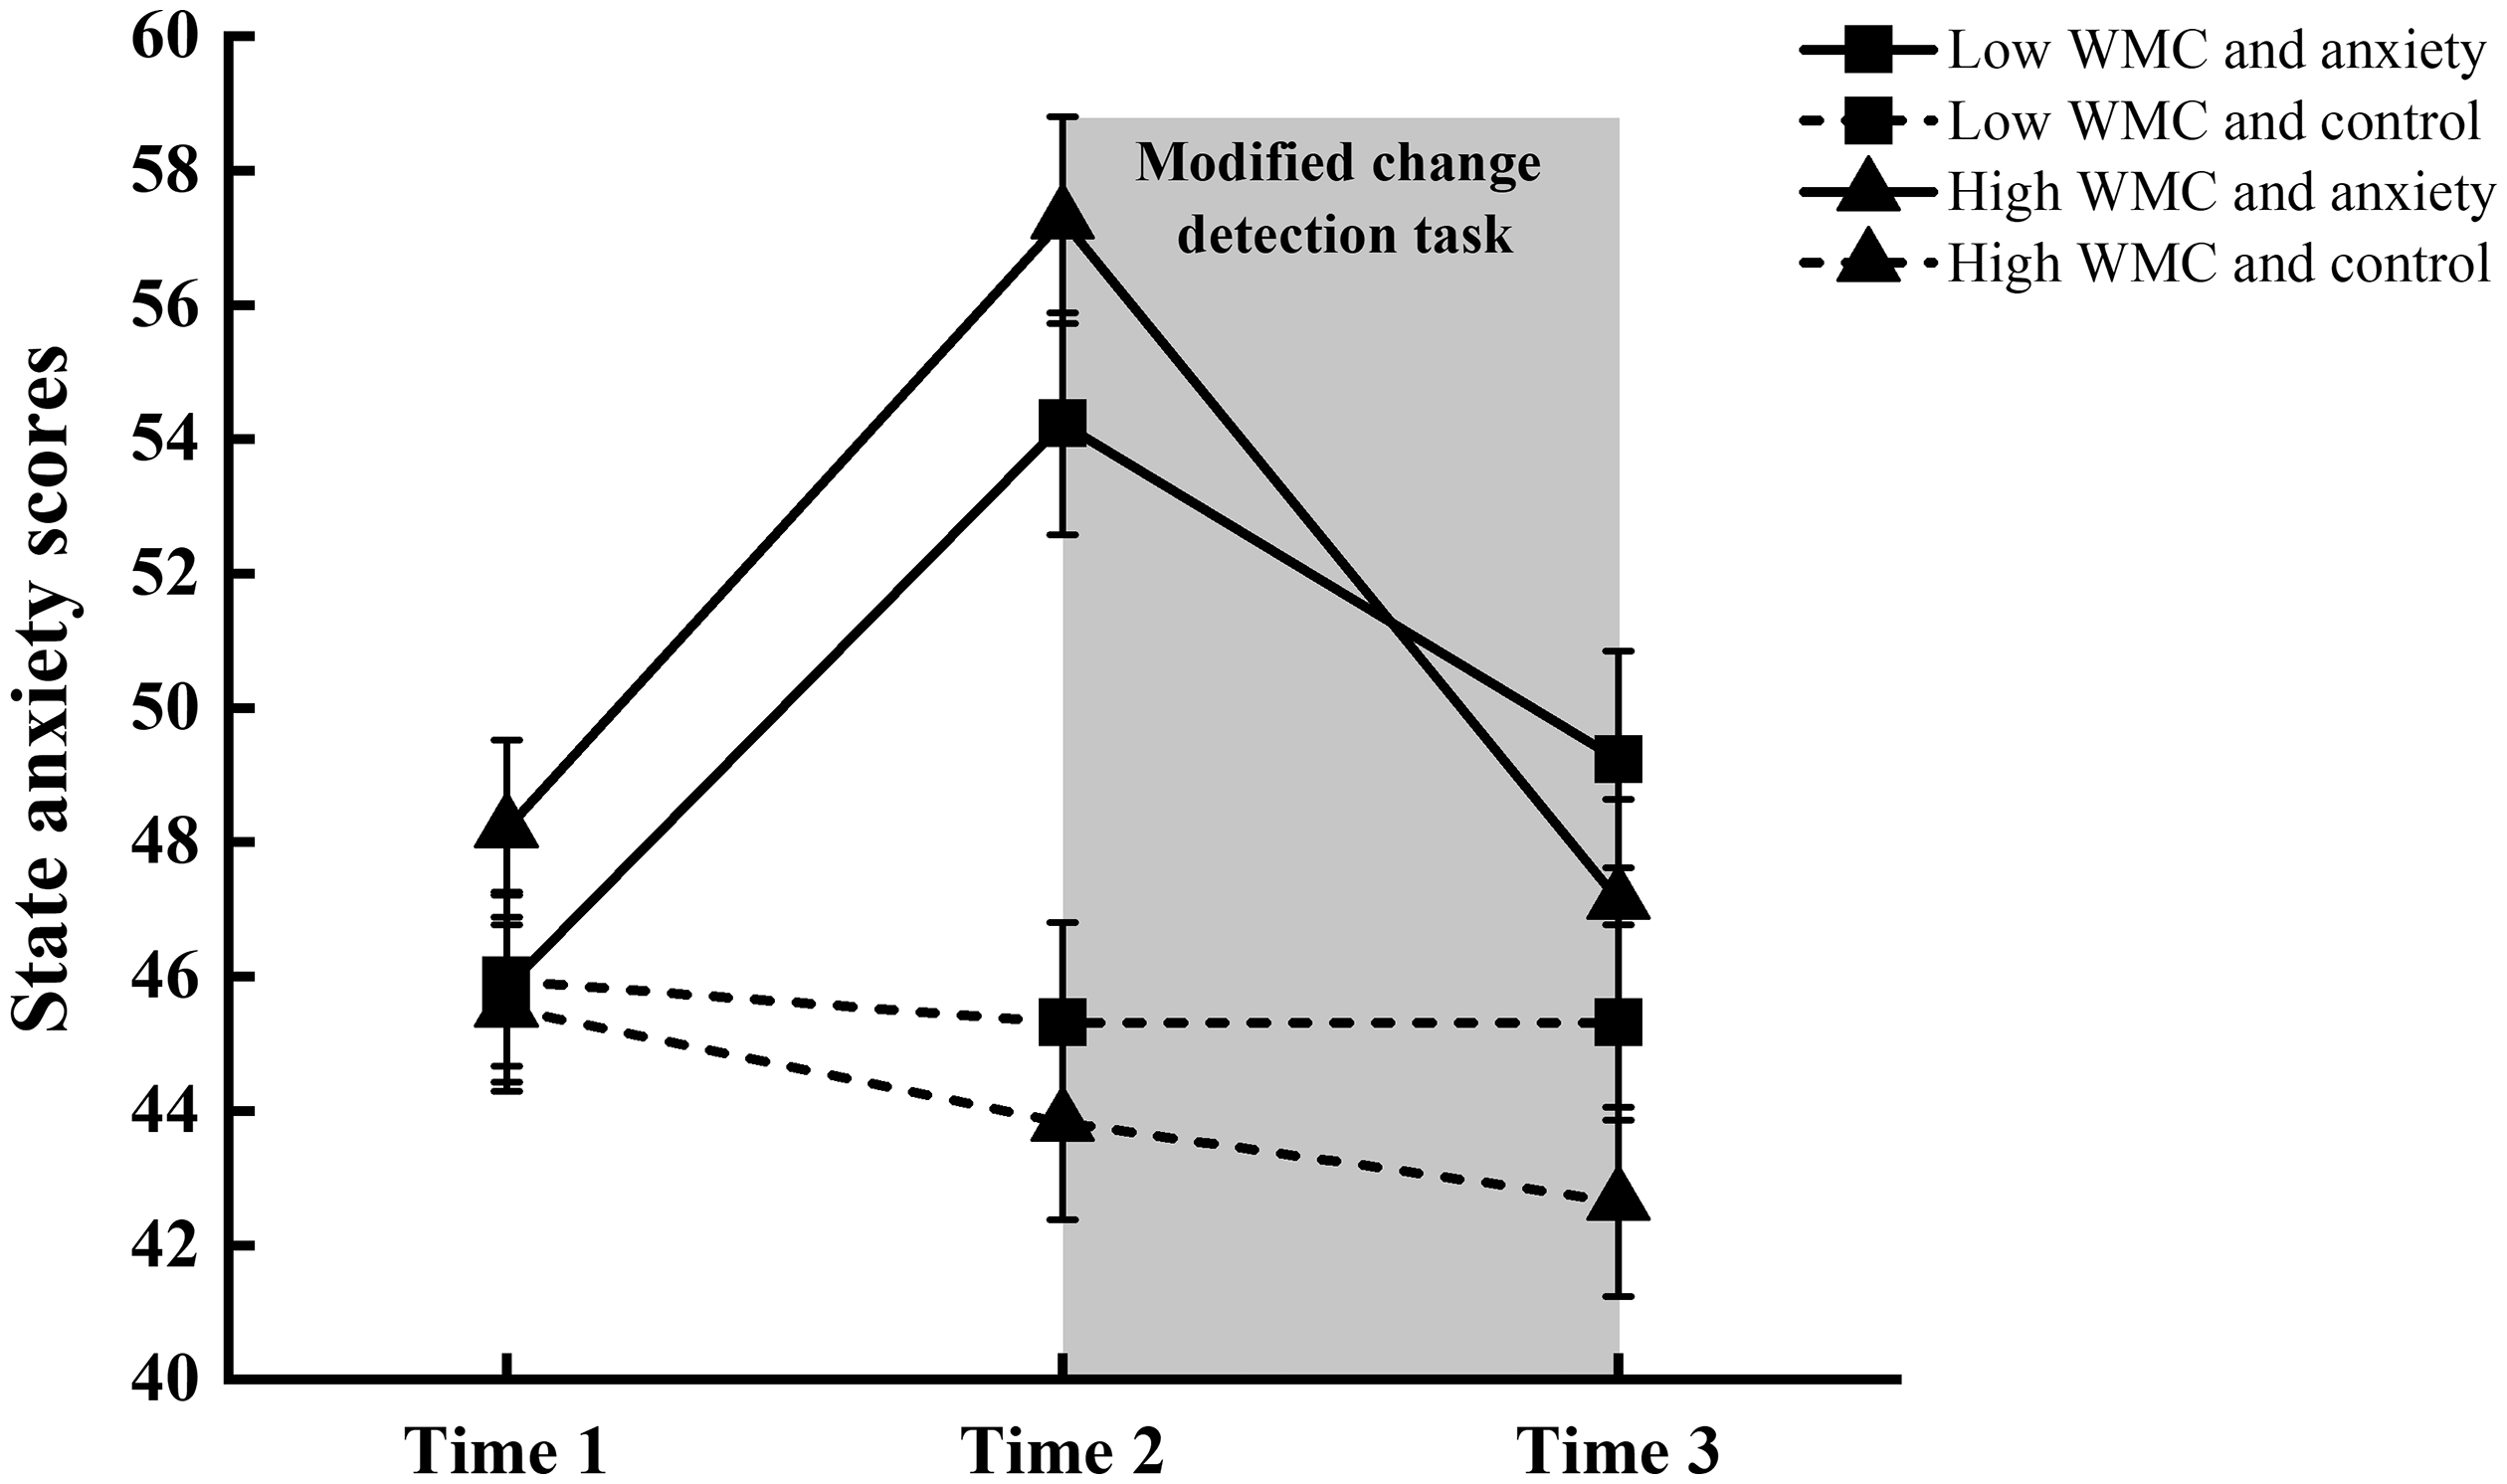
The state anxiety scores of the four groups at the first measurement (i.e., the time before practicing the modified change detection task; time 1), second measurement (i.e., the time after watching the movie; time 2), and the third measurement at the end of the experiment (time 3). Error bars indicate standard errors. The shaded box represents the experimental task period.
The modified change detection task results
Univariate repeated-measure ANOVAs with WMC (high vs. low) and anxiety (anxiety vs. neutral) were conducted on accuracy and reaction time. There was a main effect of WMC on accuracy (Figure 3a), showing that accuracy was significantly higher for the high-WMC groups than for the low-WMC groups [F(1, 57) = 15.45, p < 0.001,

Results from the modified change detection task: (a) accuracy across high and low WMC for anxiety and control. (b) Reaction time across high and low WMC for anxiety and control. Error bars indicate standard errors.
EEG/ERP results
We first performed a one-sample t-test to determine whether significant N2pc and Pd components were present in response to the memory-match distractors in the probe array (Sawaki & Luck, 2011). The results showed that the mean amplitude of N2pc was significantly smaller than zero in the low-WMC and anxiety group [t(12) = –2.74, p = 0.018], which means that attention was captured by the distractor in the low-WMC and anxiety group. There was no significant difference between zero and N2pc amplitude in the low-WMC and control group [t(15) = –0.91, p = 0.38], the high-WMC and control group [t(16) = –1.31, p = 0.21], or the high-WMC and anxiety group [t(14) = –1.36, p = 0.19], indicating that there was no attention capture by the distractor in those three groups. A one-sample t-test showed that the mean amplitude of Pd was significantly greater than zero in the high-WMC and anxiety group [t(14) = 2.8, p = 0.014], the high-WMC and control group [t(16) = 3.41, p = 0.004], and the low-WMC and anxiety group [t(12) = 2.58, p = 0.024] (see Figure 4). In contrast, there was no Pd in the low-WMC and control group [t(15) = –0.13, p = 0.898].
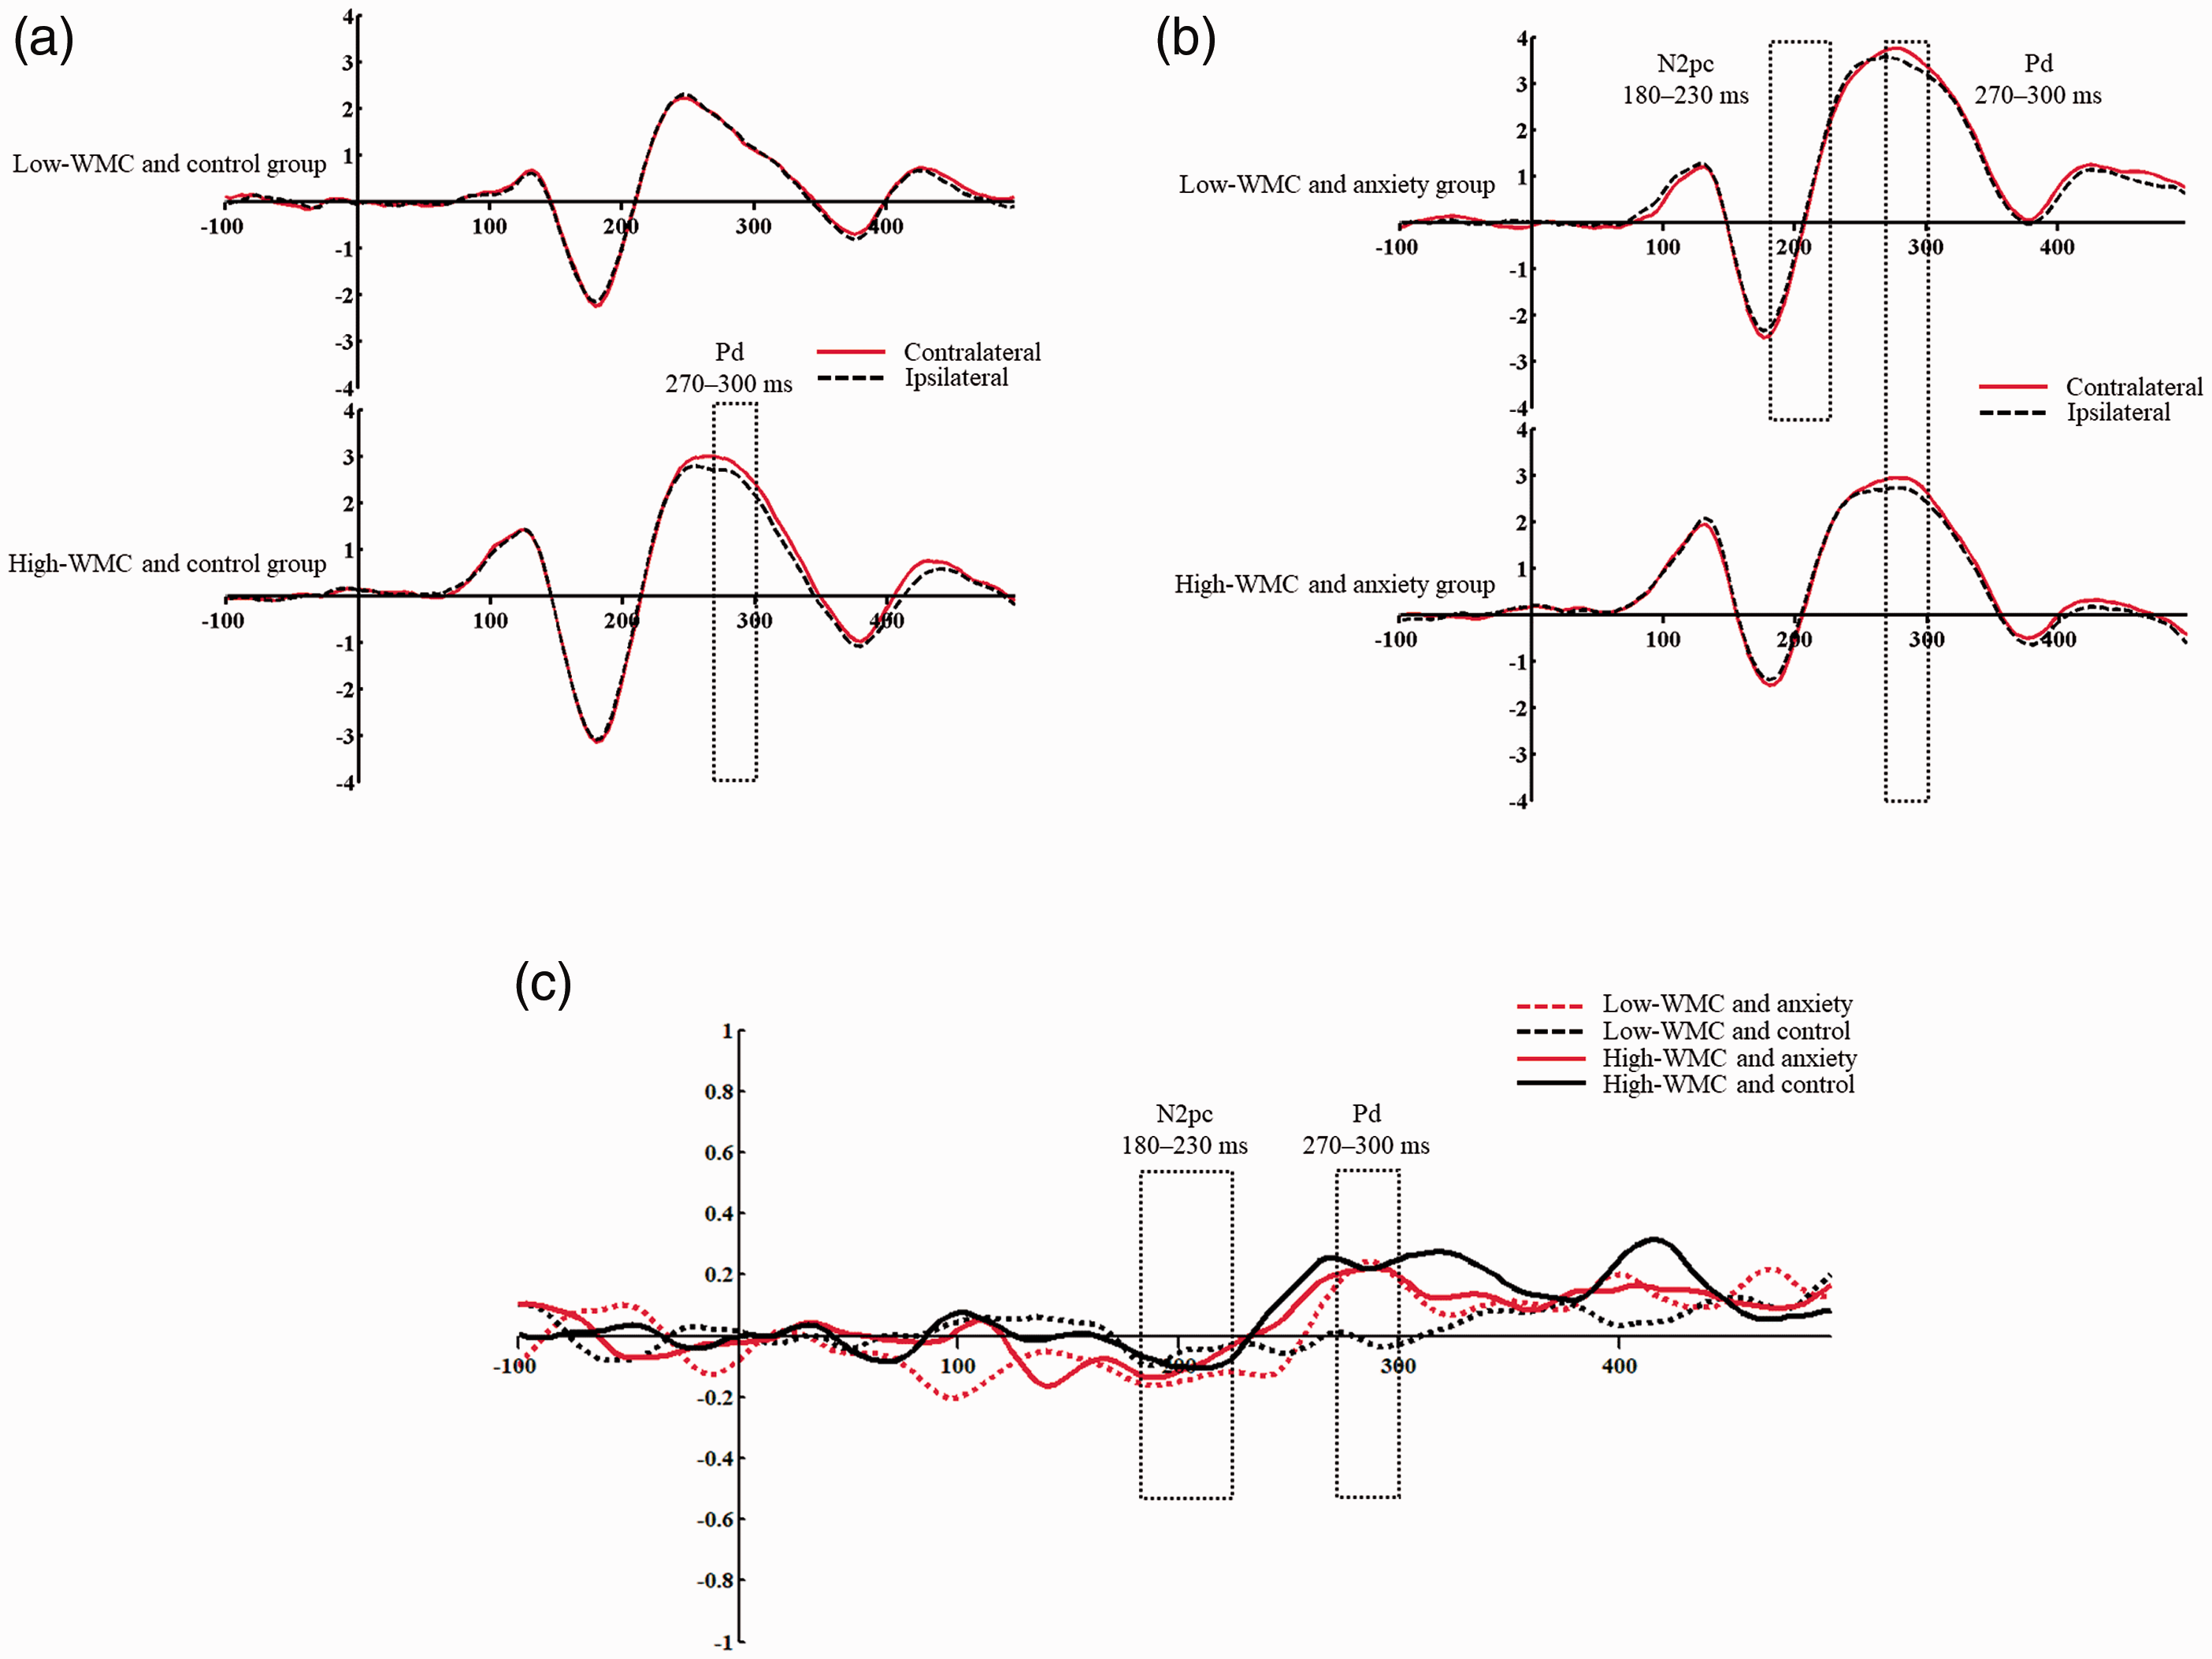
(a) Grand-averaged event-related potentials (ERPs) recorded contralaterally and ipsilaterally to the salient distractor for the low- and high-working memory capacity (WMC) and control groups. (b) Grand-averaged ERPs recorded contralaterally and ipsilaterally to the salient distractor for the low- and high-WMC and anxiety groups. (c) Averaged ERP waveforms of the differences in mean amplitude between electrode sites contralateral to the memory-matching distractor versus those ipsilateral to the memory-matching distractor for the four groups. Low-WMC and anxiety, the low-WMC and anxiety group; low-WMC and control, the low-WMC and control group; high-WMC and anxiety, the high-WMC and anxiety group; high-WMC and control, the high-WMC and control group. The dotted line boxes represent the time windows of the distractor-elicited N2pc and Pd.
Univariate repeated-measure ANOVAs with WMC (high vs. low) and anxiety (anxiety vs. neutral) were performed on the mean amplitude of the Pd and N2pc. This showed no significant main effect of WMC [F(1, 57) = 2.32, p = 0.133,
Discussion
The present study investigated the effect of state anxiety and WMC on attention guided by WM content. On the behavioral level, we found a higher accuracy for the high-WMC groups than that for the low-WMC groups. For the EEG results, we found an N2pc and a Pd in the low-WMC and anxiety group, but neither N2pc nor Pd was found in the low-WMC and control group. A Pd was found in both the high-WMC and anxiety group and the high-WMC and control group, but N2pc was not found in the two groups. The results suggest that attention to WM content is suppressed in the high-WMC groups regardless of the anxiety or control context. However, the WM content distractor captured attention first followed by an active suppression in the low-WMC groups in the anxiety context, whereas there was neither attention capture nor attention suppression in the control context. The current study provides new evidence for the comprehensive effect of WM content on attention guidance.
We found a Pd component in the high-WMC groups in anxiety and control conditions and an N2pc in the low-WMC and anxiety group, but no N2pc in the low-WMC and control group. These results suggest that the high-WMC groups had better attention control abilities than the low-WMC groups, and the low-WMC groups were more vulnerable to the WM content matched with a distractor. Pd is a reliable index for attention suppression (Gaspelin & Luck, 2018; Sawaki & Luck, 2013), and N2pc is an index for attention capture (Hickey et al., 2006; Kerzel & Burra, 2020). On the one hand, a Pd component observed in the high-WMC groups indicated actively suppressed attention to WM content in the task that followed. This finding is consistent with previous studies. Fukuda and Vogel (2009) have shown that high-WMC individuals are much more capable of resisting attentional capture by a distractor than low-WMC individuals. Gaspar et al. (2016) found that the Pd amplitude is related to the ability of inhibition; that is, high-WMC individuals were able to suppress a salient distractor in time to prevent that item from diverting attention. Furthermore, high-WMC individuals could also control their attention toward task-related items even in a state of anxiety. A previous study suggested that low-WMC individuals were particularly vulnerable to the deleterious effects of anxiety, whereas high-WMC individuals were buffered against the deleterious effects of anxiety (Johnson & Gronlund, 2009). Moreover, anxiety could decrease the efficiency of attention control in low-WMC individuals but not in high-WMC individuals (Edwards et al., 2015). Therefore, state anxiety did not affect distractor suppression in the high-WMC group. All of the aforementioned studies combined indicate that high-WMC individuals have a better ability to control their attention according to task requirements (Vogel et al., 2005) and that they are less susceptible to state anxiety.
On the other hand, an N2pc was observed in the low-WMC group under anxiety conditions, suggesting that WM content-related distractors caught attention. This result is in line with previous studies showing that WM content influenced selective attention and captured attention (Burnham et al., 2014). Furthermore, our results showed that WM content-related attention capture is restricted to the low-WMC group in the anxiety context. Previous studies have shown that the effect of memory-driven attention capture is modulated by cognitive control (Woodman & Luck, 2007) and that anxiety could negatively affect the processing efficiency of shifting and inhibition functions (Berggren & Derakshan, 2013). Attention control ability could be impacted in an anxious state, leading to poor suppression of the WM-related distractor. Our EEG results in the low-WMC and anxiety group were consistent with previous findings, which suggest that attention control ability declines under anxiety in low-WMC individuals. For instance, a previous study found that state anxiety impaired attention control and that low-WMC individuals were worse at attention control in an anti-saccade task (Luo et al., 2017). An ERP study using the same experimental task provided further evidence that high-anxiety individuals exhibited lower ERP activity at the frontocentral and central recording sites compared with low-anxiety individuals (Ansari & Derakshan, 2011). Further, other electrophysiological evidence shows that greater anxiety predicted greater N2pc enhancement in visual search tasks with distractors (Moran & Moser, 2015).
An interesting result was that we observed a Pd followed an N2pc in the low-WMC group under anxiety conditions, indicating the active suppression of WM-related distractors after attention capture. This result is in line with the comprehensive effects of WM-related attention guides; that is, both attention capture and attention suppression could occur. A previous study has shown that attention can be actively terminated after attention capture by the task-relevant features, accompanied by the neural index of active suppression (Pd) after attention capture (N2pc) (Sawaki et al., 2012); another study also suggested that moderate anxiety had little negative effect but could benefit attention control in the anti-saccade task (Luo et al., 2017). In the current study, the Pd component was induced in the low-WMC and anxiety group but not in the low-WMC and control group despite the absence of interaction between WMC and anxiety. However, this result might indicate that moderate anxiety may promote attention control in low-WMC individuals. Similarly, Edwards et al. (2015) supported that anxiety could facilitate attention efficiency at the behavioral level. According to the attention control theory, low-WMC individuals invest more cognitive resources to ensure processing efficiency under anxiety (Eysenck et al., 2007; Johnson & Gronlund, 2009). In the present study, we explored the underlying effect of anxiety and WMC on attention guidance. We found that anxiety could be one of key factors for allowing low-WMC individuals to enhance attentional control. However, we did not find an N2pc in the low-WMC and control group, and the amplitudes of N2pc and Pd were small, which might be due to the fact that N2pc and Pd cancelled each other. Multiple studies have suggested that N2pc and Pd have similar topographies and are remarkably close in a given time window (Barras & Kerzel, 2017; Donohue et al., 2018; Sawaki & Luck, 2010). Furthermore, because the N2pc and Pd have opposite polarities and similar scalp distribution, these two components’ amplitudes would offset each other in the same time window (Sawaki & Luck, 2011).
There are a few important limitations in the present study. First, although we conducted a sample size calculation, there may not have been enough participants to obtain a stable effect size. Second, due to the limitation of the experimental paradigm, the N2pc and Pd components could have cancelled each other, which perhaps explains the nonsignificant interaction in the EEG results. Third, we only recruited healthy individuals, and it is possible that the results of the present study may not be generalizable to other groups such as those diagnosed with depression or anxiety. Fourth, although we measured the state anxiety levels before and after the modified change detection task, the anxiety scores returned to normal after EEG recording, indicating that the maintenance of anxiety level is shorter than the duration of the EEG session. Thus, the measurement time of state anxiety should be increased in the middle of the task in future studies.
In summary, the current study found that the attention guided by WM content could be actively suppressed in high-WMC individuals regardless of the context (anxiety or control), whereas the WM content captures attention and is actively suppressed in low-WMC individuals in the anxiety context. These results suggest that whether WM content guides attention or actively suppresses depends on the WMC and anxiety level of the individual. Our findings support the comprehensive view of attention guidance, that both attention guidance and attention suppression could happen simultaneously, and suggest that state anxiety is a key mechanism underlying attention control in low-WMC individuals. WMC and anxiety should be considered in future studies investigating the influence of WM content on guiding attention.
Footnotes
Acknowledgments
We thank Guizhou Province science and technology department and Guizhou Provincial Department of Education for funding support. We also thank all the participants recruited into the experiments that we contacted without whom this research would not be possible.
Declaration of conflicting interests
The author(s) declared the following potential conflicts of interest with respect to the research, authorship, and/or publication of this article: No conflict of interest exits in the submission of this manuscript, and the manuscript is approved by all authors for publication. I would like to declare on behalf of my co-authors that the work described was original research that has not been published previously, and not under consideration for publication elsewhere, in whole or in part. All the authors listed have approved the manuscript that is enclosed.
Funding sources
The author(s) disclosed receipt of the following financial support for the research, authorship, and/or publication of this article: This study was supported by the Guizhou Provincial Department of Education Youth Science and Technology Talent Growth Project (Grant for Luo Yu: Qianjiaohe KY zi [2018] 132).