
Abstract
Background:
Osteoporotic fractures are a significant global health concern, leading to disability and reduced quality of life. Existing diagnostic tools, such as dual-energy X-ray absorptiometry (DXA) and the Fracture Risk Assessment Tool, have limitations, such as dependence on structured datasets and difficulty identifying all high-risk individuals.
Objectives:
This study aimed to develop and validate an AI-enabled chest X-ray (AI-CXR) model for predicting osteoporotic fracture risk, offering a noninvasive, accessible alternative.
Design:
This is a retrospective study.
Methods:
This study analyzed 166,571 CXR from 78,548 patients in Taiwan, with internal validation on 31,977 X-rays and external validation on 36,677 X-rays. The datasets were divided into groups with and without T-scores. Radiological features such as costophrenic angle blunting and degenerative joint disease were extracted and incorporated into the predictive framework. The model’s performance was assessed using concordance indices, calibration curves, and stratified risk analyses, and compared to DXA-based T-scores.
Results:
The AI-CXR model demonstrated superior predictive accuracy compared to DXA, particularly for patients without T-scores (internal validation: concordance index 0.896 vs 0.829; external validation: 0.778 vs 0.818). Among high-risk groups identified by AI-CXR, the 5-year fracture incidence was significantly higher than in low-risk groups (internal: 2.6% vs 0.3%, hazard ratio (HR): 2.01; external: 3.5% vs 0.5%, HR: 2.34). Key radiological features were more prevalent in high-risk groups, including costophrenic angle blunting and degenerative joint disease. Stratified analysis revealed consistent performance across various demographic subgroups, such as gender and age categories.
Conclusion:
The AI-CXR model provides a cost-effective, noninvasive tool for osteoporotic fracture risk assessment, enabling improved early detection and personalized intervention across diverse clinical settings.
Introduction
Global new fractures, including traumatic fractures and osteoporotic fractures, increased by 33.4% since 1990, reaching 178 million in 2019, creating a significant global burden. 1 In particular, osteoporotic fractures often lead to disability, reduced quality of life, and even death. 2 In Europe, the impact of osteoporotic fractures on disability-adjusted life years exceeds that of most common cancers, excluding lung cancer. 3 However, effective treatments for fractures, such as antiresorptive drugs and bone-forming agents, can lower the risk of osteoporotic fractures by up to 87%, decreasing healthcare and societal burdens.4,5 Dual-energy X-ray absorptiometry (DXA) is used to measure bone mineral density (BMD), with the T-score indicating how much a patient’s bone density deviates from that of a healthy young adult. Figure 1 illustrates chest X-ray imaging of patients with T-scores < −2.5, highlighting osteoporosis-related structural changes. A T-score ⩽ −2.5 suggests osteoporosis and a high fracture risk, but studies show that 60% of osteoporotic fractures occur in individuals with T-scores above this threshold, highlighting the need for more comprehensive risk assessment methods beyond T-scores alone.6–8 Therefore, there is a need for more comprehensive and accurate methods to identify individuals at risk of osteoporotic fractures, beyond relying on T-scores. In addition, DXA is not widely accessible in all care settings and may fail to detect individuals at risk if no scan is performed.

Osteoporosis X-ray images with associated T-scores and severity levels. (a) Case a with a measured T-score of −4.8. (b) Case b with a measured T-score of −5.0.
To address fracture risk more comprehensively, tools such as Fracture Risk Assessment Tool (FRAX) have been developed to estimate the 10-year probability of osteoporotic fractures using demographic, clinical factors, and T-scores.9,10 While FRAX provides valuable insights, it requires complete and structured datasets, which are often unavailable in real-world clinical settings, and its reliance on self-reported or manually entered data reduces its accuracy and scalability. Moreover, FRAX may miss high-risk individuals when critical clinical information is incomplete or missing. These challenges underscore the urgent need for an innovative, adaptable risk assessment solution that can integrate diverse and incomplete datasets to improve osteoporotic fractures prevention. Its reliance on self-reported or manually entered data also limits scalability and accuracy, especially when key information is missing.
A promising strategy for enhancing osteoporosis management is opportunistic screening, which has gained significant attention in recent years. 11 Unlike systematic screening, opportunistic screening identifies at-risk individuals during routine clinical care, often relying on incidental findings from imaging studies. Radiology provides an ideal setting for such screening, as radiologists can identify subtle signs of osteoporosis on chest X-rays (CXR). 11 These often include structural changes such as thoracic vertebral height loss, wedge-shaped deformities, and altered costovertebral angles. These anatomical regions are frequently involved in osteoporotic changes, particularly vertebral compression fractures, and can be detected on routine chest radiographs. 12 Recent advances in artificial intelligence (AI) have further elevated the potential of this approach, with deep learning models demonstrating remarkable accuracy in identifying osteoporosis. 13 Studies have shown AI-enabled CXR (AI-CXR) achieves an area under the receiver operating characteristic curve (AUC) of over 90% for chest and abdominal X-rays,14–16 and even higher when using computed tomography. 17 These advancements enable early detection and risk stratification for osteoporotic fractures, guiding timely interventions and preventing fractures. This study aims to develop an AI-CXR model to address the limitations of current tools by predicting osteoporotic fractures, providing a novel solution for improving osteoporotic fracture prevention.
Materials and methods
Data collection
This study was conducted in accordance with the Strengthening the Reporting of Observational Studies in Epidemiology (STROBE) guidelines. 18 The Institutional Review Board (IRB NO. C202305019), at Tri-Service General Hospital in Taipei, Taiwan, approved this retrospective study. Data were obtained from the Tri-Service General Hospital database in Neihu District (Hospital A: an academic medical center) and the Tingzhou Branch Hospital in Zhongzheng District database (Hospital B: a community hospital), covering the period from April 2011 to February 2020. The database included a total of 178,639 patients, with 141,962 from Hospital A and 36,667 from Hospital B, as shown in Figure 2. Patients included in the study were required to be over 20 years old and had at least once undergone a posteroanterior (PA) CXR. Relevant radiological findings, demographic characteristics, clinical history, and laboratory information were also included. To confirm the osteoporotic fractures were new, we excluded patients with a history of fractures or those using osteoporosis-related medications, including bisphosphonate, SERM, denosumab, romosozumab, and parathyroid hormone.

Construction of development, tuning, internal, and external validation sets. Patients were selected from an academic medical center and a community hospital, with exclusion criteria applied. The development set was used for training, the tuning set for model optimization, and the validation sets (main and secondary) for performance evaluation, ensuring no overlap between datasets.
The Hospital A database, which included 141,962 patients, was divided into a development set, a tuning set, and an internal validation set. The development set consisted of 166,571 CXRs from 78,548 patients for training the deep learning model (DLM). The tuning set included 31,437 patients and 67,126 CXRs, playing an important role in optimizing the model’s parameters during training. To evaluate model accuracy, the internal validation set was used, consisting of the first recorded CXR from 31,977 patients, totaling 31,977 CXRs. To assess the generalizability of our DLM, we used data from Hospital B with 36,677 patients who were selected following the same criteria as the internal validation set to ensure consistency. To ensure dataset independence, patients included in the internal and external validation sets were not present in the development or tuning sets. Since most patients lacked T-score values, the internal and external validation sets were split into a main group with T-scores (2350/1227 patients, respectively) and a secondary group without T-scores (29,627/35,450 patients, respectively).
Patient information
Patients’ demographic data, including age, gender, height, weight, and BMI, were collected, and a partial group of patients who underwent a DXA examination had T-score values. In addition, patients’ disease histories from the hospital database were identified by the International Classification of Diseases (ICD) codes, 19 including diabetes mellitus (ICD-9: 250.x; ICD-10: E11.x), hypertension (ICD-9: 401.x–404.x; ICD-10: I10.x–I16.x), chronic kidney disease (ICD-9: 585.x; ICD-10: N18.x), hyperlipidemia (ICD-9: 272.x; ICD-10: E78.x), Rheumatoid arthritis (ICD-9: 714.0–714.9; ICD-10: M06.0–M06.9), hyperparathyroidism (ICD-9: 242.0–242.9; ICD-10: E21.0–E21.3), hyperthyroidism (ICD-9: 255.0; ICD-10: E05.0–E05.9), cushing disease (ICD-9: 255.0; ICD-10: E24.0–E24.9), celiac disease (ICD-9: 579.0; ICD-10: K90), and steroid (ICD-9: V58.65; ICD-10: Z79.52). Furthermore, secondary osteoporosis is defined as a condition in which a patient has at least one of the specified conditions, such as hyperparathyroidism, hyperthyroidism, Cushing disease, or celiac disease.
Our data contain 31 radiological annotations were determined by radiologists for each CXR report, such as consolidation change, pneumonia, emphysematous change, pneumothorax, atelectasis, scalloping of the diaphragm, costophrenic angle blunting, pleural effusion, atherosclerosis, cardiomegaly, prominence of hilar shadow, pulmonary edema, aneurysm, degenerative joint disease, fracture, spondylosis, osteophyte formation, osteoporosis, osteoarthritis, widening of the mediastinum, malignancy, inflammatory, pigtail or drainage, sternotomy, port a implantation, perm catheter insertion, pacemaker, tracheostomy, vertebroplasty, endotracheal tube, and nasogastric tube.
Outcomes
In this research, osteoporotic fractures predicted by the model were considered the primary outcome. According to different data, we also created three subgroups in the internal sets and the external set: (1) for patients with T-scores, the predicted values of osteoporotic fractures were classified as low or high risk by the model. (2) for patients with T-scores, the model’s predictions for osteoporotic fractures were analyzed based on DXA-measured T-scores, categorizing them as >−2.5 or <−2.5. (3) For patients without T-scores, the model’s predicted values for osteoporotic fractures were classified into low- and high-risk groups.
Implementation of the deep learning and machine learning models
Figure 3 illustrates the overall data processing and prediction workflow, including image acquisition, feature extraction, and risk score modeling. In this study, DICOM-format CXR images with resolutions above 2000 × 2000 pixels. Feature extraction in this study relied on CheXzero, 20 a self-supervised model that integrates a Vision Transformer (ViT-B/32) as the image encoder, trained on CXR images and their paired radiological reports. Each chest X-ray was resized by scaling the shorter edge to 256 pixels while maintaining the aspect ratio, followed by center cropping to 256 × 256 pixels. The ViT-B/32 model, with 12 transformer layers and 12 attention heads, processed these images to extract high-dimensional visual representations. The final 512-dimensional feature embeddings were generated from the class token and used for fracture risk prediction. The pretrained weights “best_64_0.0001_original_35000_0.864” were used without further adjustment. A Cox regression model was used to estimate the risk of incident osteoporotic fractures,21,22 using the image-derived AI-CXR feature vectors as input. Depending on the analysis group, additional covariates such as demographic characteristics or DXA-based information were also included to generate the final CXR-risk score. Implementation was carried out in Python (version 3.10.10) using the “torch” library (version 2.0.1).

Data processing and prediction pipeline for CXR-risk score calculation. The process includes pre-processing by resizing the shorter edge to 256 pixels while maintaining the aspect ratio, followed by center cropping to 256 × 256 pixels, feature extraction using a Vision Transformer (ViT-B/32) to obtain 512-dimensional features, and risk score computation using a Cox regression model to predict osteoporotic fracture risk.
We implemented XGBoost (eXtreme Gradient Boosting) training on the same datasets as the DLM to develop a predictive model for osteoporotic fractures. Patient demographics and radiological labels were fully integrated into the machine learning algorithm. Training was performed in R (xgboost version 0.71.2) with default parameters. By integrating DLM outputs with patient data, the XGBoost model generated refined predictions. Accuracy levels from both approaches were compared, demonstrating the benefits of combining deep learning and machine learning methodologies.
Statistical analysis
Descriptive statistics such as means, standard deviations, counts, and percentages were used to describe the demographic distribution across different datasets. Continuous variables were compared using Student’s t-test, with the results expressed as mean ± SD. Categorical variables were analyzed with the χ2 test or Fisher’s exact test, depending on the suitability. Kaplan-Meier (KM) survival curves were constructed to evaluate the time-to-event performance of the DLM in predicting new osteoporotic fractures, 23 while the concordance index (C-index) was used to quantify its discriminatory ability. 24 A higher C-index indicates better discriminatory performance, reflecting how well the predicted risk aligns with actual fracture occurrences over time. Calibration curves were constructed to assess the agreement between predicted probabilities and observed outcomes, providing an additional measure of the model’s reliability. Risk thresholds for low and high categories were identified by analyzing the 5-year incidence of osteoporotic fractures, with optimal values derived from Youden’s index and F-score in the tuning set, 25 with −0.193 identified as the optimal threshold. All analyses compared the model’s predictions for new osteoporotic fractures in the main group (with T-scores) against DXA-measured T-scores, as well as the model’s predictions for new osteoporotic fractures in the secondary group (without T-scores). All statistical analyses were conducted using R version 3.4.4, and p-values below 0.05 were considered statistically significant.
Results
Table 1 describes the demographic characteristics across the development, tuning, internal validation, and external validation sets. In the development set, the mean T-score was −0.0 ± 1.6, with 4555 patients (5.8%) having T-scores > −2.5, 331 (0.4%) having T-scores ⩽ −2.5, and 73,662 (93.8%) missing T-score values. In the tuning set, the mean T-score was −0.1 ± 1.6, with 1860 patients (5.9%) having T-scores > −2.5, 150 (0.5%) having T-scores ⩽ −2.5, and 29,427 (93.6%) missing T-score values. In the internal validation set, the mean T-score was 0.1 ± 1.6, with 2221 patients (6.9%) having T-scores > −2.5, 129 (0.4%) having T-scores ⩽ −2.5, and 29,627 (92.7%) missing T-score values. In the external validation set, the mean T-score was −0.3 ± 1.7, with 1105 patients (3.0%) having T-scores > −2.5, 122 (0.3%) having T-scores ⩽ −2.5, and 35,540 (96.7%) missing T-score values. The demographic distribution by T-score groupings in the internal and external validation sets is presented in Supplemental Extended Data Table 1.
Demographic characteristics.

Patients in the tuning set were categorized into low- and high-risk groups based on cutoff values determined by maximum Youden’s index and F-scores. Figure 4 presents KM survival curves illustrating the cumulative incidence of osteoporotic fractures across sub-datasets, including patients with T-scores grouped by AI-CXR risk (Main), DXA-measured T-scores (DXA), and patients without T-scores grouped by AI-CXR risk (Secondary). In the internal validation set, among patients with T-scores grouped by AI-CXR risk, fracture incidences were 2.0% at 2 years and 4.2% at 5 years in the high-risk group, with no significant difference from the low-risk group (0.0% at 2 and 5 years; HR: Inf, 95% CI: 10.84–26.28). For DXA-based groups, incidences were 1.8% and 4.3% at 2 and 5 years in the T-score ⩽ −2.5 group, with no significant difference from the T-score > −2.5 group (0.2% and 0.4%; HR: 2.19, 95% CI: 0.46–10.40). Conversely, for patients without T-scores, AI-CXR high-risk predictions had significantly higher incidences (1.1% and 2.6% at 2 and 5 years) than low-risk predictions (0.1% and 0.3%; HR: 2.01, 95% CI: 1.26–3.21). AI-CXR risk stratification showed predictive performance, with a C-index of 0.978 in the internal validation set and 0.818 in the external validation set for patients with T-scores, 0.896 and 0.778 for DXA-measured T-scores, and 0.829 and 0.818 for patients without T-scores, respectively, reinforcing its role in fracture risk prediction. External validation showed similar trends. While DXA groupings yielded no significant results, AI-CXR risk predictions revealed a clear dose-response relationship, emphasizing its prognostic value for osteoporotic fractures.

Long-term incidence of osteoporotic fractures stratified by AI-CXR predicted risk and DXA-measured T-scores. The analysis is performed on both internal and external validation sets. The plots depict cumulative incidences over a 5-year period for high-risk and low-risk groups stratified by AI-CXR predicted risk (Main), DXA-measured T-scores (DXA), and AI-CXR predicted risk for patients without T-scores (Secondary). The C-index is provided in each plot as a measure of discriminatory performance. The tables below each plot show the population at risk, event rates, and cumulative incidences at specified time intervals. Adjusted HRs for each subgroup comparison are provided, highlighting the prognostic value of AI-CXR in predicting fracture progression.
In the full-sample internal validation set, radiological diseases were significantly more prevalent in the high-risk group than in the low-risk group. Notably, conditions such as costophrenic angle blunting, atherosclerosis, cardiomegaly, degenerative joint disease, spondylosis, osteophyte formation, osteoporosis, osteoarthritis, widening of the mediastinum, and inflammatory changes were more common in the high-risk group, as summarized in Table 2. A comparable distribution was observed in the external validation set for the entire sample. Supplemental Extended Data Figure 1(A) highlights the relative importance of these radiological features, with costophrenic angle blunting and atherosclerosis ranking prominently, alongside patient characteristics such as age. Supplemental Extended Data Figure 1(B) further demonstrates that models integrating both patient characteristics and radiological features achieved superior predictive performance compared to models using either input alone. Supplemental Extended Data Table 2 further details the distribution of radiological diseases in both internal and external validation sets stratified by T-score categories. Similar trends were identified when analyzing patients with and without T-scores separately, as outlined in Supplemental Extended Data Tables 3 and 4.
Radiological characteristics in internal and external validation set.
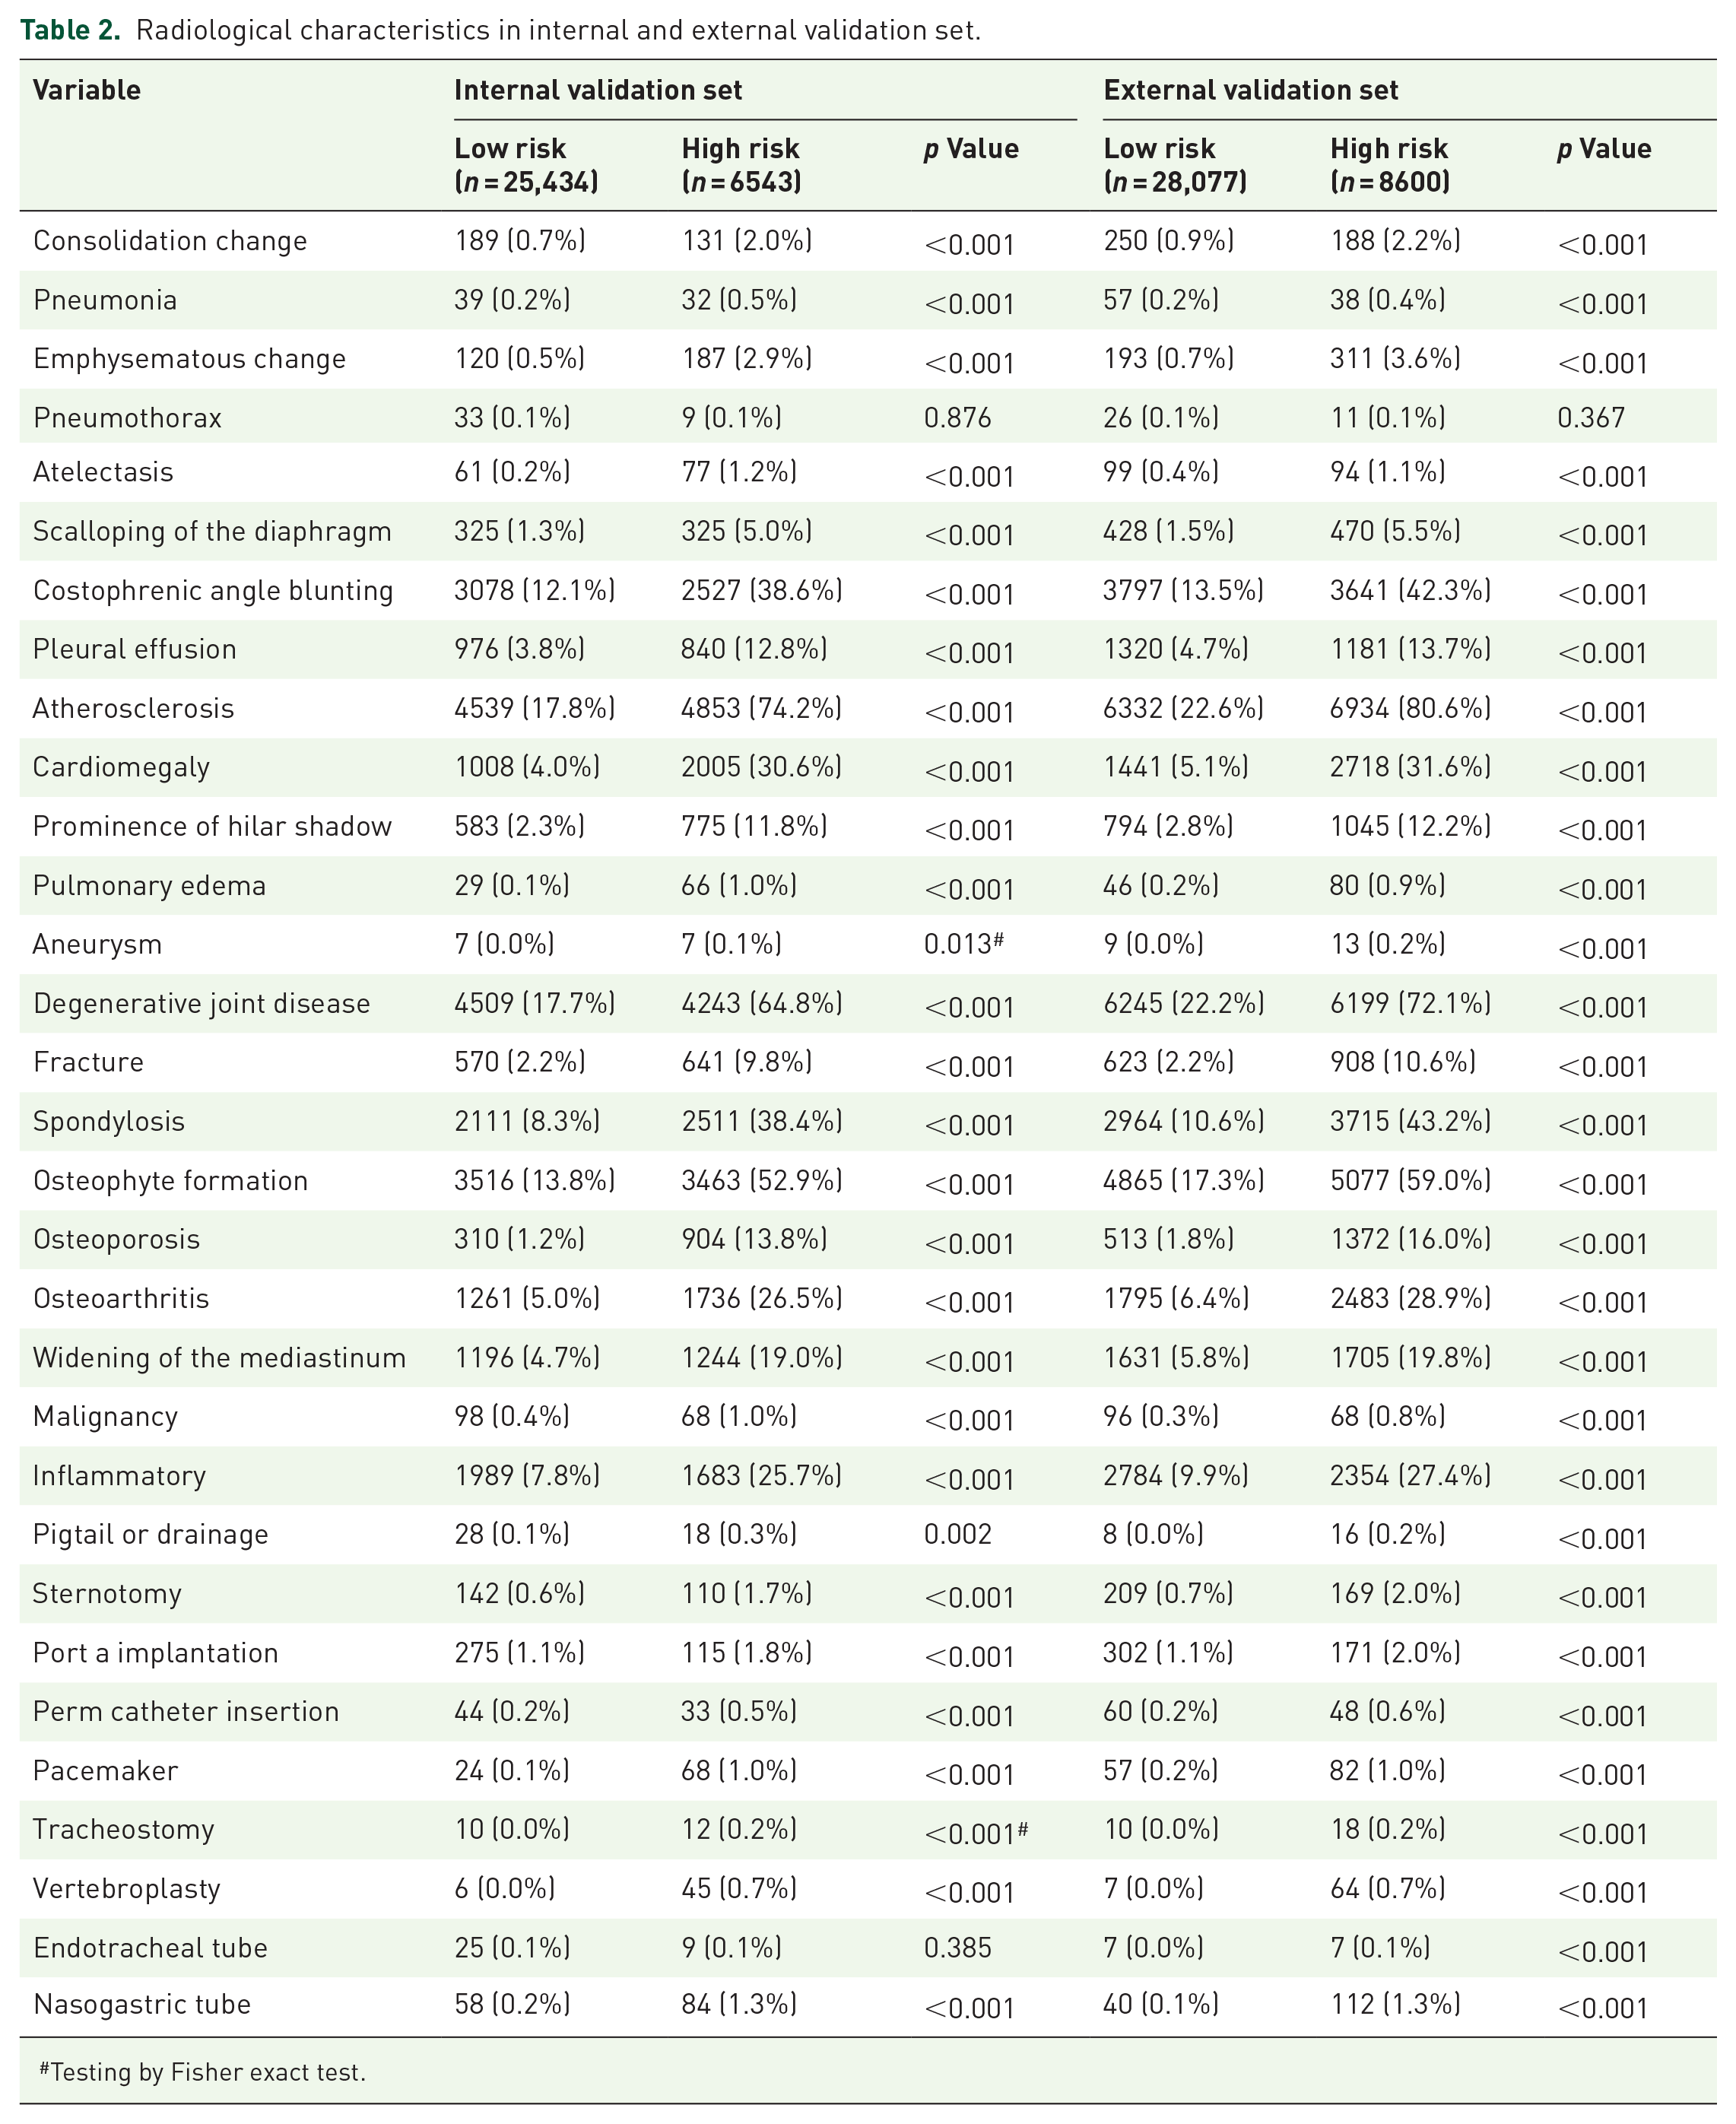
Testing by Fisher exact test.
We assessed model performance by first stratifying patients by gender or age group, followed by grouping based on AI-CXR predicted risk (with and without T-scores) and DXA-measured T-scores. This stratified analysis also included model performance on all samples, with summary metrics displayed in Figure 5 and detailed incidence trends shown in Figure 4. The following subgroup results further demonstrate the consistency of the AI-CXR model’s performance across different patient demographics. For the internal validation set, AI-CXR showed strong performance with a C-index of 0.963 for females, while DXA yielded lower C-index values for the same subgroup. Age-stratified analysis revealed that AI-CXR maintained robust predictive capability in younger age groups (<60 years) with a C-index of 0.993, which decreased slightly in older age groups. In the external validation set, AI-CXR continued to outperform DXA in most subgroups, with females achieving a C-index of 0.824 compared to males at 0.858, as shown in Figure 5.
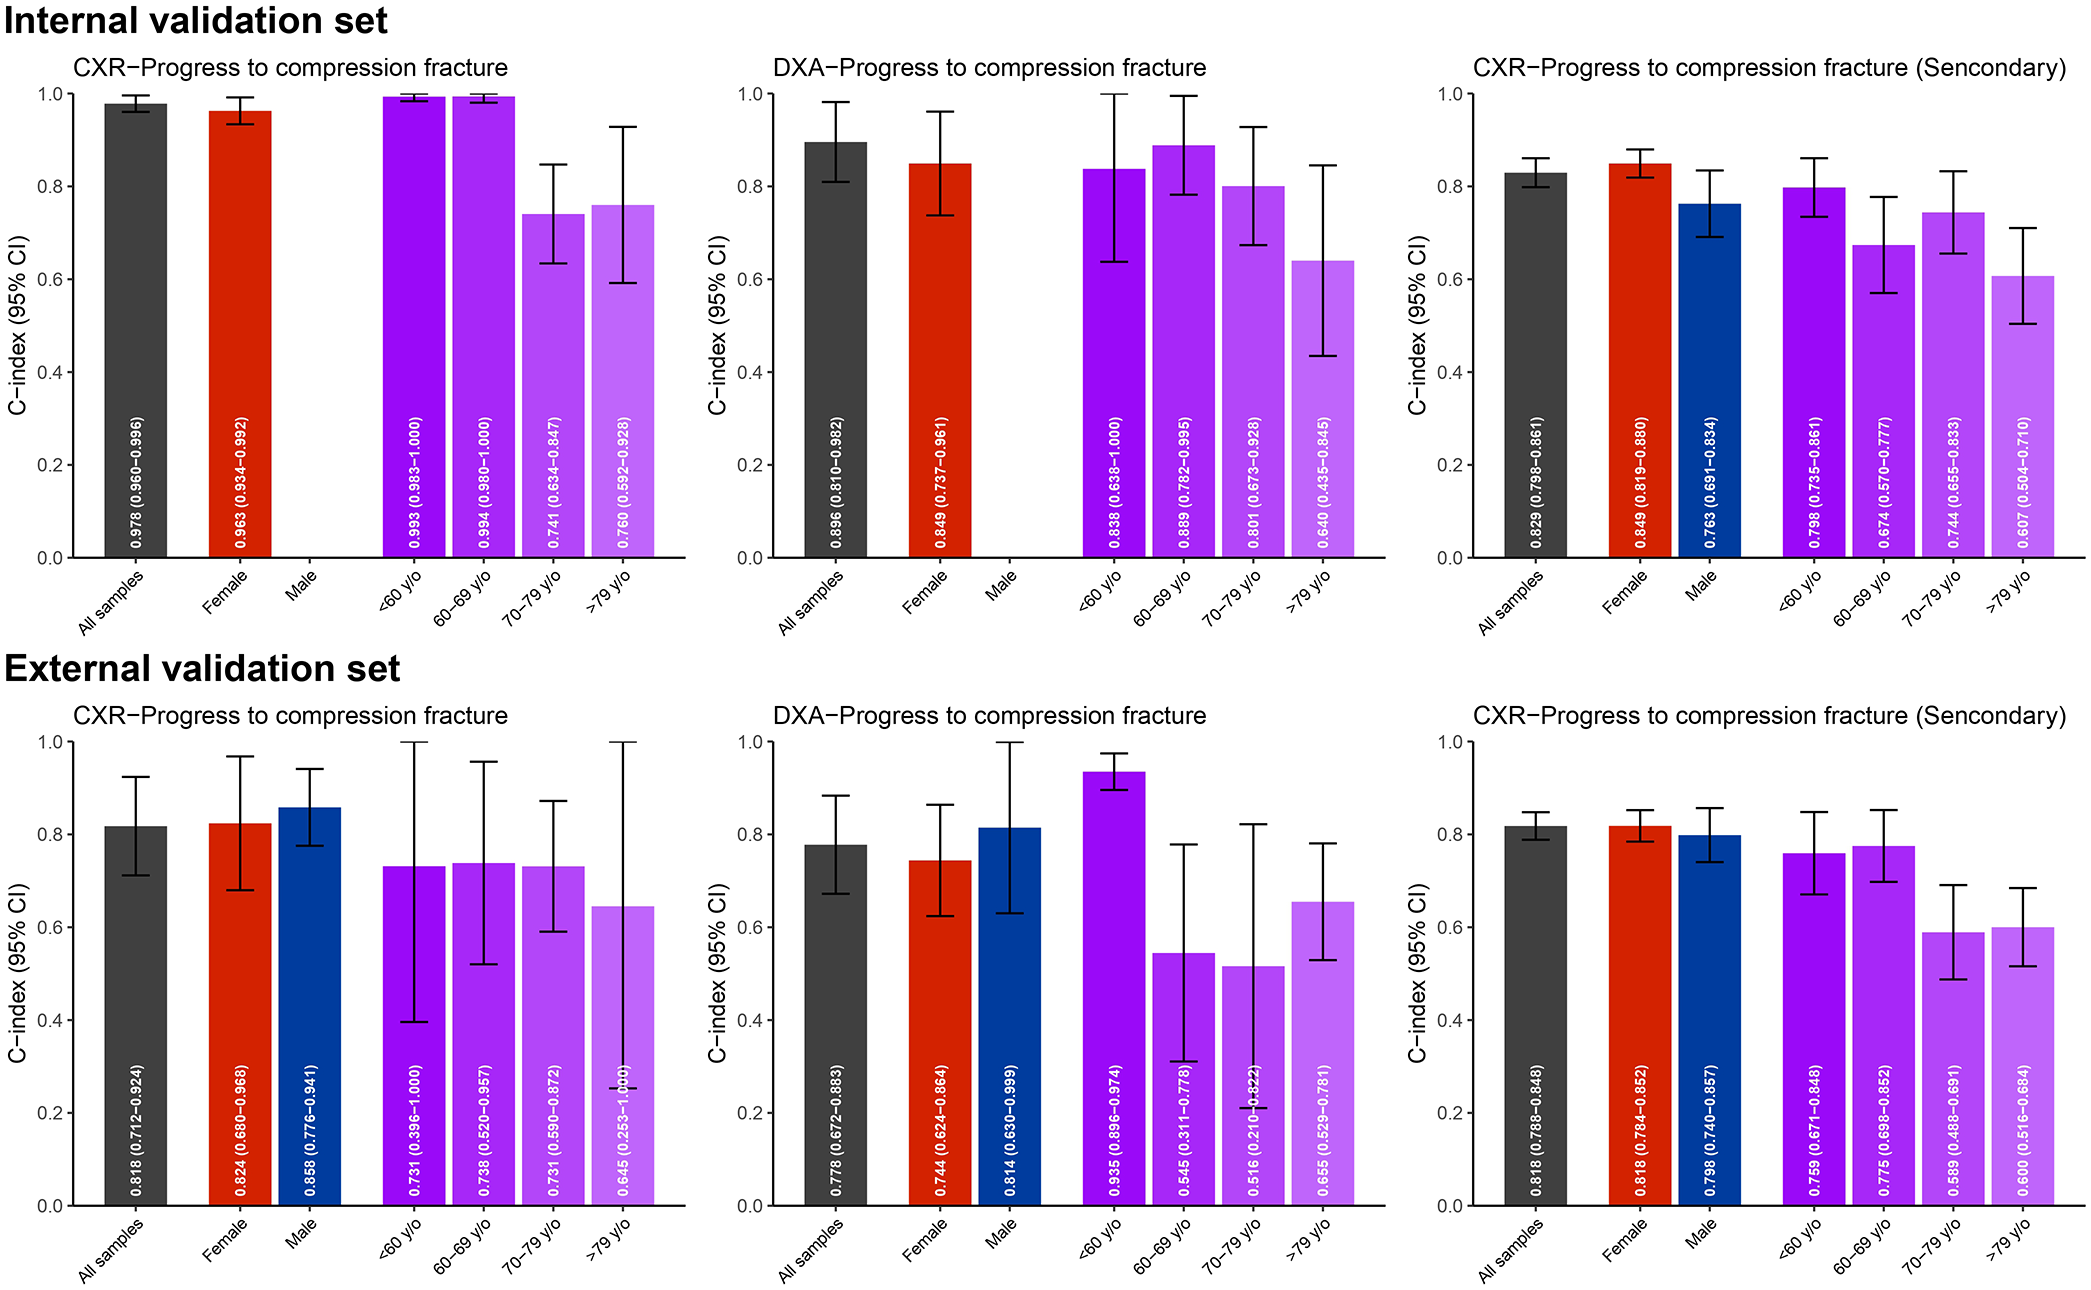
Stratified analysis of model performance in predicting progression to compression fractures. Bar charts with error bars representing the concordance indices (C-index) and 95% confidence intervals (CI) are shown for both internal and external validation sets. The analysis evaluates performance across stratifications by gender (red for females, blue for males) and age groups (shades of purple representing <60, 60–69, 70–79, and >79 years). Predictive models include AI-CXR predicted risk with T-scores (Main), DXA-measured T-scores (DXA), and AI-CXR predicted risk without T-scores (Secondary).
The calibration curves in Figure 6 showed that AI-CXR predictions closely aligned with observed fracture risks, while DXA tended to deviate, particularly at higher probabilities. This trend was consistent across both internal and external validation sets. For patients without T-scores, the secondary AI-CXR model showed reasonable calibration, with slight overestimation at high probability levels.

Calibration curves for predicting progression to compression fractures using AI-CXR and DXA models. The calibration curves illustrate the relationship between predicted probabilities and actual probabilities for compression fracture progression in the internal and external validation sets. The analyses are stratified into three subgroups: AI-CXR predicted risk with T-scores (Main), DXA-measured T-scores (DXA), and AI-CXR predicted risk without T-scores (Secondary). The dashed diagonal line represents perfect calibration, where predicted probabilities match actual probabilities. Calibration is assessed for both AI-CXR and DXA models, highlighting differences in predictive performance across validation sets.
Discussion
In this study, we developed and validated an AI-CXR model to predict the risk of osteoporotic fractures. Our findings highlight the AI-CXR model’s ability to accurately stratify patients into risk categories, demonstrating significant predictive value in both internal and external validation sets. The AI-CXR model also revealed critical radiological features associated with high fracture risk, such as costophrenic angle blunting, atherosclerosis, and degenerative joint disease. Notably, the model's performance surpassed traditional DXA-based assessments, as evidenced by higher concordance indices and robust calibration. These results emphasize the transformative role of AI-CXR in osteoporosis management, offering a scalable, cost-effective, and noninvasive method for early detection and risk stratification of osteoporotic fractures. The expected linear relationship may not be fully observed due to variability in bone quality, comorbidities, age, and lifestyle factors. In addition, unlike models relying solely on BMD, AI-CXR captures broader radiological features, which may contribute to nonlinearity. As a time-to-event analysis, censoring effects could also influence trends, as some high-risk patients may not have experienced fractures within the study period. Nonetheless, the AI-CXR model demonstrated strong predictive performance in stratifying fracture risk.
Our AI-CXR model can accurately predict osteoporotic fracture progression using a single CXR, with consistent results across risk categories. This is understandable since CXRs can capture important features, and many AI-CXR models have shown better performance than experts in detecting systemic diseases. AI-CXR models, which outperform radiologists in detecting osteoporosis, measuring bone density, and predicting future mortality events, demonstrate the potential of AI in advancing disease prediction through radiological imaging.14,26,27 Although prior studies have demonstrated the feasibility of using CXR-based AI models for osteoporosis risk stratification, 28 most focused on BMD prediction rather than actual fracture outcomes.29,30 Recent studies have also evaluated the diagnostic performance of machine learning and deep learning models in identifying vertebral fractures across various imaging modalities, such as spinal radiographs and CT. 31 The performance of our AI-CXR model complements these findings by extending fracture risk prediction to standard chest radiographs, supporting its use as a scalable and noninvasive tool for early identification in routine clinical workflows.
The predictive performance of the AI-CXR model in identifying osteoporotic fractures is strongly associated with established risk factors and radiological features. In this study, patients classified as high-risk by the AI-CXR model had a significantly higher prevalence of findings such as costophrenic angle blunting, pleural effusion, and degenerative joint disease compared to lower-risk groups. Costophrenic angle blunting, often caused by pleural effusion, 32 reflects fluid accumulation in the pleural cavity and can result from conditions like heart failure, infections, or malignancies.33,34 These underlying conditions often contribute to decreased mobility and overall health decline, both of which are known risk factors for osteoporotic fractures. 35 Similarly, degenerative joint disease, commonly associated with aging, reduces physical activity due to pain and impaired joint function, increasing the likelihood of falls and fractures.36,37 While these features are not direct indicators of osteoporotic fractures, they are linked to systemic conditions that elevate fracture risk. By integrating these contributing factors into its risk stratification, the AI-CXR model provides a comprehensive approach to identifying patients at higher risk, reinforcing its value for early detection and effective management of osteoporotic fractures in clinical practice.
Our study demonstrates that the AI-CXR model we developed requires only a single CXR, addressing the limitations of FRAX, which relies on multiple structured data inputs for osteoporotic fracture risk stratification. 9 This suggests that AI may detect features that are imperceptible to human observers. Similarly, using T-scores measured by DXA to assess osteoporotic fractures may result in cases where patients with T-scores greater than −2.5 still experience osteoporotic fractures.38,39 This study also shows that T-score measurements are less effective than the AI-CXR model, with similar results validated in subsets of data without T-scores. This highlights how AI-CXR overcomes the limitations of assessing patients who have not undergone DXA. Moreover, different international organizations currently define osteoporotic fracture risk categories differently, indicating that osteoporotic fractures cannot be attributed to a single factor.40–43 This highlights AI’s ability to simplify the classification of osteoporotic fracture risk categories effectively. These findings underscore the transformative potential of AI-CXR in providing a unified, efficient, and accurate approach to osteoporotic fracture risk assessment, paving the way for broader clinical adoption and improved patient outcomes.
Nonetheless, several limitations must be acknowledged. First, the data originate from a single healthcare system in Taiwan, which may affect generalizability. Although external validation was conducted at a separate hospital, broader applicability requires further testing across international and multi-institutional datasets. Second, the imbalance between patients with and without T-scores could influence subgroup performance. We addressed this issue by conducting stratified analyses to assess model robustness. Third, the model’s black-box nature may hinder clinical adoption. 44 Future work should prioritize improving interpretability through techniques such as Grad-CAM and SHAP. Overall, the AI-CXR model shows promise for osteoporosis risk stratification, but it requires validation across diverse populations and clinical settings, as well as prospective studies to support real-world implementation.
Conclusion
In conclusion, this study demonstrates the potential of the AI-CXR model as a practical and effective tool for predicting osteoporotic fracture progression using a single chest X-ray. The model provides reliable and consistent risk stratification, outperforming DXA by eliminating the need for additional tests and FRAX by avoiding reliance on structured datasets or self-reported data. Its noninvasive, cost-effective nature makes it accessible for routine clinical use. With further validation, the AI-CXR model could significantly enhance clinical decision-making and optimize healthcare resource allocation.
Supplemental Material
sj-docx-1-tab-10.1177_1759720X251357157 – Supplemental material for Deep learning meets chest X-rays: a promising approach for predicting future compression fracture risk
Supplemental material, sj-docx-1-tab-10.1177_1759720X251357157 for Deep learning meets chest X-rays: a promising approach for predicting future compression fracture risk by Kai-Chieh Chen, Shan-Yueh Chang, Yuan-Ping Chao, Dung-Jang Tsai, Wei-Chou Chang, Yu-Shiou Weng, Chin Lin and Wen-Hui Fang in Therapeutic Advances in Musculoskeletal Disease
Supplemental Material
sj-docx-2-tab-10.1177_1759720X251357157 – Supplemental material for Deep learning meets chest X-rays: a promising approach for predicting future compression fracture risk
Supplemental material, sj-docx-2-tab-10.1177_1759720X251357157 for Deep learning meets chest X-rays: a promising approach for predicting future compression fracture risk by Kai-Chieh Chen, Shan-Yueh Chang, Yuan-Ping Chao, Dung-Jang Tsai, Wei-Chou Chang, Yu-Shiou Weng, Chin Lin and Wen-Hui Fang in Therapeutic Advances in Musculoskeletal Disease
Footnotes
References
Supplementary Material
Please find the following supplemental material available below.
For Open Access articles published under a Creative Commons License, all supplemental material carries the same license as the article it is associated with.
For non-Open Access articles published, all supplemental material carries a non-exclusive license, and permission requests for re-use of supplemental material or any part of supplemental material shall be sent directly to the copyright owner as specified in the copyright notice associated with the article.