
Abstract
Background:
Despite being the gold standard for diagnosing osteoporosis, dual-energy X-ray absorptiometry (DXA) is an underutilized screening tool for osteoporosis.
Objectives:
This study proposed and validated a controllable feature layer of a convolutional neural network (CNN) model with a preprocessing image algorithm to classify osteoporosis and predict T-score on the proximal hip region via simple hip radiographs.
Design:
This was a single-center, retrospective study.
Methods:
An image dataset of 3460 unilateral hip images from 1730 patients (age ⩾50 years) was retrospectively collected with matched DXA assessment for T-score for the targeted proximal hip regions to train (2473 unilateral hip images from 1430 patients) and test (497 unilateral hip images from 300 patients) the proposed CNN model. All images were processed with a fully automated CNN model, X1AI-Osteo.
Results:
The proposed screening tool illustrated a better performance (sensitivity: 97.2%; specificity: 95.6%; positive predictive value: 95.7%; negative predictive value: 97.1%; area under the curve: 0.96) than the open-sourced CNN models in predicting osteoporosis. Moreover, when combining variables, including age, body mass index, and sex as features in the training metric, there was high consistency in the T-score on the targeted hip regions between the proposed CNN model and the DXA (r = 0.996, p < 0.001).
Conclusion:
The proposed CNN model may identify osteoporosis and predict T-scores on the targeted hip regions from simple hip radiographs with high accuracy, highlighting the future application for population-based opportunistic osteoporosis screening with low cost and high adaptability for a broader population at risk.
Trial registration:
TMU-JIRB N201909036.
Introduction
Osteoporosis is a common systemic skeletal disorder that leads to low bone mass and increased risk of fragility fractures. 1 Hip fracture is the most debilitating among all fragility fractures, resulting in chronic pain, loss of independence, 2 decreased quality of life, 3 and high mortality following hip fracture surgery. 4 The classification of osteoporosis is defined by the lowest bone mineral density (BMD) on the axial bone, including spine and bilateral hip regions. 5 However, BMD on the proximal hip area is especially critical to directly reflect the future risk of hip fracture. 6 Dual-energy X-ray absorptiometry (DXA) is the golden standard and most extensively used method for BMD measurement in the hip and spine regions. 5 Nevertheless, to screen osteoporosis, DXA lacks the minimum service requirement, as the geographic availability and associated utilization of DXA are inadequate, especially for rural residents. 7 It is of utmost significance to develop other reliable and easily accessible methods to identify the risk of osteoporosis at the hip besides DXA assessment.
The hip radiographs may be informative for screening osteoporosis. The Singh index (SI), a six-graded classification system for bone density of the proximal femoral neck based on the visibility of the trabecular types and arrangement, is a simple grading system for diagnosing osteoporosis with plain radiographs. 8 The SI directly reflects the osteoporotic grading of the proximal femur and potentially predicts the future risk of hip fracture; however, it is highly subjective by clinicians with fair inter- and intra-observer agreement.9,10 Recently, deep learning (DL) algorithms have illustrated remarkable progress in developing a screening tool for osteoporosis based on simple hip radiographs11–15; however, these were limited to using DL for only identifying osteoporosis rather than further predicting the T-score on the targeted region owing to the inappropriate object detection results with methodological flaws.
Hence, this study aims to propose and validate a fully automated convolutional neural network (CNN) model (X1AI-Osteo) to (i) segment the bony contour of the proximal hip as the region of interests (ROIs), (ii) classify osteoporosis, and (iii) directly predict the T-score on the proximal femur from a single hip radiograph (Figure 1). Furthermore, the classification of osteoporosis and predicted T-score by DL are compared with the results assessed by DXA on the targeted hip to validate the clinical reliability and applicability of this automated osteoporosis screening tool.

Schematic representation of the workflow for osteoporosis and bone mineral density estimation using a radiograph. (a) Definition of the analyzing area on the hip radiographs. (b) Definition of the ROIs for the bony contours of the proximal femur. A pair of ROI images were predicted and segmented by the Mask RCNN model. (c) The triplet model designed by the customized CNN model and obtain the critical 128 features of each sub-image based on the labeled target. (d) Two-dimensional projection features by principal component analysis dimensionality reduction for 131 triplet features to obtain two clusters of features separated by the triplet algorithm. Two clusters of points for two classes (Classes 0–1) were classified by the red classification boundary. (e) Eight T-score’s sub-clusters were selected by the given reasonable ranges. (f) Training eight MLP (multilayer perceptron neural network) models and mapping the abovementioned eight T-score sub-clusters using genetic algorithm. (g) Calculate the T-score.
Methods
Study design
This single-center, retrospective study investigated the diagnostic accuracy of osteoporosis using the proposed X1AI-Osteo model and compared it with two CNN models (InceptionV3, ResNet50). The Ethics Committee of Taipei Medical University approved this study (registration number: TMU-JIRB N201909036). Owing to the retrospective nature of the study and the analysis of anonymous clinical data, the Ethics Committee waived the need for obtaining informed consent.
Patient selection
The data with both simple hip anterior–posterior (AP) radiographs and DXA examination results of consecutive patients who presented to one medical center between November 2017 and September 2019 were retrospectively reviewed. The inclusion criteria were as follows: (i) aged ⩾50 years and (ii) underwent both hip AP radiography and DXA within 6 months. We excluded hip radiographs on the left or right side of hips containing image-analyzing obstacles, including retained metal implants and severe osteoarthritis and osteonecrosis of the femoral head or foreign body materials, from DL model training. The reporting of this study conforms to the Strengthening the Reporting of Observational Studies in Epidemiology statement 16 (Supplemental Material).
The lowest T-score on the targeted proximal hips, including total hip and femoral neck regions for bilateral sides of the hip, from each patient assessed by DXA were obtained to classify osteoporosis on the targeted hip and train the proposed CNN model. We defined the diagnosis of osteoporosis and osteopenia as T-score ⩽ −2.5 and −1.5, respectively. 1 The T-score measurement by DXA was done using the Lunar Prodigy Advance System (GE Healthcare, WI, USA).
Anatomical segmentation
Figure 1(a) defines the analyzing area on the hip radiographs and Figure 1(b) defines the ROIs for the bony contours of the proximal femur. A pair of ROI images were predicted and segmented by the Mask RCNN model [Figure 1(b)]. Next, the square images were used to predict osteoporosis and T-score, which were resized as 224 × 224, also defined in Figure 1(b), without distortion, and were cropped from the ROI images. To highlight the texture of the femoral neck, the enhanced images were obtained from the square images with/without mirror process by contrast enhancement techniques, which were the training/validating/testing data for the inputs of the triplet model.
Training
To make triplet model learning more targeted, we proposed customized CNN model, shown in Figure 1(c) and Supplemental Figure S1, to obtain the critical 128 features of each sub-image based on the labeled target: Class 1, osteoporosis target; Class 0, non-osteoporosis target. Furthermore, we use principal component analysis dimensionality reduction for 131 triplet features to obtain these two clusters of features separated by the triplet algorithm; Figure 1(d) and Supplemental Figure S2 show the clustering result. Moreover, these two clusters of points for two classes (Classes 0–1) were classified by the red classification boundary [Figure 1(d) and Supplemental Figure S2]. Then, the eight T-score’s sub-clusters were selected by the given reasonable ranges [Supplemental Table S1 and Figure 1(e)].
Supplemental Table S1 shows the two cases we designed. Case 1: If the Class 0’s testing data were closest to one of the four classes mapped to one of the four T-score sub-clusters of Class 0, then the inference of this testing data was the output of that class’s MLP model, and the fifth class was the outliers for 131 features of Class 0, which were filtered by multi-linear regression. Case 2: If the Class 1’s testing data were closest to one of the four classes mapped to one of the four T-score sub-clusters of Class 1, then the inference of this testing data was the output of that class’s MLP model, and the fifth class was the outliers for 131 features of Class 1, which were filtered by multi-linear regression, and shown in Supplemental Figure S3 and Supplemental Table S1.
Next, the regression errors (reg_err) of all 2D points (Supplemental Figure S2) were calculated by the regression output (reg_out) compared with the desired T-score value (tsv), as shown in Supplemental Figure S3. This study defined the reg_err of tsv as:

The outliers are subject to the filter condition |reg_err ⩾ 0.5|. After filtering the outliers, the clusters 1–4 data were reserved (Supplemental Figure S3).
To calculate the precise T-score shown in Figure 1(g), we set four T-score sub-clusters for Class 0 and another four T-score sub-clusters for Class 1 (Supplemental Table S1) to train the eight MLP models [Figure 1(f)] and map the abovementioned eight T-score sub-clusters using genetic algorithm (GA). 17 If the testing data were closest to one of eight sub-clusters, then the inference of this testing data was the output (T-score) of one of the MLP models. In technology, we selected the learning rate; neurons of the first, second, and third layers; and the training epochs as the searched hyper-parameters for GA to optimize the three layers of eight MLP models. Supplemental Figure S4 shows the learning curves. After the eight MLP models for eight groups were trained (Supplemental Table S2), we decided on the 131 features input of Class 0 or Class 1 in MLP models to evaluate the T-score value.
Model evaluation
All performance measures were evaluated only on the test dataset, imputed separately. The receiver–operating characteristic (ROC) curve in Supplemental Figure S5 is based on the different data augmentation implemented using the black and white background images, the different degree of angles near the vertical bone direction, and different hyper and model parameters for the proposed CNN structure. Figure 2 summarizes the ROC curves based on the different CNN structures for triplet models.
The guided Grad-CAM (Gradient-weighted Class Activation Mapping) provided a direct visualization of the values in a map and combined the Grad-CAM and back-propagation visualization techniques. It showed information significant for classification – the high gradient of the input to the last convolutional layer. In this study, the heatmap visualizations were displayed relative to the range of values in the image. All visualizations were performed using iridescent map projections. Within the ROI, high attenuation was shown in green and low attenuation in red; hence, this study selected the best model.
Results
Data source
Overall, 1730 patients [age: >50 years; mean age: 72.4 (standard deviation (SD) 11.1) years; 1332 (77.0%) female] with concomitant hip radiograph and DXA examination within 6 months were enrolled. As a simple hip radiograph contained bilateral sides of hip images for analysis, 3460 unilateral hip images were collected for training and testing of X1AI-Osteo. We excluded 490 unilateral hip images (249 right hips and 241 left hips) owing to image-analyzing obstacles, including retained metal implants or bony deformity. Finally, 2473 unilateral hip images from 1430 patients were utilized for the training set and 497 unilateral hip images from 300 patients for the testing set.
Table 1 presents the subjects’ characteristics. The mean T-score assessed by DXA was −2.6 (SD 1.1). The DXA identified 1045 (60.4%) patients with osteoporosis based on the lowest T-score on the targeted hip region. The mean interval between DXA and a hip radiograph was 38.8 (SD 73.2) days.
Characteristics of the study population by X1AI-Osteo prediction tool input variables and DXA-based bone imaging biomarkers.

The entire study population (training + test datasets).
The T-score values were follows as: normal (>−1.5), osteopenia (⩽−1.5 and >−2.5), osteoporosis (⩽−2.5).
Excluded owing to image-analyzing obstacles, including retained metal implants or bony deformity.
The BMI values were as follows: obese (⩾27); overweight (⩾24 and <27); normal (⩾18.5 and <24); underweight (<18.5).
BMI, body mass index; DXA, dual-energy X-ray absorptiometry; SD, standard deviation.
Prediction performance for osteoporosis
Currently, the contour segmentation model will mark out three types: (1) screws, (2) joints, and (3) femur. Our program only extracts the contour of the femur, while screws and joints (image-analyzing obstacles) are not processed. Before calculating the T-score, medical personnel confirm the absence of distortion in segmented images.
The performance of Segmentation in terms of Intersection over Union (IoU) is as follows (Table 2). The contour detection model uses 2506 images, including 163 bone nail images, 137 artificial joint images, and 2206 femoral images. Standards for IoU values: Artificial joints and femur must be greater than 0.97, the style of bone nails must be diverse and complicated, and the IoU value must be greater than 0.95.
The performance of segmentation in terms of IoU.

IoU, intersection over union.
The default features of pre-trained CNNs are not suitable for osteoporosis. Therefore, the triplet method is needed to fine-tune the default features of pretrained models. The fine-tuned features can highlight the more obvious differences between the characteristics of osteoporosis and non-osteoporosis, which is more helpful for the convergence of the proposed classifier (triplet model). The segmented images need to be resized to inputs of resolution size 224 × 244 × 3 for the proposed model, the ResNet50, and InceptionV3 models.18,19
Table 3 presents the performance assessment of the three CNN models (ResNet50, InceptionV3, and X1AI-Osteo) applying the 497 test sets of unilateral hip radiographs. Among the three prediction tools, X1AI-Osteo exhibited the superior performance in predicting osteoporosis [sensitivity: 97.2%; specificity: 95.6%; positive predictive value (PPV): 95.7%; negative predictive value (NPV): 97.1%], followed by ResNet50 (sensitivity: 84.3%; specificity: 75.8%; PPV: 77.8%; NPV: 82.8%) and InspectionV3 (sensitivity: 78.3%; specificity: 78.6%; PPV: 78.6%; NPV: 78.3%). Figure 2 demonstrates the higher area under the curve (AUC) in predicting hip osteoporosis using X1AI-Osteo than that by ResNet50 and InspectionV3 (AUC: 96.4%, 80.1%, and 78.5%, respectively).
Discriminatory performance (%) of the osteoporosis AI prediction tools.

Analysis is based on the test set, which comprised 300 individuals (497 unilateral hip radiographs). The CIs were calculated using the bootstraps, as detailed in section ‘Methods’.
All measures were evaluated and averaged across the 11 imputed datasets of the test sets.
AI, artificial intelligence; AUC, area under the curve; CI, confidence interval; NPV, negative predictive value; PPV, positive predictive value.

Receiver–operating characteristic curves for each osteoporosis prediction tool. All performance measures were evaluated on the test dataset, imputed separately.
Prediction performance for T-score
Figure 3 summarizes the X1AI-Osteo performance to predict BMD. The Pearson’s correlation coefficient between DXA-measured and X1AI-Osteo-predicted T-score was 0.996 (p < 0.001). Supplemental Figure S6 demonstrates high concordance correlation coefficient [0.996 (95% confidence interval (CI): 0.995–0.997)] between DXA-measured and X1AI-Osteo-predicted T-score. Figure 4 confirms the high consistency of T-score prediction using X1AI-Osteo than that by DXA measurement.

Relationship of the predicted T-score between DXA-measured and X1AI-Osteo-predicted T-score. The plot was created using the first imputed test set, which comprised 300 individuals.

Bland–Altman plots between DXA-measured and X1AI-Osteo-predicted T-score. Solid line, the mean difference (bias); upper and lower lines, 95% LoA. The mean difference was −0.010 (95% CI: −0.019 to −0.001), LoA lower limit was −0.214 (95% CI: −0.230 to −0.198), and upper limit was 0.194 (95% CI: 0.178–0.210).
Visualization of the ROI by X1AI-Osteo
Figure 5 presents the focused visualization area attained by guided Grad-CAM. In the radiographs of patients with and without osteoporosis, the relatively distinct areas of shading (obscure trabeculation) on the femoral neck and trochanteric region were identified as deep-learned feature areas.
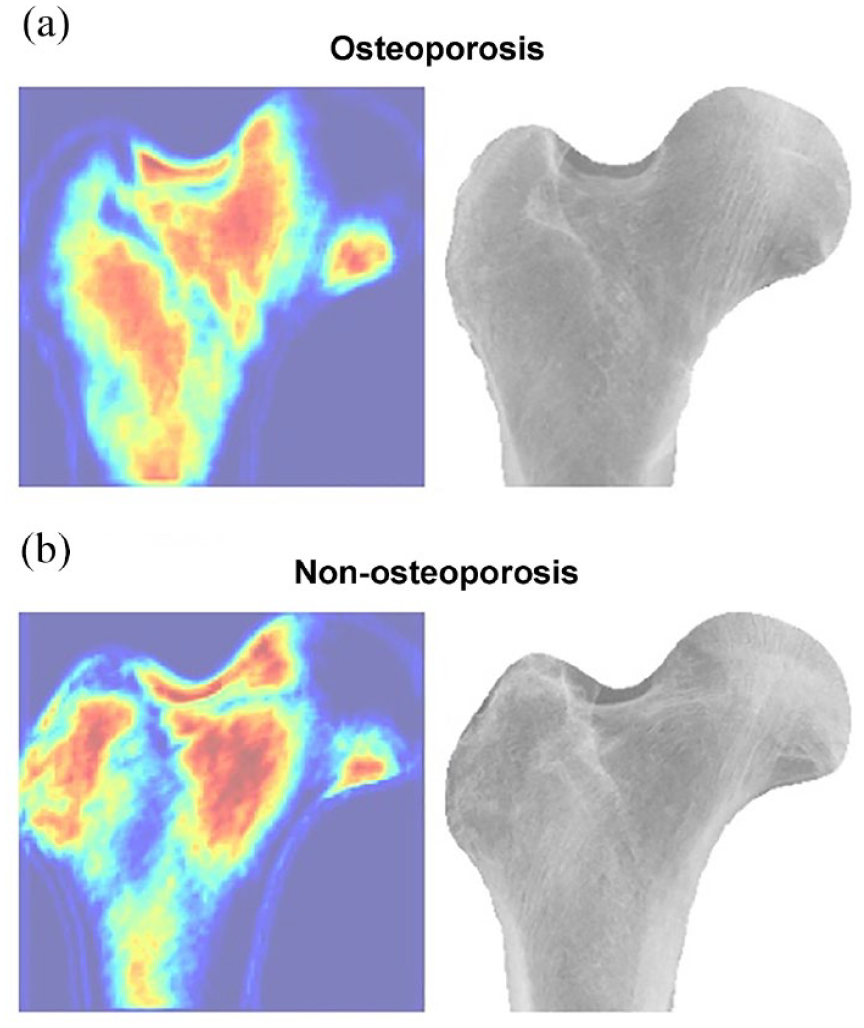
Visualization of the region of interest by X1AI-Osteo on patients with and without osteoporosis. The relatively distinct areas of shading (obscure trabeculation) on the femoral neck and trochanteric region were identified as deep-learned feature areas.
Discussion
Mostly, osteoporosis progresses silently until fragility fractures happen, highlighting the clinical importance of osteoporosis screening programs. 20 Considering the limited availability of DXA as a screening modality for osteoporosis, 7 DL-based modalities using a simple hip radiograph in opportunistic osteoporosis screening constitute a potential domain despite technical and clinical concerns.11,12,14,15 In our model, the performance on osteoporosis classification was robust with DXA as a reference and competent with (or even superior to) the performance of the existing DL-based osteoporosis screening tools using simple hip radiographs.11,12,14,15 The proposed and customized CNN network (X1AI-Osteo) rather than the open-source CNN models utilized in our screening tool and the introduction of the automated segmentation of bony contour, as well as the image-enhancing process on the proximal femur, primarily attributed to its excellent performance in the diagnosis of osteoporosis. Our study proposes the aligned data augmentation of small data based on the data need reduction by the image process method to manage the overfitting issue of small data to train the proposed CNN model. Compared with the two most popular CNN models (InceptionV3 and ResNet50), our model illustrated a more compact model architecture (with faster model convergence to speed up about 12 times), resulting in better interpretation performance in predicting osteoporosis. Besides, our study introduced the method of automated segmentation of the bony contour on the proximal femur and in the workflow of the DL model, which can not only avoid the potential bias due to manual annotation of ROI but also simplify the analysis process in the clinical application. Our study introduced an effective method of automated segmentation of the bony contour on the proximal femur and in the workflow of the DL model, building upon methodologies such as those explored in the paper ‘Deep Radiomics-based Approach to the Diagnosis of Osteoporosis Using Hip Radiographs.’ We acknowledge the contributions of previous studies in this field. Of note, the automated segmentation of the bony contour can facilitate focusing on the visualization area of the DL feature on the proximal femur cortex and trabecular patterns of the neck and trochanter region (Figure 5), with the main analyzing area for BMD by DXA examination 21 and also matched the rationales of SI in diagnosing osteoporosis based on plain hip radiographs. 8 Therefore, our model may create the added values of the published DL models11,12 based on the image process method for enhancing the texture of hip radiographs, which would be extremely valuable in a clinical setting.
To the best of our knowledge, this is the first study to compare the single model in predicting T-score with the multi-cluster models. In addition, the positive results obtained rationalize further work applying the DL-based opportunistic osteoporosis screening using a simple hip radiograph. The several advantages of our DL-based screening tool include low cost, widely available radiographic modality, and simple protocol. Furthermore, it detects the risk of osteoporosis on the targeted hip, directly providing the future risk of hip fracture. For older people suffering a hip fracture, the concomitant screening of osteoporosis risk on the contralateral hip can be easily attained by X1AI-Osteo using the index hip radiograph, enabling clinicians to take early actions to prevent secondary fractures consistent with the spirit of Fracture Liaison Service. 22 Furthermore, owing to the simple protocol and high accuracy regarding DXA, the future work of X1AI-Osteo may be applied to the community osteoporosis screening in remote medical institutions or local clinics lacking DXA machines to optimize the strategy to expand screening populations cost-effectively.
Nevertheless, this study has some limitations. First, from opening the DICOM file to contour extraction and analysis, it takes approximately 12–15 s (the DICOM file size is roughly 18–22 MB). Second, the majority (60.4%) of our study population was diagnosed with osteoporosis, and approximately 14% of unilateral hip images were excluded owing to image-analyzing obstacles. Besides, the disease severity was relatively high because we enrolled patients from a tertiary medical center. Thus, our sample might not have represented the healthier aged population in the community. Third, all patients were enrolled from a single hospital. Our training datasets could be small such that overfitting of the CNN model might be a potential concern. Thus, the accuracy of DL-based osteoporosis classification and BMD prediction would be enhanced by increasing the number of images in a multicenter study. Besides, further external validation is warranted to confirm the applicability of our screen tool in other institutions. Finally, in our model of T-score prediction, we selected three clinical variables as additional features in the DL training metric to increase the prediction performance. Other confounding factors, including races, comorbidities, or previous fracture history, could be critical features contributing to the training performance of the CNN model. Nevertheless, the performance of our tool attained almost excellence in the BMD prediction even when only three clinical variables were included in the DL training metric.
Conclusion
This study demonstrates that our proposed CNN model, X1AI-Osteo, may identify osteoporosis and predict T-scores on the targeted hip regions from simple hip radiographs with high accuracy. Hence, the future application of this screening tool could be an efficient strategy for population-based opportunistic osteoporosis screening with low cost and high adaptability for a broader population at risk. The previous model had a clinical intake of 300 people, and currently, it is being used by approximately 4000 people in the market.
Supplemental Material
sj-docx-1-tab-10.1177_1759720X241237872 – Supplemental material for Automated osteoporosis classification and T-score prediction using hip radiographs via deep learning algorithm
Supplemental material, sj-docx-1-tab-10.1177_1759720X241237872 for Automated osteoporosis classification and T-score prediction using hip radiographs via deep learning algorithm by Yu-Pin Chen, Wing P. Chan, Han-Wei Zhang, Zhi-Ren Tsai, Hsiao-Ching Peng, Shu-Wei Huang, Yeu-Chai Jang and Yi-Jie Kuo in Therapeutic Advances in Musculoskeletal Disease
Supplemental Material
sj-docx-2-tab-10.1177_1759720X241237872 – Supplemental material for Automated osteoporosis classification and T-score prediction using hip radiographs via deep learning algorithm
Supplemental material, sj-docx-2-tab-10.1177_1759720X241237872 for Automated osteoporosis classification and T-score prediction using hip radiographs via deep learning algorithm by Yu-Pin Chen, Wing P. Chan, Han-Wei Zhang, Zhi-Ren Tsai, Hsiao-Ching Peng, Shu-Wei Huang, Yeu-Chai Jang and Yi-Jie Kuo in Therapeutic Advances in Musculoskeletal Disease
Footnotes
Acknowledgements
The authors are grateful to the programmer and data technologists from X1 Bone densitometer Solution and X1 Imaging for supporting this work, and did not receive any specific grant from external funding agencies.
Declarations
Supplemental material
Supplemental material for this article is available online.
References
Supplementary Material
Please find the following supplemental material available below.
For Open Access articles published under a Creative Commons License, all supplemental material carries the same license as the article it is associated with.
For non-Open Access articles published, all supplemental material carries a non-exclusive license, and permission requests for re-use of supplemental material or any part of supplemental material shall be sent directly to the copyright owner as specified in the copyright notice associated with the article.