
Abstract
Background:
T-score discordance is common in osteoporosis diagnosis and leads to problems for clinicians formulating treatment plans.
Objectives:
This study investigated the potential predictors of T-score discordance and compared fracture risk among individuals with varying T-score discordance status.
Design:
This was a single-center cross-sectional study conducted at Wan Fang Hospital, Taipei City, between 1 February 2020 and 31 January 2022.
Methods:
The present study enrolled patients aged ⩾50 years who received advanced bone health examination. Participants with a history of fracture surgery or underlying musculoskeletal diseases were excluded. Bioelectrical impedance analysis and dual-energy X-ray absorptiometry were used to determine the body composition and T-score, respectively. Discordance was defined as different T-score categories between the lumbar spine and hip. The impact of discordance on an individual’s fracture risk was assessed using the Fracture Risk Assessment Tool (FRAX).
Results:
This study enrolled 1402 participants (181 men and 1221 women). Of the 912 participants diagnosed with osteoporosis, 47 (5%) and 364 (40%) were categorized as having major and minor discordance, respectively. Multinomial logistic regression revealed that decreased walking speed was significantly correlated with major discordance but not osteoporosis in both the hip and lumbar spine (odds ratio of 0.25, p = 0.04). The adjusted FRAX scores for the major osteoporotic fracture risks of the major and minor discordance groups were approximately 14%, which was significantly lower than that of people having osteoporosis in both the hip and lumbar spine.
Conclusions:
Walking speed exhibited the most significant correlation with major discordance in patients with osteoporosis. Although adjusted major fracture risks were similar between the major and minor discordance groups, further longitudinal studies are warranted to confirm this finding.
Registrations:
This study was approved by the Ethics Committee of Taipei Medical University on 01/04/2022 (TMU-JIRB N202203088).
Keywords
Introduction
Osteoporosis is a common systemic skeletal disorder characterized by low bone mass, microarchitectural deterioration of the bone tissue, and increased risk of low-energy fractures or fragility fractures. 1 It is a significant public health concern worldwide because of the associated fracture risks and care demands. In Taiwan, the expenditure for patients diagnosed with osteoporosis and fractures is significantly higher than that for the general population for both men and women and across all age groups. 2
Patients can be classified into three categories, namely normal bone mass, osteopenia, and osteoporosis, on the basis of the lowest T-score for the hip and lumbar spine. 3 Occasionally, T-score discordance occurs between two key skeletal measurement sites (i.e., hip and lumbar spine), which may make assessing the bone health condition and formulating treatment plans difficult. In 1998, Nelson et al. 4 first reported that 3.5% of 537 Caucasian women aged more than 50 years had osteoporosis in either the proximal femur or lumbar spine, whereas the other site was normal. Following this epidemiology study, multiple studies have reported a high prevalence of T-score discordance in populations with different ethnicities.5–7 They have also attempted to identify the contributing factors. However, studies have only considered basic demographic data (e.g., age, sex, and body weight) and patient clinical history (e.g., menopause or smoking) and may have overlooked other variables that are highly correlated with bone health, such as muscle power, visceral adiposity percentage, and walking speed.8–10 In addition to basic demographic data, the present study analyzed various clinical factors that had not been tested previously to determine the factors correlated with T-score discordance.
Reports on the clinical implications of discordant T-scores are lacking. In a retrospective cross-sectional analysis of 15,033 postmenopausal women, Blackburn et al. demonstrated that a lower T-score in the lumbar spine than in the femoral neck increased fracture risk. 11 Conversely, Goh et al. 12 analyzed 1066 postmenopausal South Korean women and concluded that those with lower bone mineral density (BMD) in the femoral neck had significantly 4.5% higher major osteoporotic fracture and 3% higher hip fracture risks than did those with lower BMD in the lumbar spine. These contradictory preliminary results may lead to difficulty in making treatment decisions by clinicians.
The current study was performed to evaluate the factors related to T-score discordance. The impact of discordance on the risks of major osteoporotic and hip fractures was determined using the Fracture Risk Assessment Tool (FRAX) and the adjusted version of FRAX, 13 and the results may provide guidance for optimizing treatment management plans for patients in Taiwan.
Materials and methods
Study design
This cross-sectional study recruited consecutive adults referred from primary care clinics for advanced bone health examinations at a medical center in Taipei, Taiwan, from 1 February 2020, to 31 January 2022. Eligible participants were men and women aged ⩾50 years. Patients were excluded if they had received hip or spinal surgery, had already received an osteoporosis diagnosis, or had underlying skeletomuscular diseases such as Paget’s disease, ankylosing spondylitis, or bone tumors. Prior to dual-energy X-ray absorptiometry (DXA) screening, all participants completed a self‑administered questionnaire to collect their demographic data, clinical history, diet, lifestyle practices, physical activity status, and health‑related data. The weight and standing height of patients were also recorded before DXA screening. This study was conducted in compliance with the Declaration of Helsinki and was approved by the Ethics Committee of Taipei Medical University on April 1, 2022 (TMU-JIRB N202203088). All participants provided written consent to participate in this study, to receive treatments, and to the publication of their data. De-identification of all patient details was performed soon after the completion of this study. The reporting of this study conforms to the Strengthening the Reporting of Observational Studies in Epidemiology statement. 14
BMD assessment
The BMD of the bilateral hips and lumbar spine was evaluated using DXA (GE Healthcare, Madison, WI, USA). Every patient received a DXA examination of these three sites according to the standard procedures of the manufacturer. Scanning was performed by certified radiographers who were blinded to the trial design, and the imaging machine was calibrated daily as per the manufacturer’s recommendations.
T-score determination
The T-scores of the hips and lumbar spine were generated by comparing the bilateral hip and lumbar spine BMD values of participants with those of healthy young adults of European descent (the National Health and Nutrition Examination Survey III database). This study followed the World Health Organization guidelines for the diagnosis of osteoporosis (T-score ⩽ −2.5), osteopenia (−1 ⩽ T-score <−2.5), and normal bone health status (T-score >−1). 15 Patients with a T-score of < −2.5 for any body part were considered to have osteoporosis, and the same criteria were applied for diagnosing osteopenia.
Definition of discordance
Discordance was defined as different T-scores (osteoporosis, osteopenia, and normal) in two skeletal sites in a patient. Minor discordance occurred when adjacent diagnostic classes were found in two sites; that is, a patient is diagnosed with osteoporosis at one site and osteopenia at the other sites or diagnosed with osteopenia at one site and normal at the other site. If osteoporosis was diagnosed at one site and the T-score in the other site was within the normal range, major discordance was confirmed. Concordance was defined as a patient having the same diagnosis of osteoporosis, osteopenia, or normal BMD at two sites.
Body composition assessment
Before exercise and at least 3 hours after eating, the body composition of all participants was measured through multifrequency bioelectrical impedance analysis (BIA) with a body composition analyzer (TANITA DC 430MA-S, Tokyo, Japan; accuracy: 0.05 kg). The assessment was only performed once after the DXA examination. It was conducted by the nursing staff working in the Center of Osteoporosis and Sarcopenia and was under the supervision of three authors: YC Jang, YP Chen, and WP Chan. The measurement included body fat, visceral adiposity, basal metabolic rate, and muscle mass.
Dietary and lifestyle practice
Dietary and lifestyle habits were routinely recorded for every participant after advanced bone health examination by the authors YC Jang, YP Chen, and WP Chan. In addition, interviews were conducted with participants and their caregivers regarding their smoking behavior, alcohol consumption, glucocorticoid prescription, intake of calcium or vitamin D supplements, parental hip fracture history, and exercise habits.
Measurement of other clinical factors
Basic demographic data, including age and sex, were collected for analysis by the nursing staff working at the Center of Osteoporosis and Sarcopenia. At the patients’ first outpatient department visit for advanced bone health examination, serum blood tests were performed, and participants were administered the EuroQol-5D (EQ5D) 16 and Barthel index (BI) 17 by the authors YC Jang, YP Chen, and YC Lin to evaluate their quality of life and performance of activities of daily living, respectively. The Chinese version of the EQ5D was used in this study; it exhibited high levels of agreement (intraclass correlation coefficient >0.75) and convergent validity (Pearson’s correlation coefficient >0.95) with the values of EQ5D versions from the United Kingdom, Japan, and Korea. 18 The Chinese version of BI has been validated with moderate to excellent agreement among raters for individual items (kappa: 0.53–0.94) and for the total score (intraclass correlation coefficient Z = 0.94). 19 In this study, isometric grip strength, or the maximum hand grip strength, was measured using a Jamar hydraulic dynamometer (Sammons Preston, USA). The measurement protocol consisted of two attempts, in which the maximum voluntary grip force of each hand was measured, with a 1-min rest interval. The highest score obtained among a total of four attempts was considered the final value. The measurements were performed with participants seated on a chair with a straight back and with the arm bent at a 90° angle and in contact with the trunk. During the measurement, the arm was not supported by any surface.20,21 For all participants, gait speed is expressed as m/s and was recorded when they walked 4 meters.
Calculation of FRAX scores
FRAX is a computer-based algorithm (http://www.shef.ac.uk/FRAX) launched in 2008; it calculates the 10-year probability of a major osteoporotic fracture (hip, clinical spine, humerus, or wrist fracture) and the 10-year probability of hip fracture. FRAX integrates 12 clinical variables (namely age, sex, body weight, body height, previous fracture, parental hip fracture, alcohol consumption, smoking status, systemic glucocorticoid use, rheumatoid arthritis, secondary osteoporosis, and femoral neck BMD) for fracture risk calculation. 22 However, FRAX focuses on hip BMD alone and may be insufficient for evaluating fracture risk in patients with T-score discordance, especially in those with an osteoporotic lumbar spine and normal bone health status in the hip. To solve this problem, Leslie et al. proposed a simple mathematic calculation to adjust the FRAX score for major osteoporotic fractures. The developed rule was ‘increase/decrease FRAX estimate for a major fracture by one-tenth for each rounded T-score difference between the lumbar spine and femoral neck’, and a clear example was given. Consider a patient with T-scores of −1.7 in the femoral neck and −3.5 in the lumbar spine and a major osteoporotic FRAX probability of 18%. The T-score offset is −1.8 (−3.5 minus −1.7) and is rounded to the nearest whole number (−2). One-tenth of the FRAX estimate based upon the femoral neck is 1.8%, which is multiplied by the rounded offset value (giving 3.6%). This is then added (because the lumbar spine T-score is worse than the femoral neck T-score) to the original FRAX estimate (18%), giving a final (rounded) probability of 22% (18% + 3.6%). 13 The original and adjusted versions of FRAX major osteoporotic fracture risk were calculated and presented in this study.
Statistical analysis
All statistical analyses were performed using SPSS Statistics, version 27.0 (SPSS, Chicago, IL, USA). Categorical variables are presented as frequencies and percentages, and continuous variables are presented as means ± standard deviations. Univariate analyses were conducted to identify potential factors related to major or minor discordance. The chi-square test was used to compare categorical variables, whereas the independent t-test or analysis of variance (ANOVA) was used to compare normally distributed continuous variables. The Mann–Whitney U test and Kruskal–Wallis ANOVA were adopted if the data were nonnormally distributed, and these variables were assessed using the Shapiro–Wilk test. The Scheffe post hoc test was adopted once the ANOVA test results were found to be significant. Factors with significant differences (p < 0.05) in the univariate analysis were included in the multinomial logistic regression model for estimating odds ratios (ORs) with 95% confidence intervals, where the concordance group was set as the reference group. For all tests, a two-sided p-value of < 0.05 indicated significance.
Results
A total of 1404 participants were enrolled (Figure 1, Supplemental Table 1). Among the 47 patients with major discordance, 7 had osteoporotic lumbar spine (mean hip T-score of 0.25 and mean lumbar spine T-score of −3.2), and 40 had osteoporosis in the hip (mean hip T-score of −3.0 and mean lumbar spine T-score of −0.16). Of the 364 patients in the minor discordance group, 216 had osteoporosis in the lumbar spine and osteopenia in the hip (mean hip T-score of −2.0 and mean lumbar spine T-score of −3.2), and 148 had osteopenia in the lumbar spine and osteoporosis in the hip (mean hip T-score of −2.9 and mean lumbar spine T-score of −1.9). The patients in the osteoporosis group (n = 501, 55%) had osteoporosis in both the hip and lumbar spine, with a mean hip T-score of −3.1 and a mean lumbar spine T-score of −3.7. In total, 97 individuals with normal hip and lumbar spine T-scores did not require specific treatment and were instead regularly monitored in the outpatient department. Because all the continuous variables shown in Table 1 were nonnormally distributed, nonparametric statistics were applied. Univariate analysis revealed significant differences in age, sex, body mass index (BMI), BI, EQ5D, walking speed, muscle power, muscle percentage, visceral adiposity percentage, and basal metabolic rate (Table 1). To determine the potential factors related to major and minor discordance, multinomial logistic regression was adopted, with the concordance group serving as the reference group. In the first multinomial logistic regression model, walking speed was the only significant factor associated with major discordance, with the OR of 0.25 (p = 0.04), whereas no significant clinical parameter was identified in the minor discordance group (Table 2(A)). Because BIA is not universally accessible, it was excluded from the second multinomial logistic regression model. Sex, BMI, and walking speed significantly related to major discordance (female sex: OR: 0.12, p < 0.001; BMI: OR: 1.2, p < 0.001; walking speed: OR: 0.3, p = 0.04). Age and BMI were significantly correlated with minor discordance; their respective ORs were 0.98 (p = 0.03) and 1.1 (p = 0.001; Table 2(B)). In the osteopenia group, only sex was a significant factor (ORs: 0.04 for women, p = 0.01; Supplemental Table 2(A) and (B)).

Number of patients in major and minor discordance and concordance groups with respective T-score discordance status.
Comparative clinical characteristics according to BMD status and discordancy.

BIA, Bioelectrical impedance analysis BMD, bone mineral density; BMI, Body Mass Index; DXA, Dual-energy X-ray absorptiometry; EQ-5D, EuroQol-5 Dimension questionnaire.
(A) Multinomial logistic regression analysis of osteoporosis patients having major or minor discordance or concordance.

Concordance group served as the reference group in this model.
BMI, body mass index; CI, confidence interval; EQ-5D, EuroQol-5 Dimension.
Bold term represents the p-value < 0.05 is statistically significant
(B) Multinomial logistic regression analysis of osteoporosis patients having major or minor discordance or concordance after exclusion of BIA data.

Concordance group served as the reference group in this model.
BIA, bioelectrical impedance analysis; BMI, body mass index; CI, confidence interval; EQ-5D, EuroQol-5 Dimension.
Bold term represents the p-value < 0.05 is statistically significant.
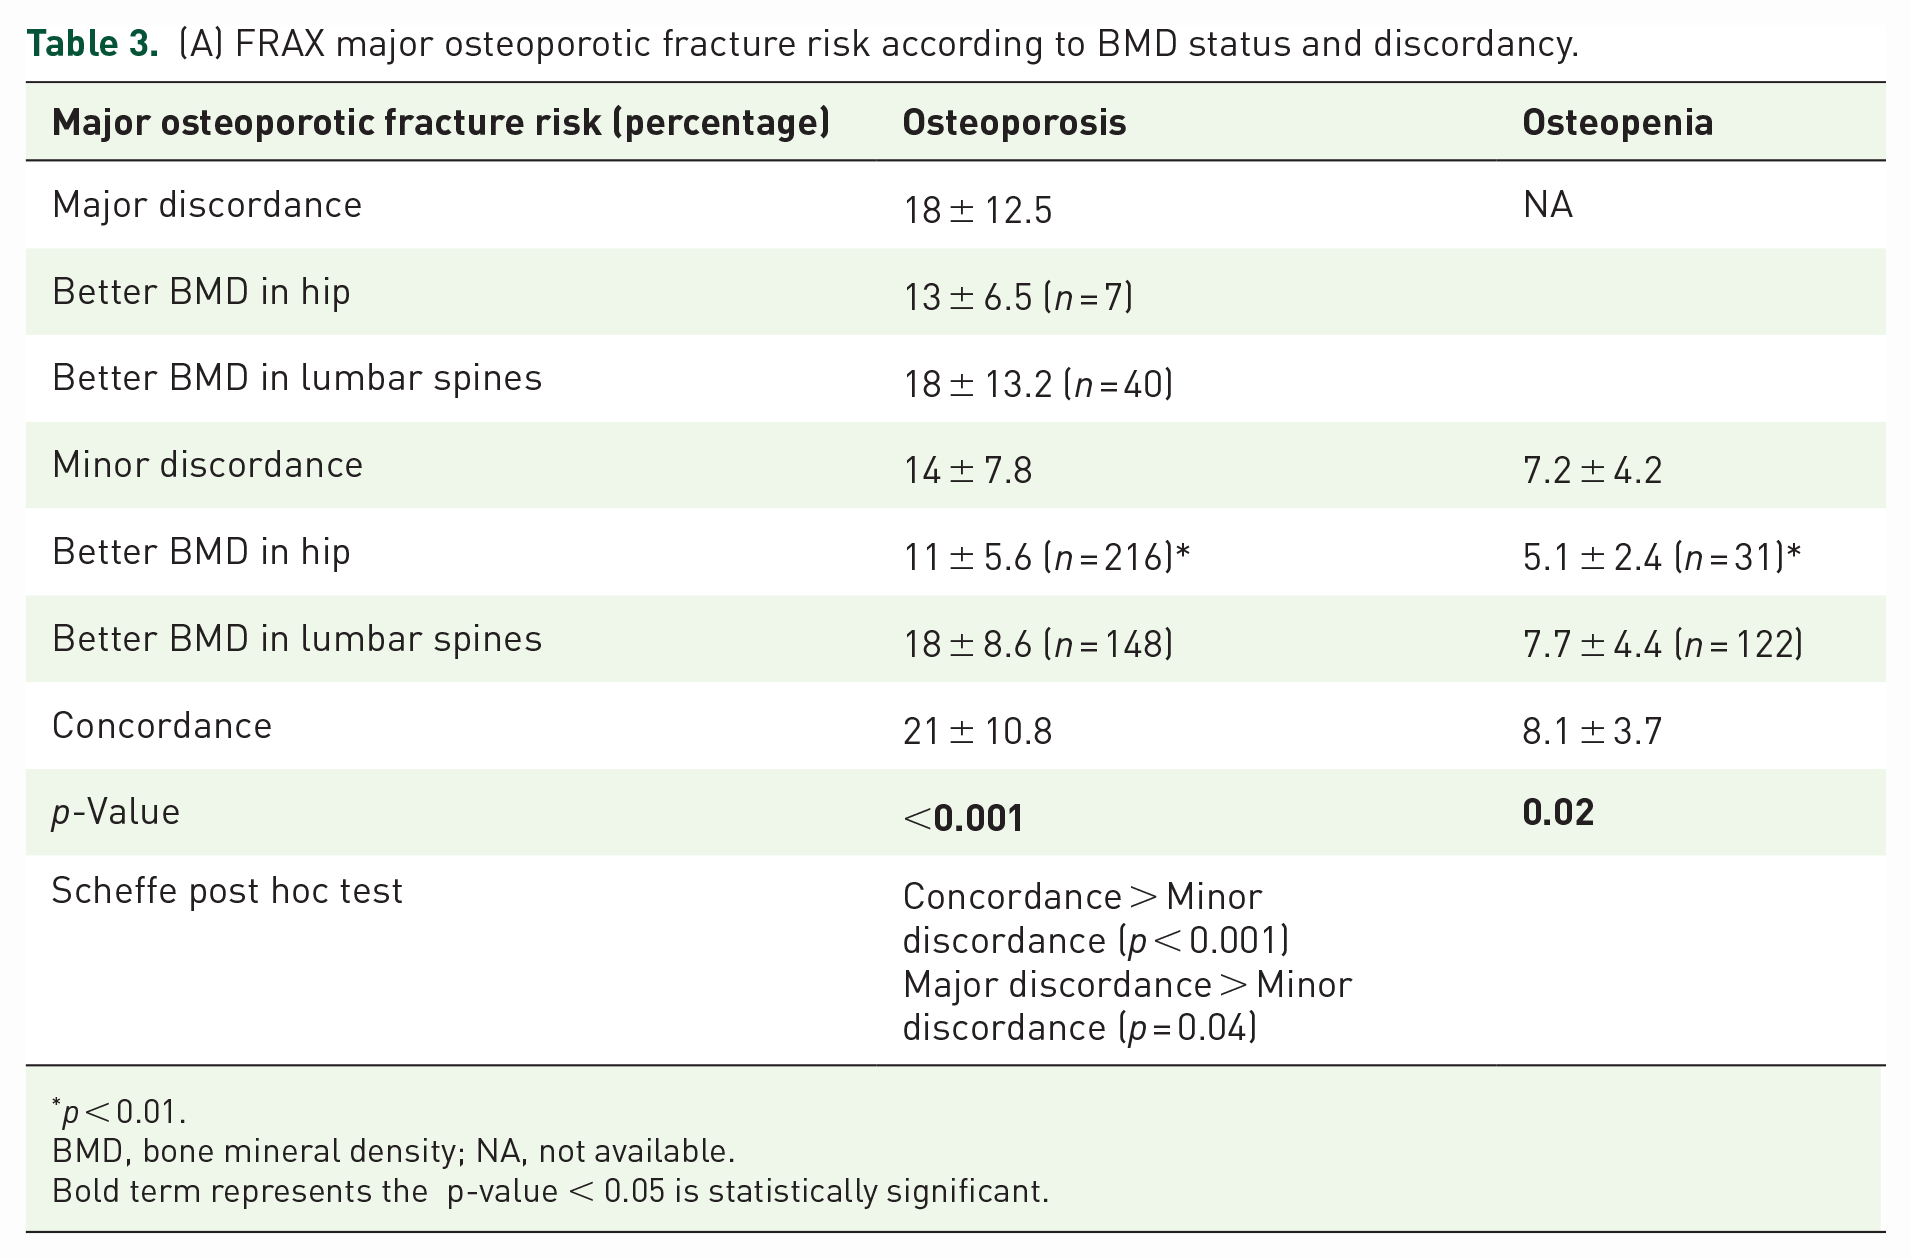
Participants were divided into three categories depending on their discordance status for FRAX score calculation. As shown in Table 3(A), the 10-year risk of major osteoporotic fracture was similar for patients with major discordance or osteoporosis in both the hip and lumbar spine. The 10-year risk of major osteoporotic fracture was significantly low in the minor discordance group (p < 0.001). However, after adjustment using the formula proposed by Leslie et al., the major osteoporotic fracture risk in the major discordance group decreased from 18 to 14% (Table 3(B)). In patients with osteopenia, the 10-year risk of major osteoporotic fracture in the minor discordance group was significantly lower than that in the concordance group (p = 0.02). A similar trend was observed after adjustment (Table 3(B)). Patients in the major discordance and concordance groups had similar high 10-year risks of hip fracture (Table 3(C)).
(A) FRAX major osteoporotic fracture risk according to BMD status and discordancy.
p < 0.01.
BMD, bone mineral density; NA, not available.
Bold term represents the p-value < 0.05 is statistically significant.
(B) Adjusted FRAX major osteoporotic fracture risk according to BMD status and discordancy.

p < 0.01.
BMD, bone mineral density; NA, not available.
Bold term represents the p-value < 0.05 is statistically significant.
(C) FRAX hip fracture risk according to BMD status and discordancy.

p < 0.01.
BMD, bone mineral density; NA, not available.
Bold term represents the p-value < 0.05 is statistically significant.
Discussion
In this study, a high proportion of participants had minor discordance, and only 47 participants had major discordance. The prevalence of discordance in this study is comparable to the findings of previous studies.6,23 Walking speed was a significant negative predictor in this study. Sex and BMI were also significantly correlated with T-score discordance after excluding BIA data from the model (Table 2). The second principal finding of this study is that the adjusted 10-year risk of major osteoporotic fracture for patients with osteoporosis was approximately 14% in both the major and minor discordance groups, which was significantly lower than that in the concordance group (Table 3).
Five mechanisms cause T-score discordance 24 : physiologic, pathophysiologic, anatomic, artifactual, and technical. Among these five mechanisms, physiologic discordance is the most common and is related to the skeleton’s natural adaptive reaction to normal external and internal factors and forces. Weight-bearing is a commonly observed external factor. Certain characteristics and remodeling between the trabecular and cortical bones also contribute to physiologic discordance. 25 Regarding technical and anatomic discordance, in this study, all DXA examinations were performed by well-trained technicians, and the DXA machine was calibrated routinely. We did not survey and excluded patients with the following diseases that may influence T-scores: vertebral osteophytosis, vertebral endplate, and facet sclerosis, osteochondrosis, and aortic calcification; thus, pathophysiologic discordance may have caused discordance in our study.
Walking speed is often used as a measure of functional performance and has been linked to survival in elderly adults.26,27 The present study found that walking speed is a strong negative predictor of major discordance, which has not been reported previously. The mechanics of walking involve multiple muscle groups, and increased mechanical loading has been linked to increased bone mass and strength. 28 Some studies have also identified a positive association between walking speed and bone mass. 29 We assumed that the 47 participants in the major discordance group likely had difficulty with self-ambulation, as indicated by their significantly lower BI and higher BMI values. They may have spent more time sitting or lying down, which could have limited the physical loading on their lumbar spine and negatively affected their hip bone mass.
In addition to the lack of mechanical stimulation from lower self-ambulation ability, higher BMI characterized by higher visceral adiposity percentage may vitally influence major discordance development. Visceral adipose tissue can promote osteoclast activation and downregulate insulin-like growth factor I, causing reduced bone formation.30–32 Kim et al. 33 conducted a population-based cross-sectional study of more than 2000 participants and found that abdominal obesity was negatively correlated with femoral neck strength. Similarly, in a cross-sectional study of more than 500 healthy postmenopausal women, Shao et al. reported a significant negative association between femoral neck BMD and the android fat to gynoid fat ratio. 34 However, the impacts of visceral adiposity on the spine is unclear. In a large retrospective cohort study involving more than 4000 middle-aged Australians, Zhu et al. reported a strong association between visceral adipocyte tissue and femoral neck BMD, whereas a weaker relationship was found with lumbar spine BMD. The authors suggested that this difference may exist because visceral adipocytic tissue exerts a greater adverse effect on the cortical bone (femoral neck) than on the trabecular bone (lumbar spine). 35 These findings may partly explain the higher number of patients (40 of 47) with normal lumbar spine T-scores in the major discordance group in this study.
In this study, women had a lower risk of developing major discordance (woman: OR: 0.12, p < 0.001). The underlying pathophysiology may be influenced by the different patterns of bone loss in men and women. After menopause, women experience significantly increased bone turnover and bone loss in the trabecular and cortical bones, 36 largely because of estrogen deficiency. Conversely, in men, the cortical bone mass tends to be preserved until an advanced age and late hypogonadism is believed to be the cause. 37 Progressive Leydig cell dysfunction only occurs in old age. 38 Multiple studies have also demonstrated that higher levels of estrogen and testosterone can protect elderly men against the loss of BMD and can reduce their fracture rate.39,40 Therefore, men have a higher probability of developing T-score discordance, whereas women are more prone to having osteoporosis in both the hip and lumbar spine.
Fracture risk prediction using FRAX has been debatable in patients with T-score discordance because FRAX calculations are limited to the use of hip BMD. 41 The International Society for Clinical Densitometry and the International Osteoporosis Foundation addressed this issue in an official position statement and suggested that T-score discordance may cause the underestimation or overestimation of major osteoporotic fracture risks. 42 The results of some longitudinal studies also indicated the necessity of incorporating the lumbar spine T-score into fracture prediction. In a prospective study of more than 7500 postmenopausal women, Fink et al. reported that compared with those without osteoporosis, participants with osteoporotic spine alone had significantly higher risks of incident radiographic spine fracture, clinical spine, and hip fracture. 43 Alarkawi et al. 44 reported that women with significantly lower lumbar spine T-scores exhibited consistently higher absolute fracture risks regardless of their femoral neck T-scores. To more effectively stratify fracture risk, Leslie et al. 13 retrospectively reviewed a BMD database of more than 36,000 individuals and devised a simple procedure for T-score discordance adjustment, which was adopted in the present study. An alternative approach is incorporating the trabecular bone score into FRAX calculations.45,46 Goh et al. reported that after adjustment for the trabecular bone score, FRAX scores decreased in all groups regardless of T-score discordance, indicating a general overestimation of fracture risk when femoral neck BMD alone was adopted. 12 Similar circumstances occurred in this study. After lumbar spine T-score adjustment was applied to the calculation, the risk of major osteoporotic fracture decreased from 18 to 14%, which was comparable to that in the minor discordance group. However, patients with osteoporosis in both sites had the highest major osteoporotic and hip fracture risks. These findings may assist clinicians in more accurately assessing patient condition and developing respective treatment strategies.
Limitations
This study has several limitations. First, the sample size was limited, and the recruited participants may have been healthier than the general population because most were referred from clinics or voluntarily attended advanced bone health examinations, indicating that they may have had higher health self-awareness and thus may not be representative of the older adult population in Taiwan. Second, BIA was adopted in this study for body composition analysis; however, the results of BIA may have been influenced by participant fluid distribution, especially in patients with severe obesity.47,48 Third, this study was cross-sectional in nature and did not record the real fracture events encountered by each participant. Instead, the results were based on a calculated risk determined using FRAX. Long-term longitudinal studies are warranted to determine the impact of major and minor discordance on fracture risk in this specific cohort.
In conclusion, the prevalence of major T-score discordance in this study was approximately 3.4%, which is comparable to that in previous studies. Low walking speed was identified as the most critical clinical factor correlated with major discordance. Other potentially relevant factors included high BMI and male sex. The adjusted FRAX score for major osteoporotic fracture risk was 14% in both major and minor discordance groups. Patients with osteoporosis in both sites had the highest risk of major osteoporotic fracture at 22%. In clinical practice, physicians may be able to identify T-score discordance early on by focusing on relevant factors and minimizing the risk of fractures in this vulnerable population.
Supplemental Material
sj-docx-1-tab-10.1177_1759720X231177147 – Supplemental material for T-score discordance between hip and lumbar spine: risk factors and clinical implications
Supplemental material, sj-docx-1-tab-10.1177_1759720X231177147 for T-score discordance between hip and lumbar spine: risk factors and clinical implications by Ming-Hsiu Chiang, Yeu-Chai Jang, Yu-Pin Chen, Wing P. Chan, Ying-Chin Lin, Shu-Wei Huang and Yi-Jie Kuo in Therapeutic Advances in Musculoskeletal Disease
Footnotes
References
Supplementary Material
Please find the following supplemental material available below.
For Open Access articles published under a Creative Commons License, all supplemental material carries the same license as the article it is associated with.
For non-Open Access articles published, all supplemental material carries a non-exclusive license, and permission requests for re-use of supplemental material or any part of supplemental material shall be sent directly to the copyright owner as specified in the copyright notice associated with the article.