
Abstract
Background:
Osteoarthritis (OA) has traditionally been considered a disease of older adults (⩾65 years old), but it may appear in younger adults. However, the risk factors for OA in younger adults need to be further evaluated.
Objectives:
To develop a prediction model for identifying risk factors of OA in subjects aged 20–50 years and compare the performance of different machine learning models.
Methods:
We included data from 52,512 participants of the National Health and Nutrition Examination Survey; of those, we analyzed only subjects aged 20–50 years (n = 19,133), with or without OA. The supervised machine learning model ‘Deep PredictMed’ based on logistic regression, deep neural network (DNN), and support vector machine was used for identifying demographic and personal characteristics that are associated with OA. Finally, we compared the performance of the different models.
Results:
Being a female (p < 0.001), older age (p < 0.001), a smoker (p < 0.001), higher body mass index (p < 0.001), high blood pressure (p < 0.001), race/ethnicity (lowest risk among Mexican Americans, p = 0.01), and physical and mental limitations (p < 0.001) were associated with having OA. Best predictive performance yielded a 75% area under the receiver operating characteristic curve.
Conclusion:
Sex (female), age (older), smoking (yes), body mass index (higher), blood pressure (high), race/ethnicity, and physical and mental limitations are risk factors for having OA in adults aged 20–50 years. The best predictive performance was achieved using DNN algorithms.
Introduction
Osteoarthritis (OA) affects a great number of people, affecting the society in terms of health and financial costs. Although OA has traditionally been considered a disease of older age, it can also affect younger adults, having a profound impact on their psychosocial well-being and work capacity. Early signs of OA can be present up to two decades prior to formal diagnosis. 1 Data from the Global Burden of Disease (GBD) study indicate a steady growth in disease burden due to OA since 1990 among people aged 15–49 years, with the greatest burden evident for females. The rate of primary knee replacement for people aged 20–49 years increased by 76% in the United States from 2001 to 2007, and the prevalence of knee OA has more than doubled since the mid-20th century. 2
Younger populations with OA represent a new public health issue, given that these individuals will likely live with OA for a longer time than previous generations. Moreover, early OA detection in younger adults is important for public health because they tend to be more active than older adults, and OA has a heavy impact on work, sport, and quality of life. Identifying risk factors of OA in early stages among younger adults may help prevent severe OA through medical treatments, physiotherapy, joint viscosupplementation, or surgical procedures (e.g. valgus knee osteotomy, Bernese pelvic osteotomy).
Although there are several studies concerning risk factors for OA, only recently have machine learning methodologies begun to be used in OA research,3,4 especially with the population under 50.1,2 Current guidelines are not well suited for diagnosing patients in the early stages of OA and do not identify patients for whom OA might progress rapidly. To improve current practices, a comprehensive patient-specific risk models need to be developed and tested. Approaches such as data mining and machine learning will aid in the development of such models. 3
Since general OA is suspected by clinical examination and confirmed by diagnostic imaging (mostly X-ray), many studies focus on detecting OA using machine learning, specifically Neural Nets, for image learning. However, recent studies 5 show that using statistical data based on demographic and personal characteristics without any medical images to predict the occurrence of diverse forms of OA can have a significant impact on preventive medical care (e.g. specific occupational or physical therapy) and on better choosing subjects who would need X-rays to avoid unnecessary irradiation.
Datasets in medicine are becoming larger; to analyze these vast amounts of data, researchers need to look beyond traditional statistical methods. 6 A supervised machine learning model named ‘PredictMed’ 7 has been developed and validated to predict health conditions in patients with developmental disorders.8–12 In the current study, we applied an upgraded version named ‘Deep PredictMed’ based on deep learning, logistic regression (LR), and support vector machine (SVM) for identifying risk factors of OA in subjects aged 20–50 years from the National Health and Nutrition Examination Survey (NHANES–USA national health survey). Therefore, the objectives of this study were to identify risk factors for OA in younger adults using machine learning and compare the performance of different machine learning models.
Methods
Subjects, predictors, and subject selection
Subjects
Subjects were selected (Figure 1) from the NHANES cohort (https://www.cdc.gov/nchs/nhanes/index.htm) which included 52,512 Americans aged 20 years or older. The guidelines of the ‘Transparent Reporting of a Multivariable Prediction Model for Individual Prognosis or Diagnosis Statement’ (TRIPOD) were followed 13 .

The selection process for the study population (NHANES: National Health and Nutrition Examination Survey).
Outcomes
Possible OA risk factors/associated conditions were analyzed among 31 variables from the NHANES data (Table 1). They were selected based on clinical experience and literature on OA risk factors.1–3,14 The NHANES includes data on age, gender, race/ethnicity, family, poverty income ratio (PIR), education level, cigarette smoking, physical activity, and various medical conditions. Poverty status was defined by using the poverty income ratio (PIR), an index calculated by dividing family income by a poverty threshold specific to family size. PIR was estimated using NHANES guidelines and adjustment for family size, year, and state of residence. PIR was reported by three levels: ⩽1.3 (low), >1.3–3.5 (middle), and >3.5 (high).
List of dependent and independent variables selected from the National Health and Nutrition Examination Survey.

Participants were asked about physical activity and were classified as being physically active if they reported walking, cycling, and performing moderate or vigorous work or leisure/home activity. Body mass index (BMI) was calculated as weight in kilograms divided by height in meters squared. Participants were considered to have a normal weight if they had a BMI <25 kg/m2, to be overweight if they had a BMI between 25 and 30 kg/m2, or obese if their BMI was 30 kg/m2. Diabetes was defined by reported physician diagnosis, fasting plasma glucose >126 mg/dl, 2-h oral glucose tolerance test >200 mg/dl, or glycohemoglobin >6.5%. 12 Hypertension was defined by reported physician diagnosis or mean systolic blood pressure (of up to four measurements on two separate occasions) >140 mmHg. Other comorbid conditions included reported diagnosis of myocardial infarction (MI) and stroke, 14 and presence of physical and mental limitations caused by long-term physical, mental, and emotional problems or illness. The Physical Functioning Questionnaire (PFQ) was filled in by trained interviewers, using the Computer-Assisted Personal Interview (CAPI) system. 14
Subject selection
Selected 19,133 participants younger than 50 years were divided into categories with or without OA. As reported in a previous study 14 on demographic and personal characteristics from NHANES database, the dependent variable OA was ascertained based on the question, ‘Has a doctor or other health professional ever told you that you have arthritis?’ and participants were classified as having OA if they reported ‘Osteoarthritis’ to the question ‘Which type of arthritis?’
Data analysis
Feature reduction, removing features with low variance, 15 was performed and compared with feature generation by principal component analysis (PCA). 16 LR, 17 deep neural network (DNN), 18 and SVM19–21 were used separately for predicting OA.
DNN model development
The 19,133 participants’ dataset with 31 raw features was split into three groups: Training (76.5%), Test (15%), and Validation (8.5%). Figure 2 shows prediction algorithm flow diagram using a DNN model with scaled PCA data (with 31 raw features) split into training, testing, and validation sets; data preprocessing with a scaler was used to convert categorical variables into continuous variables, and PCA was employed to generate new features. The DNN model was trained with scaled PCA variables to generate a trained DNN model; model predictions were evaluated by comparison with the true data labeled by clinicians in the test set. We divided the training and test data to avoid overlapping of participant data.

Prediction algorithm flow diagram.
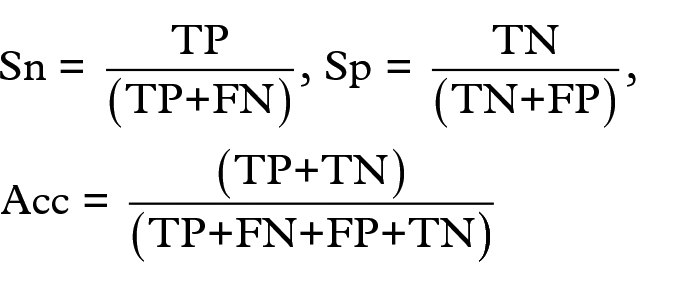
Model performance was evaluated based on the number of true positives (TP), true negatives (TN), false positives (FP), and false negatives (FN). TP was the correctly predicted OA participants, and TN was the correctly predicted non-OA participants. FP and FN were the incorrectly predicted OA and non-OA participants, respectively. The two-classed dataset we used in this study was imbalanced because there were more subjects without (17,835) than with OA (1298). To deal with this, we used three metrics for proper evaluation: 20 accuracy (Acc), sensitivity (Sn), and specificity (Sp). They were calculated using the following equations:
In addition, we evaluated the area under the receiver operating characteristic (ROC) curve (AUC); it evaluates an algorithm performance using one single value.
Data preprocessing
PCA is a data processing methodology for extracting relevant information from datasets. By preprocessing data features, PCA obtains new features in a compact way: new features are the projection of original features onto few dimensions of the data space (the principal components, retaining the maximum data variance), so finding structures that enable a better fitting of classification algorithms. 16
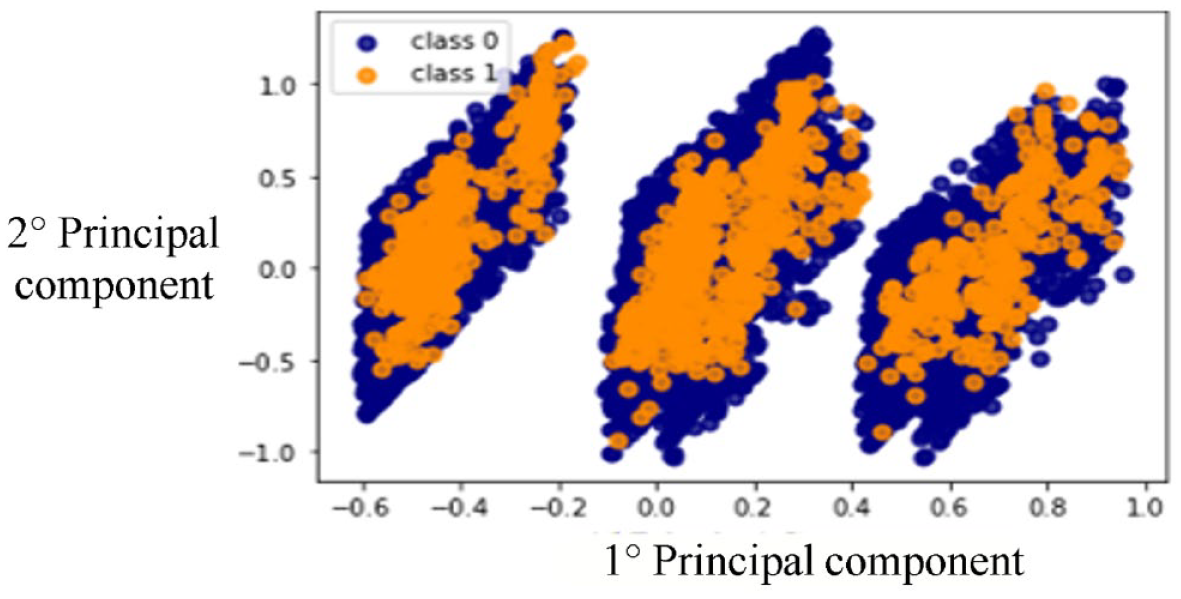
The dataset used in this study included categorical/binary and continuous variables. To achieve a better classification performance of the DNN classifier, we converted all 31 binary or categorical variables into 31 continuous variables using scikit-learn Scaler methods: 3 StandardScaler, RobustScaler, and Quantile Scaler. We also tried not scaled PCA. Figures 3 and 4 show the first and second principal components of: (a) not scaled PCA and (b) PCA with Quantile Transformer Scaler.

Two-dimensional plot of first and second principal components of not scaled principal component analysis.
Two-dimensional plot of first and second principal components of quantile scaled principal component analysis.
We also studied the use of Feature Reduction (as an alternative method to PCA) by removing features with low variance using the scikit-learn method feature_selection.VarianceThreshold. Out of 31 variables, the following 7 showed higher variance than the threshold (set empirically at 0.8): sex, age, cigarette smoking, BMI and high blood pressure (HBP), race/ethnicity, and physical and mental limitation. Next, we used the reduced dataset of 19,133 patients with the seven significant variables as input data to the DNN (scaled data).
DNN structure
A feed-forward neural network trained with standard backpropagation was used in several different configurations of learning models. For each model, hyperparameters were adjusted, including the number of hidden layers, the number of neurons in each layer, the activation function, the optimization method, the learning rate, the batch size, and regularization techniques. The DNN with the best predictive performance had four hidden layers with 50, 30, 8, and 2 neurons in each layer, respectively. The last output layer, with two neurons, used a Sigmoid activation function. The optimization loss function had accuracy metrics and sparse_categorical_crossentropy loss function. Adam optimization was used. 22 The DNN used the SeLU activation function 23 in each layer and Regularization (0.001) in each layer. 24
We took into account the unbalanced nature of the dataset using the technique of ‘class weighting’,25,26 hence giving different weights to both the majority and minority classes. Class weights were used to fix the issue of unbalanced classes in the dataset, making the minority classes more important. The technique was implemented using dedicated Keras functions for deep learning. 18
Epoch size and batch size of the training setting were set to 3000 and 256 sets, respectively. All models were implemented using Keras 18 with TensorFlow and several python scikit-learn methods. 27
We also evaluated other two methods to increase DNN performance: Dropout 28 and Batch normalization 11 techniques. Batch normalization helps to reduce sensitivity to initial starting weights. Dropout is used to push the model to a better generalization, reducing overfitting. Both Dropout and Batch normalization did not lead to a significant improvement in DNN performance.
Comparison with LR and support vector classifiers
We compared the predictive performance of the DNN model with the Logistic Regression Classifier (LRC) and Support Vector Classifier (SVC) models.
LRC: We performed LR to identify the presence of OA based on sex, age, cigarette smoking, BMI and HBP, race/ethnicity, and physical and mental limitations.
The LRC performs the regression on a training test and test set, and accuracy is calculated. Then this step is repeated on a new training test and test set obtained by reshuffling previous training and test set, and accuracy is re-calculated. The process is repeated 20 times and the 20 accuracy values are finally averaged to obtain the final accuracy value. The same process is used to calculate final average sensitivity and specificity.
The following procedure was implemented:
Split the 19,133 participants into training (80%) and test (20%) sets and perform LR to predict the probability of each patient of the test set to have OA.
Classify each patient having a probability p > threshold to be OA-positive.
Calculate accuracy, sensitivity, and specificity of the prediction.
Randomly re-shuffle the training and test sets, re-perform regression, and re-calculate accuracy, sensitivity, and specificity.
After 20 re-shuffles, calculate average accuracy, sensitivity, and specificity.
The LR algorithm was based on General Linear Model from R-programming language. 30
SVC: On the same dataset used for LRC (19,133 patients, seven variables, plus OA as target variable), we split the 19,133 patients into training (80%) and test (20%) sets. We used an SV-Clat as our cassifier (scikit-learn – svm.SVC) with a set-up taking into account the unbalanced dataset. After fine-tuning of the SVC hyperparameters (using scikit-learn SVM grid search method), we used a ‘poly’ kernel of degree seven with a cost C-value = 10,000 and a gamma_value = 0.0001. We randomly re-shuffled the training and test sets 10 times, each time calculating accuracy, sensitivity, and specificity.
Results
The models identified female sex, older age, race/ethnicity (Mexican American < Other Hispanic < Non-Hispanic White < Non-Hispanic Black < Other Race), being a smoker, having HBP and high BMI, and physical and mental limitations as factors significantly (p < 0.01) associated with OA in adults aged 20–50 years. We found the variables associated with OA using the WALD z-test (Table 2). 21 DNN outperformed LRC and SVC. DNN using both scaled data and PCA showed the best results in terms of accuracy, sensitivity, specificity, and ROC curve area, similar to previous studies on OA detection with deep learning. 16 The DNN after hyper-parameter tuning had 71% accuracy, 68% sensitivity, 71% specificity, and 75% ROC curve area (AUC). The ROC curve for the predictive performance of DNN with scaled PCA is shown in Figure 5, together with the Confusion Matrix showing the values of TP, TN, FP, and FN found by the DNN. This preprocessing showed a worse predictive performance when compared with the scaled PCA. Even using PCA after feature reduction did not show any improvement in comparison with simple scaled PCA preprocessing. The Dropout 28 and Batch normalization 30 techniques showed no significant impact on the DNN performance. Training Loss and Validation Loss curves were compared, showing similar decreasing trends (Figure 6), revealing a good fit of the DNN learning algorithm and showing no over- or underfitting.
List of the logistic regression coefficients (independent variables) associated with osteoarthritis.


Receiver operating characteristic curve and confusion matrix.

Training versus validation loss curves.
Results obtained using different input features are shown in Table 3. We repeated the comparison among DNN, LR, and SVM algorithms using same PCA features for all of them (Table 4). The combination of DNN and PCA with quantile transformer scaler showed the best predictive performance (Figure 3).
Metrics comparison of LRC, DNN, and SVM algorithms (different input features).

DNN, deep neural network; LRC, logistic regression classifier; SVM, support vector machine.
Metrics comparison of LRC, DNN, and SVM algorithms (same PCA input features).

DNN, deep neural network; LRC, logistic regression classifier; SVM, support vector machine.
Discussion
Early signs of OA can be present in those aged between 15 and 49 years, up to two decades prior to formal diagnosis.1,2 Although there are several studies looking at risk factors for OA,1–4,31–35 only recently have machine learning methodologies begun to be used in OA research, and to the best of our knowledge, no studies are applying predictive models in the population under 50 years old.
We applied ‘Deep PredictMed’ models based on deep learning, LR, and SVM for identifying risk factors of OA in subjects aged 20–50 years from a large US national survey. The DNN overall predictive performance was better than the LRC and SVC models. The sensitivity of the LRC was lower than the DNN (50% versus 68%) since DNN deals better with unbalanced data.
In accordance with previous studies5,36,37 with older patients, the present research confirmed age, female sex, obesity, ethnicity, and smoking as risk factors of OA in patients aged 20–50 years. As reported in current literature, we also found that early OA was associated with increasing age and female sex.1–4,31,32 The increase in OA with age is a consequence of cumulative exposure to risk factors and biological changes such as oxidative damage, thinning of cartilage, or muscle weakness. 33
There are known racial/ethnic differences in radiographic OA features. Our study confirms that African Americans are more likely to develop OA.38–42 Moreover, we found that compared with other ethnical groups, Mexican Americans and other Hispanics are less likely than young non-Hispanic Blacks and non-Hispanic Whites to have early OA. We also confirmed1–4,31,32 that HBP, cigarette smoking, and high BMI are associated with early onset of OA in younger adults. This highlights the need for preventive measures concerning general health (smoking cessation, improved nutrition, and physical activity) for preventing OA in younger adults. This also highlights the correlation between good physical condition and delay of the onset of OA. Another interesting finding was the correlation between early OA and physical and mental limitations, to be investigated more in depth in the future. However, from our results, we cannot exclude a reverse causal mechanism, that is, the physical and mental limitation should increase the risk of OA or vice versa.
Data mining and artificial neural networks can help the clinical decision-making process and precision medicine in the prediction of OA in people less than 50 years old. The proposed method identifies risk factors of having OA with indirect or limited data, such as the statistical data of medical utilization and health behavior information. This can be advantageous for possible patients to prevent future medical costs, reduce the time for diagnosis, and avoid unnecessary testing. Of course, no method is a panacea, and analysis of large datasets can also generate seemingly meaningful results which are in fact spurious artifacts. As datasets become ever larger and incorporate more complex variables, it becomes increasingly important to link confirmatory analysis with the scientific discovery process while incorporating study design and subject area expertise. 4
PredcitMed algorithm can help identifying subjects at risk and, therefore, anticipating X-ray and diagnosis of OA to propose conservative treatments instead of joint replacement. These results from the machine learning methods allow for the prediction of the presence of OA with good accuracy. The first clinical applications should be as follows:43,44
In the case of osteo-articular pain and/or stiffness, the general practitioner (GP) could be alerted if the subject presents one or more risk factors, in which case medical imaging could be quickly proposed to confirm OA, and if present, specific treatment.
A score should be developed to help GPs, occupational physicians, and sports doctors better assess the risk of early OA to improve counseling and orientation of the type of work and sport activities.
Global health prevention measures concerning obesity, smoking, and hypertension are confirmed as important for early OA prevention, beyond their well-known role in cardiac and general health.
Early OA can be treated with non-surgical means such as viscosupplementation and medications (chondroitin sulfate, etc.); moreover, some localizations of early OA (e.g. knee and hip) are available for joint preservation through conservative surgical treatments such as osteotomies, whereas late discovery usually results in joint resection and arthroplasty.34,35
Limitations and future directions
Despite similar studies on OA14,33 using NHANES database have been conducted, survey data have limitations. Self-reported data may lack objectivity. For instance, a subject could have assumed ‘osteoarthritis’ even if the diagnosis is different; on the other hand, a subject could have real symptomatic OA and ignore it. Moreover, this analysis does not take into account the various localizations of OA but only its presence or absence, whereby we planned to investigate the type, the topography, and the progression of OA and knee OA on the Osteoarthritis Initiative database and on a prospective cohort in a future study.
Furthermore, only available variables were explored. Many participants were excluded from the dataset due to unavailable data. Most input features were of binary type. Even if scaled PCA were used to improve data separation (Figures 3 and 4), new additional feature inputs would be required for optimization. In addition, we excluded subjects who were receiving treatment for OA. This issue may reduce the overall accuracy of the prediction model. Another limitation is that we cannot attribute cause–effect relationships. From our study, it is unclear whether physical or mental disability is a risk factor or a consequence of OA. We plan to develop this study in the future.
After developing a prediction model, external validation is strongly recommended to evaluate the performance of the model in other participant data.13,45 Such external validation requires that, for each individual in the new dataset, outcome predictions be made using the original model and be compared with the observed outcomes.45,46 We plan to validate the present model in a future study with the Osteoarthritis Initiative dataset. The next steps of our study will also include three main goals: improve the quality of the data, the predictive performance of the model, and the prediction of knee OA progression. Regarding the quality of the data, we aspire to obtain increasingly selected clinical features associated with OA to define more precisely the OA patient type and to avoid missing data.
The DNN predictive model could also be trained (and tested) on different datasets having different features; we can build these datasets based on our specific research goals. For example, we could use as dataset features age, BMI, and gender only (or other similar combinations of features) and we could use these data to train and test the model, verifying the predictive performance of the model itself.
To improve the predictive performance of the model, we plan to replace the DNN with an Ensemble of classifiers (like a stacking of Neural Nets or a combination of DNN with SVM and/or LR). In addition to this, we also plan to study how to implement our models (DNN, SVM, or Ensemble) to other datasets of patients with diabetes. Another possible development would be to test this model on a set of non-American subjects and using the same training and test set splits for all the models.
Based on the DNN-PredictMed model presented in this study, in future we aim to develop a predictive algorithm that, after a training phase, having as input the patient data like age, gender, presence of associated pathologies, weight, and so on will be able to provide as output the probability for that patient to develop OA in a given timeframe (3–5 years) after patient data have been taken. We think that this kind of algorithm, if implemented in a user-friendly web application (or a similar tool), could be of great help in supporting clinical decision based on a more accurate prediction of OA developments.
Conclusion
Gender (female), age (older), smoking (yes), BMI (higher), blood pressure (high), race/ethnicity (Mexican American < Other Hispanic < Non-Hispanic White < Non-Hispanic Black < Other Race), and physical and mental limitations are risk factors for OA in adults aged 20–50 years. The best predictive performance was achieved using DNN algorithms.