
Abstract
Background:
To systematically review the diagnostic accuracy of salivary gland ultrasound in primary Sjögren’s syndrome (pSS).
Methods:
PubMed, Embase, CINAHL, Cochrane Central and Scopus and ClinicalTrials.gov were searched to identify diagnostic or validation studies in patients with pSS meeting the diagnostic criteria. A diagnostic test meta-analysis was performed using a bivariate model to calculate the pooled sensitivity, specificity, positive/negative likelihood ratios, and the diagnostic odds ratio. Meta-regression analyses were done for several pSS covariates.
Results:
Sixty-five studies met our criteria for the qualitative review. Fifty-four studies with a total of 6087 patients were included in the meta-analysis. Pooled sensitivity for salivary gland ultrasound was 80% [95% confidence interval (CI): 77–83%; I2 = 78%], and specificity was 90% (95% CI: 87–92%; I2 = 76%). The pooled positive and negative likelihood ratios were 8 (95% CI: 6.4–10) and 0.22 (95% CI: 0.19–0.25), respectively. The corresponding pooled diagnostic odds ratio (DOR) was 37 (95% CI: 28–48). Separate meta-regression models resulted in similar diagnostic estimates: (a) adjusted for mean age: sensitivity 81% (95% CI:77–84%; I2 = 99%) and specificity 90% (95% CI: 87–93%; I2 = 99%); (b) adjusted for mean disease duration, sensitivity 79% (95% CI:72–84%; I2 = 99%), and specificity 90% (89–94%; I2 = 99%). The diagnostic estimates were robust to sensitivity analyses by quality criteria, pSS diagnostic criteria and ultrasound scoring systems.
Conclusion:
Salivary gland ultrasound is a valuable modality for the diagnosis of Sjögren’s syndrome. It is plausible that salivary gland ultrasound can be used as an important criterion for the diagnosis of pSS.
Keywords
Introduction
Primary Sjögren’s syndrome (pSS) is a systemic autoimmune disease that predominantly affects the exocrine glands, namely the salivary glands (SGs) and lacrimal glands. It is characterized by focal lymphocytic infiltration of the glands. It is one of the most common autoimmune rheumatic diseases. Epidemiology studies have reported prevalence rates considerably ranging from 0.03% to 2.7%, depending on the classification criteria used. 1 It has a wide range of systemic clinical manifestations that can affect, essentially, any organ system. Symptoms of pSS may be non-specific, progress slowly and may overlap with other conditions, making it a diagnostic challenge at times. Data show that the disease remains undiagnosed in more than half of affected adults. 2 Delays in diagnosis may be a source of psychological distress due to unexplained symptoms. 3 Apart from this, it is essential to accurately diagnose pSS because of the extraglandular manifestations, including the risk of oncohematologic disorders such as a 16-fold increased risk of developing lymphoma. 4
The current diagnostic criteria for pSS, per the American College of Rheumatology (ACR) and the European League Against Rheumatism (EULAR) committees, are based on five objective tests/items, including SG biopsy (ACR/EULAR criteria). 5 However, the above criteria are being used in research, as the average clinician does not perform all these tests. Sialography and minor SG biopsy, labial biopsy/lip biopsy, are the established and objective examinations in diagnosing pSS. However, because of the invasiveness and complications associated with these tests, their clinical use is limited. Alternatives to these invasive tests include magnetic resonance imaging (MRI) and ultrasonography (US). Imaging by either modality can depict ultrastructural changes which: (a) may aid in early diagnosis of pSS; (b) form the basis of an outcome tool to see if therapies slow progression of structural changes; (c) possibly identify complications such as glandular lymphoma. US, as compared with MRI, is easily accessible, quick, and relatively inexpensive to use. 6 It is also non-invasive, non-ionizing, portable, and can be easily repeated to follow disease course. Utilizing the US B-mode method, it is possible to classify the degree of SG involvement based on parenchyma homogeneity, echogenicity, gland size, and posterior glandular border. 7 Also, power Doppler allows assessment of the vascularization of the SG parenchyma and the pathological changes further complementing the structural glandular evaluation. Historically, there has been a lack of consensus regarding the definitions and scoring of SG US findings that has limited its use for the diagnosis and monitoring of pSS. In 2017, international pSS experts developed an atlas of the most common parenchymal abnormalities detected by the B-mode US in patients with pSS, 8 and in 2019, the Outcome Measures in Rheumatology Clinical Trials (OMERACT) SG US task force group published definitions and a simple semi-quantitative scoring system based on the evaluation of parenchymal homogeneity of the four major SGs. 9
This four-grade scoring system (from 0 to 3) for the parotid and submandibular in patients with pSS was defined as: grade 0, normal parenchyma; grade 1, minimal change: mild inhomogeneity without anechoic/hypoechoic areas; grade 2, moderate change: moderate inhomogeneity with focal anechoic/hypoechoic areas; grade 3, severe change: diffuse inhomogeneity with anechoic/hypoechoic areas occupying the entire gland surface. 9
In addition to the early diagnosis of pSS, US scan (USS) has also been used for its prognostic value and monitoring of treatment response.10–12 Five major systematic reviews recently addressed this topic with two publications in 2018,13,14 one in 2016, 15 one in 2015, 16 and one in 2014. 17 However, there were some limitations in each. In the 2014 systematic review by Song and Lee, 17 only case-control studies were included. Furthermore, their meta-analyses were done on only six studies and there was no report on publication bias. In addition, there were some concerns, as highlighted by Delli et al., 18 that there was a discrepancy between the data shown in the meta-analysis and the data presented by the source studies. The 2015 systematic review conducted by Delli et al. 16 did not perform subgroup analysis, likely introducing bias. Publication bias was highly possible and significant heterogeneity was detected among studies. In 2016, Jousse-Joulin et al. 15 assessed the metric properties of US in patients with pSS according to OMERACT filter three main component criteria that is truth, discrimination and feasibility. Truth validity (construct validity) results showed the superiority of US to sialography. Comparing the available literature, given the different study designs and US scoring system, was noted to be a challenge in this systematic review. 15 The 2018 systematic review by Zhou et al. 14 had rigid selection criteria, and studies included in this meta-analysis used one pSS diagnosis standard from the American–European Consensus Group (AECG) criteria. 19 Other limitations of this study included confirmatory and selection bias. The 2018 systematic review by Martire et al. 13 was limited to articles published in English, and was also purely descriptive without any meta-analyses.
Given these limitations and the number of studies of interest published since these were performed, a reappraisal of the literature was justified. The primary goal of this systematic review was to determine the diagnostic accuracy of SG US compared with standard diagnostic criteria in patients with pSS.
Methods
This review was reported according to the Preferred Reporting Items for Systematic Reviews and Meta-Analyses for Diagnostic Test Accuracy (PRISMA-DTA) statement 20 and performed according to the methodology described in the Cochrane Handbook for performing systematic reviews. 21 The study protocol was registered in the Prospero International Prospective Register of Systematic Reviews (registration number CRD42020137047).
Data sources and searches
We considered any diagnostic or validation studies that included adults with sicca symptoms being investigated for primary Sjögren’s syndrome (as diagnosed using recognized diagnostic criteria) who had SG US performed and assessed its diagnostic accuracy. We considered both full-text published studies, as well as abstracts, as long as one or more measures of accuracy of SG US were reported in the abstract. Pre-specified measures of accuracy included sensitivity, specificity, positive or negative likelihood ratio, receiver-operating characteristics (ROC) curve or the area under the curve (AUC) and the DOR.
The following electronic databases were searched: PubMed, Embase, CINAHL, Cochrane Central and Scopus from the start date of the database to September 2019. We also searched ClinicalTrials.gov for unpublished trials and studies. Search keywords were developed with the assistance of a research librarian (KHS) and included ‘Sjogren’s syndrome,’ ‘salivary glands,’ ‘ultrasonography,’ ‘Sjogren’s Syndrome A/Sjogren’s Syndrome B (SSA/SSB) antibodies,’ ‘sicca,’ ‘biopsy,’ ‘salivary-flow,’ and ‘seronegative.’ Whenever possible, MeSH terms and advanced searched strategies were used. The electronic database searches were complemented by manually reviewing the references of relevant reviews and included studies. The gray literature was searched and we included titles from all languages, without restricting to English.
Study selection and data extraction
Two reviewers KR and SM independently assessed all titles and abstracts. EndNote X7 software (Clarivate Analytics, Philadelphia, PA, USA) 22 was used to manage the records retrieved from electronic database searches. For all potentially eligible studies, the full-text papers were obtained and their eligibility assessed. Two independent abstractors (KR and SM) captured all pertinent data from each eligible study directly into a customized data extraction form created in Microsoft Excel. We extracted the following characteristics from all included studies: study design, mean age of pSS patients, number of patients studied, criteria used for pSS diagnosis, the mean duration of Sjögren’s syndrome, the US procedure/US criteria referenced and US findings, including the different scoring systems used in the scanned glands (semi-quantitative or quantitative score count in the glands). The pSS diagnostic criteria include the AECG diagnostic criteria, 19 the ACR criteria, 23 the ACR/EULAR criteria, 5 the European Community Study Group (ECSG) criteria, 24 the criteria proposed by Fox et al., 25 and the revised Japanese criteria. 26 We resolved any disagreements between the two reviewers by a discussion and when a consensus could not be reached, resolved it in consultation with an arbiter (GSK).
Quality assessment
The quality of all studies was assessed independently by two reviewers (KR and SM), using the risk of bias and applicability concerns checklist derived from the Quality Assessment of Diagnostic Accuracy Study 2 (QUADAS-2) 27 tool as recommended by the Cochrane methods. Consensus was achieved by discussion or by the help of an arbiter (GSK). The QUADAS-2 recommends that studies of interest be assessed according to the risk of bias and applicability concerns through several signaling questions under the domains outlined below. The risk-of-bias domains appraise patient selection (avoidance of case-control design, avoidance of inappropriate exclusions and random selection in recruitment), index test (blinding and pre-specified cut-offs of the US criteria used), reference standard (blinding and classification bias regarding pSS diagnostic criteria), and flow and timing (appropriate timing between index and reference). The applicability concerns address if patient selection, index test and reference standard matched that of the question this review sought to answer. Based on the answers to the signaling questions a rating of ‘low,’ ‘high,’ or ‘unclear’ was assigned to the seven quality domains for each study in this review.
Strategy for data synthesis
Accuracy data were used to construct a 2 × 2 tables of US results and the diagnosis of Sjögren’s syndrome. We abstracted and recorded the true-positive, false-positive, true-negative and false-negative values. If data were not provided in the original publications, it was calculated from the raw data or obtained by contacting the authors by phone or electronic mail. For studies reporting the diagnostic accuracy of various cutoff points, the most accurate (maximum sum of sensitivity and specificity) values were utilized for the main meta-analysis.
We performed a diagnostic test meta-analysis using a bivariate meta-analysis model to calculate the pooled sensitivity, specificity, positive/negative likelihood ratios, as well as the DOR. We also constructed the respective hierarchical summary receiver-operating characteristic (HSROC) curve to summarize the paired sensitivity and specificity estimates instead of the traditional summary receiver-operating characteristic model. Paired forest plots of sensitivity and specificity were used to represent individual studies’ estimates, along with their precision, represented by their exact 95% confidence intervals (CIs). Studies that used various US scoring ranges were analyzed initially as a single group but also subgroup meta-analyses were conducted to assess whether diagnostic accuracy differed by scoring ranges employed.
We conducted formal testing for publication bias using the Deek’s funnel-plot asymmetry test: a regression of diagnostic log odds ratio against 1/sqrt (effective sample size) weighting by effective sample size (p < 0.10 for the slope coefficient indicating significant asymmetry). 28 All analyses were performed utilizing Stata 15.0 statistical software package (Stata Corporation, College Station, TX, USA) 29 and Meta-DiSc version 1.4.
Results
Study identification and selection
The results of the study-selection process are shown in Figure 1. The initial electronic research identified 410 articles, of which 31 articles were excluded due to duplication. We eliminated 300 titles based on the review of either their title or abstract, and 79 studies that fulfilled the inclusion criteria were included for a full-text review. After reviewing the text and the results of each study, 14 articles were excluded due to incomplete data. Sixty-five studies met our criteria for the qualitative review. Finally, 54 studies with a total of 6087 patients were included in the meta-analysis. The total number of patients with Sjögren’s syndrome was 3406 (prevalence = 56%).

Study flow diagram.
Quality assessment of studies
Results of QUADAS-2 evaluation are shown in Figures 2 and 3. None of the included studies had a low risk of bias in all four categories of QUADAS-2. Overall, a majority of the included studies had an unclear risk of bias, but low concerns about applicability. There was a high risk of bias for patient selection, index test, (US criteria) choice of the reference standard (exact diagnostic criteria used for diagnosis of pSS), and patient flow and timing of both tests in 25%, 20%, 5%, and 3% of the 65 studies, respectively.

Risk of bias and applicability concerns graph: review authors’ judgments about each domain presented as percentages across included studies.
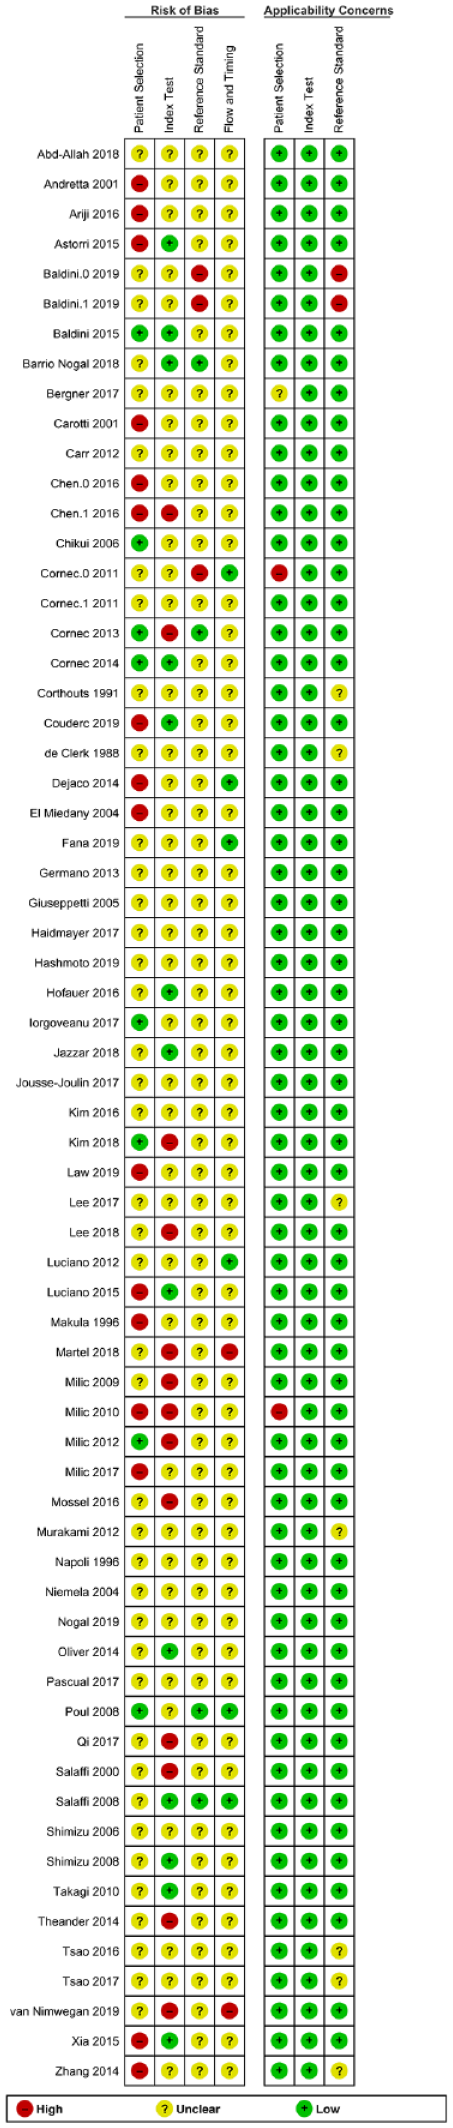
Risk of bias and applicability concerns summary: review authors’ judgments about each domain for each included study.
Study characteristics
A description of all studies included in this systematic review is shown in Appendix 1. Most studies utilized a cross-sectional design and applied contemporaneous diagnostic criteria. The American European Consensus Group diagnostic criteria 19 was the most commonly applied reference standard used by 55% (36/65) of the studies, followed by ACR)/EULAR criteria in 11% (7/65) and the ECSG criteria in 6% (4/65) of the studies.
The mean age of people in included studies with pSS was 53.7 years (range 46–61.3 years). The mean duration of pSS symptoms was 6.1 years (range 1.8–12.3 years). Most studies compared pSS patients with subjects with sicca symptoms (84.7%), while in 15.3% (10/65) studies, the only comparison group was healthy controls. There was significant clinical heterogeneity, as indicated by the variation in sonography techniques used, as outlined by various authors, as well as the scoring used. Data for other patient characteristics such as sex and race were not available for extraction.
While studies reported on the SSA/SSB status of pSS patients, there was no reporting of diagnostic estimates in subgroups based on SSA/SSB seropositivity. Some studies (7/65) noted significant negative correlations between salivary flow and US scores. A few studies (5/65) highlighted significant associations between US score and disease activity [EULAR Sjögren’s Syndrome Patient Reported Index (ESSPRI) or EULAR Sjögren’s Syndrome Disease Activity Index (ESSDAI)]. Similarly, a minority of studies mentioned associations between US scores and rheumatoid factor (5/65) and gammaglobulin (5/65). There was a general paucity of reporting of associations between pSS complications and the US score. All studies reported on composite US scores for the SGs of interest (submandibular and parotid) without subgroup analyses of results based on individual glands. This review did not include studies that measured sonographic evidence of disease regression.
Appendix 1 also highlights the multitude of sonographic criteria used. The vast majority of the included studies (61/65) examined the inhomogeneity and echostructure of the SGs. A few studies (4/65) looked at the elastic properties of the gland (elastography and shear wave velocity) as isolated measures or in combination with homogeneity features. The majority of studies (43/65) also reported US scores in various ranges with no specific scoring range in some (22/65).
Quantitative synthesis
Publication bias
A total of 54 studies were included in the quantitative synthesis, as described below. The Deek’s funnel-plot asymmetry test (Figure 4) showed that there was no significant publication bias (p = 0.29).

The Deek’s funnel-plot asymmetry test.
Diagnostic accuracy of US
Figure 5 shows the coupled forest plots for sensitivity and specificity values of the 54 studies included in the meta-analysis. Pooled estimates of sensitivity and specificity for US were, respectively, 80% (95% CI: 77–83%; I2 = 78%) and 90% (95% CI: 87–92%; I2 = 76%), each with a significant heterogeneity. The pooled positive and negative likelihood ratios were 8 (95% CI: 6.4–10) and 0.22 (95% CI: 0.19–0.25), respectively. The corresponding pooled DOR was 37 (95% CI: 28–48) that indicates US had a high odds for classifying pSS.

Coupled forest plots’ sensitivity and specificity for US compared with diagnostic criteria for the diagnosis of Sjögren’s syndrome.
The overall HSROC is presented in Figure 6. The HSROC curve produced the summary point estimate. The AUC was 0.92 (0.89, 0.94), suggesting a relatively high accuracy.

Hierarchical summary receiver-operator curve (HSROC) of US for Sjögren’s syndrome.
Meta-regression analysis and subgroup analysis
Meta-regression analyses based on risk-of-bias quality criteria showed significant similarities in the above unadjusted estimates for sensitivity and specificity. Patient selection, index test, reference test, and flow and timing criteria revealed sensitivity/specificity estimates of 80% (74–84)/87% (81–91), 83%(78–87)/90% (85–93), 83% (77–88)/92% (88–95), and 84% (78–89)/91% (86–95), respectively.
Subgroup meta-analyses were also done based on US scoring. Table 1 shows the pooled estimates for the more common US scoring ranges used.
Pooled estimates of sensitivity and specificity based on US scoring ranges.
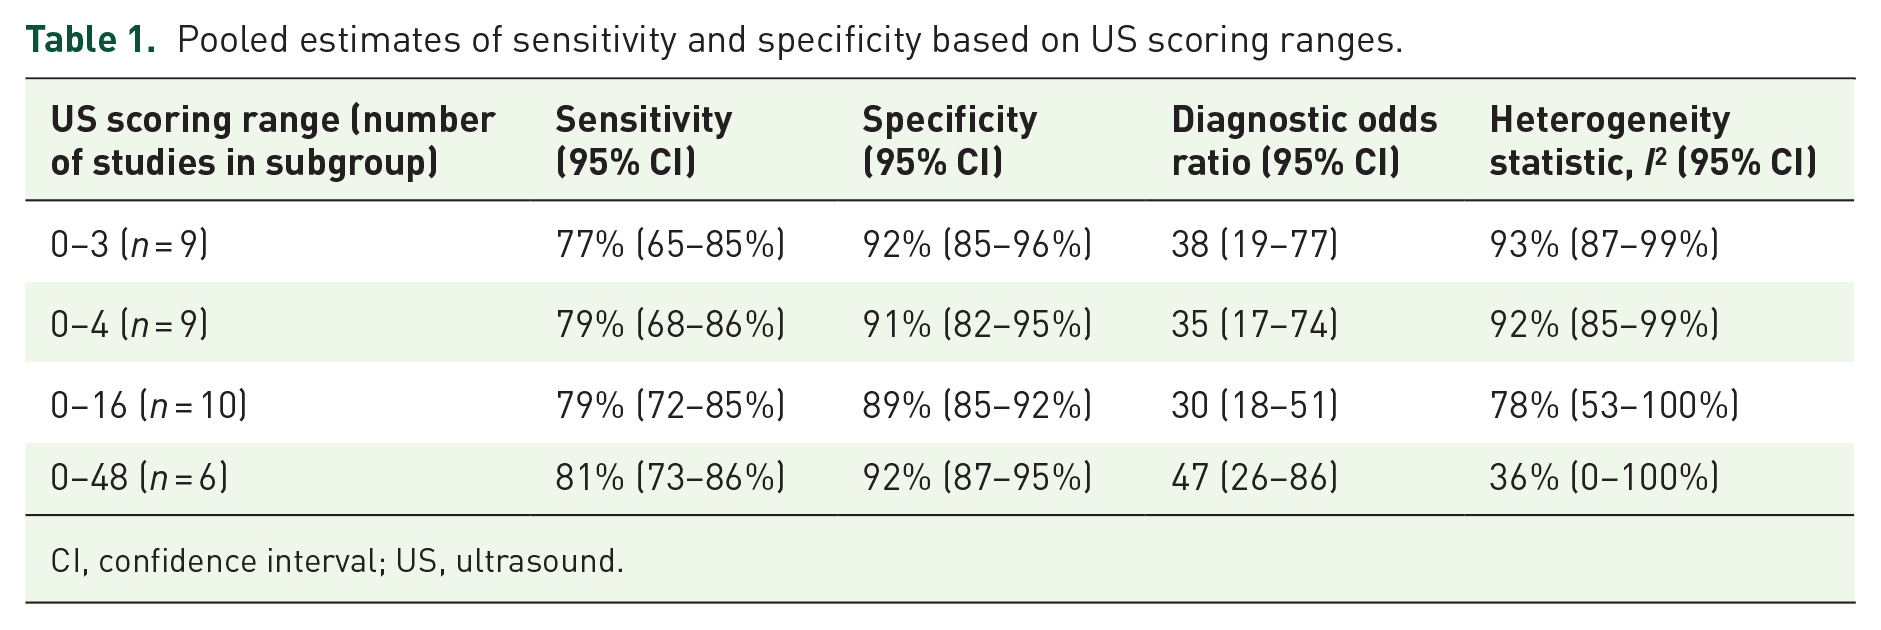
CI, confidence interval; US, ultrasound.
There was a significant overlap in the individual estimates across all subgroups of US scoring ranges. There was also significant statistical heterogeneity in the 0–3, 0–4, and 0–16 scorings. The 0–48 range demonstrated the least heterogeneity. Subgroup meta-analyses could not be performed for the 0–6 and 0–12 groups because of the small number of studies 2 in each of those categories. Subgroup meta-analyses based on primary Sjögren’s syndrome diagnostic criteria were also performed, which are shown in Table 2.
Pooled estimates of sensitivity and specificity based on diagnostic criteria.

CI, confidence interval.
There was a significant overlap in the individual estimates across all subgroups of diagnostic criteria. Subgroup meta-analyses were also done for a mean duration of symptoms by looking at two subgroups, 0–3 and >3 years. In the 0–3-year subgroup (five studies) sensitivity was 72% (64–78%) and specificity 91% (81–96%) [I2 = 68% (29–100%)]. The group >3 years (15 studies) produced sensitivity of 81% (73–87%) and specificity 92% (89–94%), [I2 = 97% (94–99%)]. These findings suggested no major differences in estimates based on disease duration.
Meta-regression
Separate meta-regression models that adjusted for mean age or mean disease duration resulted in diagnostic estimates: (a) age: sensitivity 81% (77–84%) and specificity 90% (87–93%); (b) disease duration: sensitivity 79% (72–84%) and specificity 90% (89–94%), respectively. There was high heterogeneity (I2 = 99%) for both these models.
Discussion
Comparisons with previous systematic reviews
A total of 65 qualitative studies and 54 quantitative studies were included in our review.
This work adds to the existing systematic review literature that looked at US for the diagnosis of pSS, making it the most comprehensive review to date. It also addressed some of the limitations of past reviews. The Deek’s funnel-plot asymmetry test indicates that there was no significant publication bias, as opposed to the previous systematic review by Delli et al. 16 in which there was significant publication bias. Strategies incorporated in our systematic review resulting in reduced publication bias included searching six databases, searching the gray published and unpublished literature, including abstracts, as well as full-text articles, and not having a language restriction. There were two articles published in Italian that were included in our review. Another strength of our meta-analysis was the application of the QUADAS-2 tool. Also, subgroup meta-analyses and meta-regression were done.
In contrast to past reviews, this review analyzed studies based on mean age, disease duration, diagnostic criteria, and risk-of-bias quality criteria. Interestingly, the diagnostic estimates from these analyses did not differ from the overall estimates in this review. This suggests that these factors do not significantly affect the diagnostic performance of SG US. In comparison to the review by Zhou et al. 14 which meta-analyzed studies based on US score, this review showed similar DORs based on the various US scoring ranges. In Zhou’s review the 0–4, 0–48, and 0–16 scorings had DORs of 71 (42–120), 66 (34–129), and 46 (20–107), respectively. 14 This was comparable with the respective DORs of 35 (17–74), 47 (26–86) and 30 (18–54) in this meta-analysis. The above variation in DORs may be explained by the difference in the number of studies included. This review analyzed 25 studies in these three scoring ranges compared with 17 studies that Zhou included. The main similarity between these reviews was the low heterogeneity for the 0–48 US scoring diagnostic odds ratio. Furthermore, in this review, only 15% of the included studies had healthy controls as the comparison group, which minimized spectrum bias that tends to overestimate both sensitivity and specificity.
Ultrasound as a diagnostic tool in primary Sjögren’s syndrome
Despite its apparent accuracy, it should be noted that SG US investigates the parotid and submandibular gland; however, most of the current pSS classification criteria have regarded minor SG biopsy as the gold standard histology examination in pSS. Mossel et al. 30 assessed the validity of SG US compared with parotid and labial gland biopsies in patients clinically suspected to have primary Sjögren’s syndrome and found good correlation between salivary US and parotid biopsy. However, others 31 have highlighted that the labial and parotid biopsy are not always concordant. This is an area that warrants further study.
In this review, SG US had pooled sensitivity and specificity of 80% (95% CI: 77–83%) and 90% (95% CI: 87–92%), respectively and pooled positive and negative likelihood ratios of 8 (95% CI: 6.4–10) and 0.22 (95% CI: 0.19–0.25), respectively. In addition, there was no major difference in accuracy estimates based on disease duration. The 0–3 year subgroup of studies had a sensitivity and specificity of 72% and 91%, respectively. This suggests US’s ability to detect disease pSS independent of disease duration. The moderately high positive likelihood ratio suggests that a positive US result, even in a patient with early pSS and a high pretest probability of pSS, can be used as the basis of diagnosis. This may allow for treatment without invasive testing in such cases. However, in addition to early disease, false-negative SG US findings may also occur in the subset of pSS patients who are SSA/SSB antibody negative. This is supported by the findings of studies that showed a significantly positive correlation between these antibodies and higher SG US scores.32,33 Based on our pooled sensitivity (72%) for early disease, however, the clinician may not confidently exclude pSS once US is negative. Such patients may require monitoring or retesting should symptoms persist.
Going beyond diagnosis with ultrasound
Once early diagnosis can be established, US may also be useful as an outcome measure. Recently, a randomized double-blinded multicenter study demonstrated statistically significant improvement in total US score after rituximab therapy compared with placebo in patients with pSS. 34 This is encouraging, and not only lends support that US is an importance diagnostic tool in pSS patients, as demonstrated in our systematic review, but also suggests that US can be used to evaluate treatment efficacy and aid the rationale for therapeutic advances for pSS patients.
In addition to the role of US in the diagnosis of pSS, it may have other clinical uses. Pretreatment US scores have been used as a prognostic marker for pSS treatment response. 35 Response to pSS treatments using US has also been described by other authors.12,34,36 Appraisal of such studies, however, were not part of this systematic review which primarily examined the diagnostic ability of US. Some cross-sectional studies 37 have shown some link between US and lymphoma but concluded that there is need for prospective studies to determine the predictive properties of US in parotid lymphogenesis.
Limitations and areas for further study
Studies with varied scoring ranges that were used and subgroup meta-analyses could not be performed for the 0–6 and 0–12 scoring range groups because of the small numbers of studies 2 in each of these categories. Also, the high heterogeneity, which is often the rule for Diagnostic Test Accuracy (DTA) reviews, may limit the strength of conclusions that can be drawn from meta-analyses. Clinical heterogeneity is common in DTA reviews due to varied patient populations, different US techniques and scoring, and different reference standards. Raw data were unavailable for included studies, and subgroup analyses based on demographics (sex and race) could not be performed. Furthermore, there are limitations to utilizing classification criteria, as employed in this systematic review. Classification criteria are intended to create well-defined, relatively homogenous cohorts for clinical research purposes to ensure comparability across studies.
Several authors have called for the addition of SG US to the existing ACR/EULAR criteria, stating its addition improves or maintains diagnostic performance.38–40 Van Nimwegen et al. 41 recently evaluated the performance of the ACR/EULAR criteria when SG US replaced current classification items and found SG US could replace the ocular staining score, Schirmer’s test, or unstimulated whole saliva flow in the classification of primary SS without decreasing the accuracy of the ACR/EULAR criteria. However, when SG US replaced the SG biopsy in the classification of primary SS or the measurement of anti-SSA antibodies, the performance of the criteria significantly decreased. These findings warrant further studies of a similar design before consensus can be reached on addition of SG US to traditional classification criteria. Further systematic reviews should focus on answering such questions regarding prognosis and monitoring of disease activity.
In summary, in our study, the diagnostic accuracy of SG US for the diagnosis of pSS was found to be favorable. The pooled diagnostic estimates found in this review were independent of the quality criteria, pSS diagnostic criteria, US scoring systems, disease duration and the age of subjects, supporting the robustness of these estimates.
In conducting this review, it was noted that there is a paucity of standard reporting on subgroup analyses based on seropositivity, associations between US and disease complications. There is also a need for more research comparing SG US and histology. Future DTA studies should consider these factors.
Conclusion
Data from the studies analyzed in our review showed encouraging results in terms of validity, accuracy and diagnostic values. The relatively higher specificity and positive likelihood ratios of USS in pSS in this review suggest its utility in diagnosing pSS in suspected patients, including those with early disease. Future systematic reviews should focus on determining the benefit of US as a prognostic tool and as an outcome measure following up response to therapy.
Footnotes
Appendix 1
Characteristics of included studies.

| Study ID | Study design | pSS class | Criteria for pSS used | Number of pSS subjects | Mean age of pSS subjects | Mean duration of pSS symptoms | Control |
Sonographic criteria referenced or used | USS scoring | ||
|---|---|---|---|---|---|---|---|---|---|---|---|
| Secondary SS | Sicca | Healthy | |||||||||
| Abd-Allah et al. 1 | CS | Confirmed | ACR 2 | 3 | 47 | 1.8 | 27 | De Vita et al. 3 | 0–3 | ||
| Andretta et al. 4 | CS | Confirmed | ECSG 5 | 23 | 50.2 | − | 50 | Makula et al. 6 | 0–4 | ||
| Ariji et al. 7 | CS | Confirmed | Sicca, xerostomia, SG biopsy, sialography and antibodies | 44 | − | − | 72 | Texture analysis of USS images | − | ||
| Astorri et al. 8 | R | Confirmed | AECG 9 | 36 | 52.2 | 9.6 | 49 | Salaffi et al.10,11 | 0–4 | ||
| Baldini et al. 12 | CS | Confirmed | AECG 9 | 50 | 47 | 2.3 | 57 | De Vita et al. 3 | 0–3 | ||
| Baldini et al. 13 | CS | Confirmed | Biopsy | 12 | − | − | 20 | Ultra-high-resolution US | 0–3 | ||
| Baldini et al. 14 | CS | Confirmed | Biopsy | 51 | − | − | 64 | Homogenity score | 0–4 | ||
| Barrio Nogal et al. 15 | CS | Confirmed | AECG 9 | 25 | − | − | 11 | Cornec et al. 2 | 0–4 | ||
| Bergner et al. 16 | CS | Confirmed | AECG 9 | 33 | − | − | 50 | 9 | Zhang et al. 17 | 0–48 | |
| Carotti et al. 18 | CS | Confirmed | ECSG 5 | 30 | 54 | 7.6 | 30 | Salaffi et al. 10 | 0–4 | ||
| Carr et al. 19 | CS | Confirmed | AECG 9 | 34 | 50 | − | 40 | Hypoechoic foci, parenchymal fibrosis and indistinct gland margins | − | ||
| Chen et al. 20 | CS | Confirmed | AECG 9 | 54 | 46 | 3.95 | 35 | Shear-wave elasticity | − | ||
| Chen et al. 21 | CS | Confirmed | AECG 9 | 51 | 47 | 35 | 50 | Hočevar et al. 22 shear-wave velocity | 0–3 | ||
| Chikui et al. 23 | CS | Confirmed | Revised Japanese criteria for SS (1999) 2 | 91 | − | − | 29 | 12 | Quantitative hurst analysis, qualitative: definitely present; : probably present; −: definitely absent | − | |
| Cornec et al. 24 | CS | Confirmed | AECG 9 | 60 | 57.1 | − | 87 | Echostructure coupled with power Doppler | 0–16 | ||
| Cornec et al. 25 | CS | Confirmed | AECG 9 | 78 | − | 6.4 | 69 | Echostructure | 0–4 | ||
| Cornec et al. 26 | CS | Confirmed | AECG 9 | 78 | 57.1 | 7.1 | 80 | De Vita et al. 3 | 0–16 | ||
| Cornec et al. 27 | CS | Confirmed | ACR 2 | 45 | 59.4 | 7.4 | 56 | Cornec et al. 26 | 0–4 | ||
| Corthouts et al. 28 | CS | Confirmed | − | 16 | − | − | 36 | USS reflectivity | − | ||
| Couderc et al. 29 | CS | Confirmed | ACR 20122 | 48 | − | 10.5 | 35 | Cornec et al. 26 | 0–4 | ||
| De Clerck et al. 30 | CS | Confirmed | Criteria proposed by Fox et al. 31 | 16 | − | − | 12 | Decrease echogenicity | |||
| Dejaco et al. 32 | CS | Confirmed | AECG 9 | 45 | 57.9 | 6.5 | 24 | 11 | Hočevar et al. 22 real-time sonoelastograpy; Rubaltelli et al. 33 | 0–48, 0–16 | |
| El Miedany et al. 34 | CS | Confirmed | AECG 9 | 47 | − | 6.8 | 20 | 20 | Makula et al. 6 | − | |
| Fana et al. 35 | CS | Confirmed | AECG 9 | 57 | 56 | − | 128 | Homogeneity and hypoechoic areas | |||
| Germanò et al. 36 | CS | Confirmed | AECG 9 | 36 | − | − | 46 | Ariji et al. 7 | − | ||
| Giuseppetti et al. 37 | CS | Confirmed | ECSG 5 | 23 | 54.9 | − | 17 | 20 | Contrast-enhanced US | − | |
| Haidmayer et al. 38 | CS | Confirmed | AECG 9 | 23 | − | − | 12 | Hočevar et al. 22 real-time sonoelastography; Rubaltelli et al. 33 | 0–48 | ||
| Hashimoto et al. 39 | CS | Confirmed | ACR/EULAR 63 | 80 | − | − | 17 | Shear wave velocity | 0–3 | ||
| Hofauer et al. 40 | CS | Confirmed | AECG 9 | 50 | 61.3 | − | 50 | Makula et al. 6 | 0–4 | ||
| Iorgovean et al. 41 | CS | Confirmed | AECG 9 | 9 | 53.7 | 5.3 | 12 | Theander and Mandl 42 | 0–3 | ||
| Jazzar et al. 43 | CS | Confirmed | AECG 9 | 174 | − | − | 70 | Brown 44 | − | ||
| Jousse-Joulin et al. 45 | CS | Confirmed | AECG 9 | 15 | − | − | 48 | USS scoring, elastography and elastometry | − | ||
| Kim et al. 46 | CS | Confirmed | ACR 201247 | 47 | − | − | 15 | Parenchymal echogenicity | 0–16 | ||
| Kim et al. 48 | CS | Confirmed | ACR/EULAR 9 | 87 | 54.1 | − | 17 | Salaffi et al. 10 | 0–16 | ||
| Law et al. 49 | CS | Confirmed | AECG 9 | 21 | 49 | − | 16 | Hočevar et al. 22 | |||
| Lee et al. 50 | CS | − | − | 80 | − | − | 42 | Echogenicity, homogeneity, hypoechoic areas, hyperechogenic reflections, and gland posterior borders | 0–48 | ||
| Lee et al. 51 | CS | Confirmed | AECG 9 | 94 | 55.6 | 6.4 | 44 | Hočevar et al. 22 | 0–48 | ||
| Luciano et al. 52 | CS | Confirmed | AECG 9 | 74 | 54.7 | − | 48 | Size, echogenicity, fibrosis and inhomogeneity | 0–3 | ||
| Luciano et al. 53 | CS | Confirmed | AECG 9 | 55 | 49 | 2.3 | 54 | De Vita et al. 3 | 0–6 | ||
| Makula et al. 6 | CS | Confirmed | ‘Preliminary criteria’ Vitali et al. 5 | 62 | 53.2 | − | 69 | De Vita et al. 3 | − | ||
| Martel et al. 2 | CS | Confirmed | AECG 9 | 39 | 59.1 | − | 22 | 36 | Milic et al. 54 | 0–12 | |
| Milic et al. 55 | CS | Confirmed | AECG 9 | 107 | 54 | − | 28 | Hočevar et al. 22 | 0–48 | ||
| Milic et al. 54 | CS | Confirmed | AECG 9 | 115 | 55.6 | − | 44 | 50 | 36 | De Vita et al. 3 | 0–12 |
| Milic et al. 56 | CS | Confirmed | AECG 9 | 140 | 54.5 | 4.84 | 50 | Salaffi et al. 11 | 0–16 | ||
| Milic et al. 57 | CS | Confirmed | AECG 9 | 205 | 53.4 | 5.6 | 87 | De Vita et al. 3 | 0–6 | ||
| Mossel et al. 58 | CS | Confirmed | AECG 9 | 49 | − | − | 47 | Hočevar et al. 22 | 0–48 | ||
| Murakami et al. 59 | CS | − | − | 37 | − | − | 43 | Wavelet analysis of US image | − | ||
| Napoli et al. 60 | CS | Confirmed | European Community Epidemiologic Committee criteria 5 | 22 | 50.6 | − | 12 | Volume, margins, structure and hypoechoic area | − | ||
| Niemela et al. 61 | CS | Confirmed | AECG 9 | 27 | 50 | 12 | 27 | 27 | Parenchymal inhomogeneity | 0–3 | |
| Nogal et al. 62 | CS | Confirmed | ACR/EULAR9,63 | 49 | − | − | 23 | Cornec et al. 26 | |||
| Oliver et al. 64 | CS | Confirmed | Biopsy | 32 | − | 2 | 13 | Size, homogeneity, hypoechoic areas, hyperechoic foci, power Doppler and margins | − | ||
| Pascual et al. 65 | CS | Confirmed | AECG 9 | 13 | − | − | 12 | Parenchymal inhomogeneity | 0–3 | ||
| Poul et al. 66 | R | Confirmed | AECG 9 | 36 | 60 | − | 9 | 15 | Reflectivity, heterogeneity or nodular parenchyma with a honeycomb appearance | − | |
| Qi et al. 67 | CS | Confirmed | AECG 9 | 134 | 49.8 | 4.89 | 109 | De Vita et al. 3 | 0–16 | ||
| Salaffi et al. 10 | CS | Confirmed | AECG 5 | 30 | − | − | 30 | Homogeneity | 0–16 | ||
| Salaffi et al. 11 | CS | Confirmed | AECG 9 | 77 | 54 | 2.9 | 79 | Salaffi et al. 10 | 0–16 | ||
| Shimizu et al. 68 | CS | Confirmed | Revised Japanese criteria 69 | 48 | 53.5 | − | 32 | Inhomogeneity | − | ||
| Shimizu et al. 70 | CS | Confirmed | Revised Japanese criteria 69 | 43 | 53.1 | − | 29 | Shimizu et al. 68 | − | ||
| Takagi et al. 71 | CS | Confirmed | AEC criteria 9 | 188 | 56 | − | 172 | Ariji et al. 7 | − | ||
| Theander and Mandl 42 | CS | Confirmed | AECG 9 | 105 | 61 | 12.3 | 57 | Hočevar et al. 22 | 0–3 | ||
| Tsao et al. 72 | CS | − | EULAR Sjögren’s Syndrome Patient-Reported Index questionnaires 73 | 31 | − | − | 8 | 13 | Takagi et al. 71 | 0–16 | |
| Tsao et al. 74 | CS | − | Biopsy | 47 | − | − | 9 | 18 | SGUS score | 0–16 | |
| Van Nimwegen et al. 75 | CS | Confirmed | ‘Clinical diagnosis’ | 147 | 53 | − | 96 | Hočevar et al. 22 | 0–3 | ||
| Xia et al. 76 | CS | Confirmed | AEC 9 /ACR 47 | 105 | 56.4 | 5 | 41 | 16 | Hočevar et al. 22 | 0–16 | |
| Zhang et al. 17 | CS | Confirmed | − | 105 | − | − | 41 | 16 | Echostructure | 0–16 | |
ACR, American College of Rheumatology; AEC, American European Classification Criteria; AECG, American European Consensus Group; CS, cross sectional; ECSG, European Community Study Group; EULAR, European League Against Rheumatism; pSS, primary Sjögren’s syndrome: not stated or unable to extract data; R, retrospective; SG, salivary gland; SGUS, salivary gland ultrasound; SS, Sjögren’s syndrome; US, ultrasound; USS, ultrasound scan.
Conflict of interest statement
JAS has received consultant fees from Crealta/Horizon, Medisys, Fidia, UBM LLC, Trio Health, Medscape, WebMD, Clinical Care Options, ClearView Healthcare Partners, Putnam Associates, Focus Forward, Navigant Consulting, Spherix, Practice Point Communications, the National Institutes of Health and the American College of Rheumatology. JAS owns stock options in Vaxart pharmaceuticals and Charlotte’s Web Holdings, Inc. JAS previously owned stock options in Amarin, Viking and Moderna pharmaceuticals. JAS is on the speaker’s bureau of Simply Speaking. JAS is a member of the executive of OMERACT, an organization that develops outcome measures in rheumatology and receives arms-length funding from 12 companies. JAS serves on the US Food and Drug Administration Arthritis Advisory Committee. JAS is the chair of the Veterans Affairs Rheumatology Field Advisory Committee. JAS is the editor and the director of the UAB Cochrane Musculoskeletal Group Satellite Center on Network Meta-analysis. JAS previously served as a member of the following committees: member, the ACR’s Annual Meeting Planning Committee (AMPC) and Quality of Care Committees, the chair of the ACR Meet the Professor, Workshop and Study Group Subcommittee and the co-chair of the ACR Criteria and Response Criteria subcommittee. All other authors state that they do not have any financial disclosures.
Funding
The authors received no financial support for the research, authorship, and/or publication of this article.